Background: Molecular mechanism underlying cell-cell contact-dependent cell shape change has remained elusive.
Results: The activation of EphrinA1/EphA2 results in dephosphorylation of Ezrin through the phosphorylation of p190RhoGAP-A.
Conclusion: Ezrin at the apical domain regulates the cell shape and is regulated by ephrinA1/EphA2 signaling upon cell-cell contacts.
Significance: Exploring the molecular mechanism underlying cell shape change contributes to the understanding epithelial-mesenchymal transition.
Keywords: Cell Adhesion, Cell Polarity, Epithelial-Mesenchymal Transition, Epithelial Cell, Ezrin
Abstract
The epithelial cells exhibit either a columnar or a flat shape dependent on extracellular stimuli or the cell-cell adhesion. Membrane-anchored ephrinA stimulates EphA receptor tyrosine kinases as a ligand in a cell-cell contact-dependent manner. The mechanism through which ephrinA1/EphA2 signal regulates the cell morphology remains elusive. We demonstrate here that ephrinA1/EphA2 signal induces compaction and enhanced polarization (columnar change) of Madin-Darby canine kidney epithelial cells by regulating Ezrin, a linker that connects plasma membrane and actin cytoskeleton. Activation of EphA2 resulted in RhoA inactivation through p190RhoGAP-A and subsequent dephosphorylation of Ezrin on Thr-567 phosphorylated by Rho kinase. Consistently, the cells expressing an active mutant of Ezrin in which Thr-567 was replaced with Asp did not change their shape in response to ephrinA1. Furthermore, depletion of Ezrin led to compaction and enhanced polarization without ephrinA1 stimulation, suggesting the role for active Ezrin in keeping the flat cell shape. Ezrin localized to apical domain irrespective of ephrinA1 stimulation, whereas phosphorylated Ezrin on the apical domain was reduced by ephrinA1 stimulation. Collectively, ephrinA1/EphA2 signal negatively regulates Ezrin and promotes the alteration of cell shape, from flat to columnar shape.
Introduction
Epithelial cells dynamically reorganize their morphology in response to extracellular signals, during embryogenesis, wound healing, and other biological processes (1, 2). These cell morphological changes are observed as epithelial-mesenchymal transition and its reverse process (mesenchymal-epithelial transition) (3, 4). Epithelial cells have firm adhesions to their neighboring cells to establish cell-cell contact by homophilic association of epithelial cell-cadherin (E-cadherin) supported by actin cytoskeleton and preserve apical to basolateral polarity at the cell-cell contacts (5). When the cells lose the cell-cell contacts and polarity, they transit to mesenchymal cells. However, even in the epithelial state, they change their morphology: between fully columnar shape and flat cell shape with cell-cell adhesions (6). Although the columnar epithelial cells are characterized by the full compaction and enhanced polarization, the flat cells are characterized by the decreased lateral domain with subtle E-cadherin-dependent cell-cell junctions. However, it is not fully understood how epithelial cells change their shape. Not only extracellular stimuli but also cell-cell adhesion molecules that regulate actin cytoskeleton are involved in these morphological changes.
Ezrin is a member of the Ezrin/Radixin/Moesin (ERM)3 family that regulates actin cytoskeleton by linking plasma membrane proteins, including CD44, Podoplanin, and Podocalyxin/gp135 to cell cortical actin fibers (7–11). Ezrin does not directly regulate the apical to basolateral polarity; however, it is indirectly involved in regulation of cell morphology by binding to actin (7, 8). Ezrin is thought to be folded in an inactive form through an intramolecular interaction between its NH2-terminal domain and the COOH-terminal domain. Ezrin becomes active by binding to phosphatidylinositol 4,5-bisphosphate (PIP2) and by being phosphorylated at Thr-567 by Rho kinase, protein kinase C, or NF-κB-inducing kinase (7, 8, 12–15). The unfolded active Ezrin can finally bind to both actin cytoskeleton and plasma membrane proteins to function at the apical cell membrane. It is still unclear how Ezrin is dephosphorylated, although increased cell density of endothelial cells leads to dephosphorylation of ERM, probably by cell-cell contact-dependent signal (16).
EphA and EphB (erythropoietin-producing hepatocellular carcinoma A and B) tyrosine kinase receptors are activated by binding to their ligands, ephrinA anchored to the plasma membrane and ephrinB passing the membrane, respectively (17). Thus, Eph receptor signals extracellular stimulus to the inside of the cells in a manner dependent on cell-cell contacts. Among EphA receptors (EphA1–EphA8 and EphA10), EphA2 is expressed in various cells including epithelial cells and endothelial cells (18, 19). Because ephrinA1 is similarly expressed in epithelial and endothelial cells to EphA2, ephrinA1 induces EphA2 activation upon cell-cell contacts. We previously reported that activation of EphA2 by ephrinA1 induces compaction and enhanced polarization of Madin-Darby canine kidney (MDCK) epithelial cells (20). This morphological change is ascribed to an inactivation of ADP-ribosylation factor 6 (Arf6) by EphA2-Nck1-Git1 pathway. Our data suggested that there might be other signaling pathways besides inactivation of Arf6 in ephrinA1-induced cell compaction. In MDCK cells, ectopic expression of Podoplanin induces epithelial-mesenchymal transition through the activation of Ezrin and RhoA (21), indicating an involvement of Ezrin in flattening of the cells lacking cell-cell contacts. Therefore, ephrinA1/EphA2 might counteract or negatively regulate Ezrin-controlled cell shape change.
Apical to basolateral polarity is well maintained in the columnar cells (5). Increased height of lateral domain is shown by an increase in E-cadherin expression at the cell-cell contacts. Conversely, loss of lateral domain is evidenced by a decrease in E-cadherin expression. In clear contrast, apical surface is clearly characterized by the expression of Podocalyxin/gp135 or Ezrin as well as Crumb/Par6/atypical PKC (22). Localization of Par complex is determined by a small GTPase, Cdc42. Other small GTPases are also participated in organizing cell polarity and changing cell shapes (22), because Rho family GTPases are well known to regulate actin cytoskeleton in the presence or absence of cell-cell contacts.
In this study, we aimed at investigating how ephrinA1/EphA2 signal induces compaction with polarization of MDCK cells. Ezrin was essential for maintaining the flat morphology of the cells. EphrinA1/EphA2 signal inactivated Rho-Rho kinase signal that phosphorylates Ezrin, thereby inducing compaction of MDCK cells.
EXPERIMENTAL PROCEDURES
Reagents, Antibodies, and siRNAs
Reagents were purchased as follows: nonclustered EphrinA1-Fc, and Control Fc from R & D Systems; Y-27632 from Calbiochem; and neomycin from Sigma-Aldrich. Anti-gp135 antibody and anti-phosphatidylinositol 4-phosphate 5-kinase antibodies were gifts from W. J. Nelson (Stanford University) and Y. Kanaho (Tsukuba University, Tsukuba, Japan), respectively. Other antibodies were purchased as follows: anti-Ezrin/Radixin/Moesin, anti-phospho-ERM detecting phosphorylation of Ezrin (Thr-567)/Radixin (Thr-564)/Moesin (Thr-558) (41A3), anti-p190RhoGAP-A, and anti-PIP5K1C from Cell Signaling Technology; anti-Ezrin (3C12), anti-EphA2 (C-20), anti-RhoA (26C4), and anti-Arf6 (3A-1) from Santa Cruz Biology; anti-E-cadherin (clone ECCD-2) from Takara Bio Inc.; anti-FLAG (M2), and anti-β-actin from Sigma-Aldrich; anti-phosphotyrosine (4G10® Platinum) from Millipore; anti-ZO-1, rhodamine-phalloidin, and Alexa Fluor 633 phalloidin from Invitrogen; anti-HA (3F10) from Roche Applied Science; horseradish peroxidase-coupled goat anti-mouse, anti-rat, and anti-rabbit IgG from GE Healthcare and Cell Signaling Technology, respectively; and Alexa Fluor 488- and Alexa Fluor 546-labeled secondary antibodies from Molecular Probes. siRNAs targeting the genes and their irrelevant siRNAs duplex were purchased from Sigma-Aldrich.
Nucleotide sequences for siRNAs used were as follows: for Ezrin number 1, 5′-GCCUUAGGGAAGUGUGGUA-3′; for Ezrin number 2, 5′-CCAAGUGAAGGAGGGAAUU-3′; for RhoA number 1, 5′-CCGGAAGAAACUGGUGAUU-3′; for RhoA number 2, 5′-GCAGGUAGAGUUGGCUUUG-3′; for Arf6, 5′-GCACCGCAUUAUCAAUGACC-3′; for p190RhoGAP-A, 5′-GCUACUCAUAUGUACGAUA-3′; for PIP5KΑ number 1, 5′-GCAACUCCUGCAUUACUUA-3′; for PIP5KΑ number 2, 5′-CCACAGCUAUGGAAUCCAU-3′; for PIP5KC number 1, 5′-GGAAGAAUUCCUCCCUGAA-3′; and for PIP5KC number 2, 5′-CCGCCACAGACAUCUACUU-3′.
Plasmids
cDNA fragment encoding Ezrin was amplified by PCR using the Ezrin cDNA kindly provided by Sa. Tsukita (Osaka University, Japan) as a template and a primer set containing HindIII and EcoRI sites; 5′-TTAAGCTTGCCACCATGCCCAAGCCAATCAACGTCCGGGTG-3′ and 5′-AAAGAATTCCCATGGCCTCGAACTCGTCAATGCGTTG-3′.The resulting fragment was inserted into p3xFLAG-N1 vector (designated as p3xFLAG-N1-Ezrin). The plasmid expressing a mutant Ezrin (T567D) was developed by QuikChange site-directed mutagenesis kit (Stratagene) using p3xFLAG-N1-Ezrin as a template and a primer set: 5′-AAGTATAAGGACCTGCGGCAAATCAGGCAGGGCAAG-3′ and 5′-GATTTGCCGCAGGTCCTTATACTTGTCCCTGCCTTG-3′. The plasmid expressing a mutant Ezrin that cannot bind to PIP2 (K253N,K254N,K262N,K263N, hereafter called PIP2 mut) was developed using p3xFLAG-N1-Ezrin as a template and primer sets: 5′-TCTTTCAACGACAATAACTTTGTCATTAAGCCCATC-3′, 5′-CTTAATGACAAAGTTATTGTCGTTGAAAGAGATGTTC-3′, 5′-AAGCCCATCGACAACAATGCACCTGACTTTGTGTTCTAC-3′, and 5′-AAAGTCAGGTGCATTGTTGTCGATGGGCTTAATG-3′. The plasmid expressing Ezrin resistant to siRNA for WT Ezrin, the target of siRNA was mutated using the following primer set: 5′-GGTCTCCGCGAGGTCTGGTACTTCGGCCTC-3′ and 5′-GTACCAGACCTCGCGGAGACCAATCGTC-3′. cDNA fragment encoding p190RhoGAP-A was amplified by PCR using the p190RhoGAP-A cDNA provided by Kazusa DNA Research Institute as a template and a primer set containing NotI and BamHI sites: 5′-ATAGCGGCCGCAATGATGATGGCAAGAAAGCAAGATG-3′ and 5′-ATAGGATCCTCACAGCGTGTGTTCGGCTTGAAG-3′. The resulting fragment was inserted into p3xFLAG-C1 vector and designated as p3xFLAG-C1-p190RhoGAP-A. The plasmid expressing p190RhoGAP-A resistant to siRNA was constructed using the following primer set in which the target site of siRNA for p190RhoGAP-A was mutated: 5′-TCGAGGCCACACATATGTATGACAATGCTGCCGAGG-3′ and 5′-GCATTGTCATACATATGTGTGGCCTCGATTATGTTC-3′.
Adenovirus and Infection
The cDNA encoding human EphA2 mutant, which lacks the cytoplasmic region (EphA2Δcyto, amino acids 1–574), was amplified by PCR using human EphA2 cDNA (a gift from A. Sakakibara, Nagoya University) as a template. The amplified fragment was subcloned into pCMV-HA vector. cDNA fragment encoding COOH-terminal HA-tagged EphA2Δcyto was inserted into the pShuttle vector (Clontech, Mountain View, CA). The adenovirus was produced by using the Adeno-X system according to the manufacturer's protocol (Clontech). Recombinant adenovirus expressing β-gal was kindly provided by M. Matsuda (Kyoto University). The subconfluent MDCK cells were infected with adenoviruses at the appropriate of multiplicity of infection for 24 h and replated for the experiments.
Cell Culture, Transfection, and siRNA-mediated Protein Knockdown
MDCK cells, obtained from S. Tsukita (Osaka University) were cultured as described previously (20). The cells were placed onto ∼35- and ∼100-mm plastic plates at 3 × 10⁵ cells and cultured for 48 h to obtain confluent and sparse cell cultures, respectively. MDCK cells were transfected with cDNA or oligonucleotide duplexes by using a reverse transfection method, according to the manufacturer's instructions (Invitrogen). In brief, the cells were trypsinized, washed with PBS, suspended in DMEM with 10% fetal calf serum (HyClone Laboratories), and plated onto a plastic dash in the presence of plasmid DNA or oligonucleotide duplexes mixed with Lipofectamine 2000 (Invitrogen) in OptiMEM (Invitrogen). MDCK cells for immunofluorescence studies were cultured on the glass-bottomed dishes. The cells transfected with plasmids or siRNAs for 48 h as indicated in the figures were used for the immunoblot analyses or immunofluorescence studies. MDCK cells were stimulated with 125 ng/ml of nonclustered ephrinA1-Fc or 62.5 ng/ml of control Fc during the time points indicated in the figure without any starvation. The cells were also treated with the drugs Y-27632 (20 μm) and neomycin (500 μm) for the time indicated in the figures.
Immunoprecipitation, GST-Rhotekin Pulldown Assay, and Immunoblot Analysis
The cells were washed with PBS; lysed in ice-cold lysis buffer containing 1% Nonidet P-40, 50 mm Tris-HCl, pH 7.4, 150 mm NaCl, 5 mm EDTA, 1 mm Na3VO4, 1 mm DTT, 1 mm phenylmethylsulfonyl fluoride, 5 μg/ml aprotinin, 2 μg/ml leupeptin, and 3 μg/ml pepstatin A; and centrifuged at 20,000 × g for 5 min at 4 °C. The supernatant was used for the immunoprecipitation and immunoblot analyses. Immunoprecipitation assays were performed using antibodies coupled with biotin-conjugated F(ab′)2 fragments of goat anti-rabbit IgG, coupled to streptavidin-Sepharose beads, as described previously (20). RhoA activity was measured using GST-rhotekin as described previously (23). The cells were lysed in a lysis buffer containing 1% Triton X-100, 20 mm Tris-HCl, pH 7.4, 100 mm NaCl, 10 mm MgCl2, 1 mm EGTA, and 1 mm DTT and centrifuged at 20,000 × g for 10 min. The supernatant was incubated with GST-rhotekin conjugated to glutathione-Sepharose beads for 40 min at 4 °C. To enhance the detection sensitivity for RhoA on the immunoblot membrane, Can Get Signal (TOYOBO) was used to dilute the anti-RhoA antibody for immunoblot analyses.
Fractionation of Ezrin
Fractionation of soluble or insoluble Ezrin were performed as described previously (24). MDCK cells cultured on a 35-mm dish were washed twice with ice-cold PBS and scraped off in 500 μl of an ice-cold sonication buffer (150 mm NaCl, 1 mm EGTA, 1 mm DTT, 10 μg/ml leupeptin, 10 mm Hepes buffer, pH 7.5, and 20 mm NaF). The resuspended cells were sonicated in a 1.5-ml tube and centrifuged at 10,000 × g for 10 min at 4 °C. The supernatant and the pellet were used as soluble and insoluble fraction, respectively.
Immunofluorescence Microcopy
MDCK cells grown on the glass-bottomed dishes after the stimulation with ephrinA1-Fc or after the treatment with drugs or siRNAs were fixed in PBS containing 4% formaldehyde for 20 min at room temperature, permeabilized with 0.05% Triton X-100 in PBS for 5 min, and blocked with PBS containing 2% BSA for 10 min. The cells were incubated with first antibody for 1 h at room temperature and with Alexa 488- or Alexa 546-labeled secondary antibodies for 30 min at room temperature. To visualize F-actin, the cells were incubated with rhodamine-phalloidin or Alexa Fluor 633 phalloidin for 30 min at room temperature. Fluorescence images of Alexa Fluor 488, Alexa Fluor 546, Alexa Fluor 633, and rhodamine were recorded with a FV1000 confocal microscope (Olympus Corporation). Cell areas obtained from the XY image immunostained with anti-E-cadherin antibody were quantitatively analyzed using the MetaMorph software (Molecular Devices). The XY image shown in the figures represents a typical image obtained from at least three independent experiments. The cell area determined by the confocal XY plane of the cells was calculated using the MetaMorph software (Molecular Devices). In each image, at least more than 100 cells were used for measuring the area. The results of the quantitative analyses were shown as averages with standard deviations. Each figure of microscopical analysis shows representative results observed in at least three independent experiments.
Statistical Analysis
The values are expressed as the means ± S.D. Differences among multiple groups were compared by one-way analysis of variance followed by a post hoc comparison test with Scheffe's method or by unpaired t test. A p value < 0.05 was considered statistically significant.
RESULTS
Active Ezrin Maintains Flat Cell Shape and Inhibits Compaction Induced by ephrinA1 in MDCK Cells
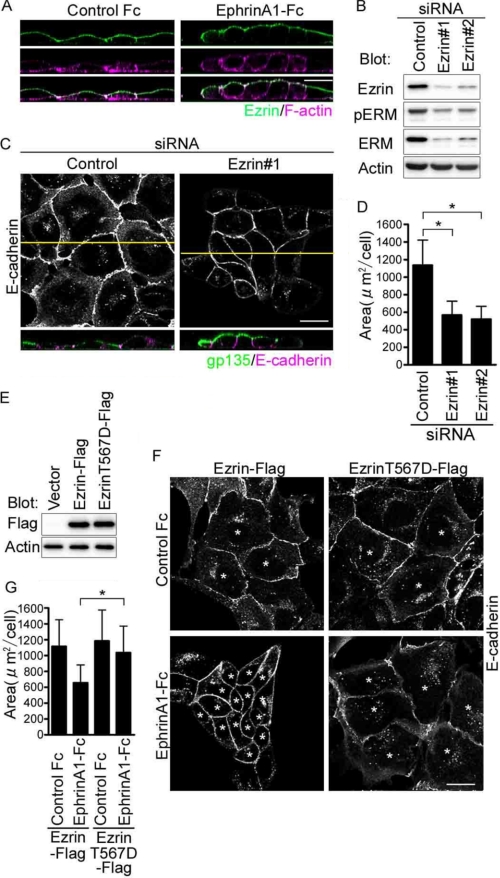
Active Ezrin induces cell flattening, whereas ephrinA1/EphA2 signal induces compaction with polarization (20, 25). Therefore, we hypothesized that ephrinA1/EphA2 signal might affect the regulation of Ezrin. Before testing this hypothesis, we examined the expression of ERM proteins in MDCK cells and the localization of Ezrin with actin (Fig. 1A), because active Ezrin is known to bind actin filament. Ezrin clearly localized to the apical cell surface with actin filaments in unstimulated MDCK cells. Depletion of Ezrin by siRNAs paralleled the decrease of ERM detected by anti-ERM antibody, which recognizes all ERM family members, indicating that MDCK cells express mainly Ezrin of ERM family proteins (Fig. 1B).
FIGURE 1.
EphrinA1/EphA2 signal induces compaction by inhibiting Ezrin that maintains the flat shape of MDCK cells. A, the confocal XZ images of the MDCK cells immunostained with anti-Ezrin and stained with rhodamine-phalloidin after the stimulation of either control Fc (left panel) or ephrinA1-Fc (right panel) for 4 h. B, immunoblot analyses with the antibodies indicated at the left using the cell lysates from the MDCK cells treated with siRNAs indicated on the top. C, MDCK cells immunostained with anti-E-cadherin and anti-gp135 after the treatment with siRNAs indicated on the top. The confocal XY image displays the channel of Alexa 546 detecting anti-E-cadherin (top panel). The XZ image displays both channel of Alexa 488 detecting anti-gp135 and Alexa 546 detecting anti-E-cadherin (bottom panel). The yellow line in the XY image denotes the plane for the XZ image. D, area of the cells treated with siRNAs indicated at the bottom in E was calculated by measuring the individual cell area (at least more than 100 cells in each experiment) using the MetaMorph as described under “Experimental Procedures.” The value (area) indicates the mean with S.D. E, immunoblot analyses with the antibodies indicated at the left using the lysates from the cells transfected with the plasmid indicated at the top. F, the confocal XY images of the cells transfected with the plasmids indicated at the top, stimulated with either control Fc or ephrinA1-Fc for 4 h, and immunostained with E-cadherin. Asterisks indicate the cells expressing Ezrin-FLAG. G, area of the cells marked by asterisks in F was calculated as described for D. Bar, 20 μm (throughout the figures).
To understand the loss of function of Ezrin, we imaged the MDCK cells depleted of Ezrin. Ezrin depletion resulted in compaction with polarization as evidenced by the increased height of lateral cell-cell contacts marked by E-cadherin, by the increased expression of gp135 on the apical cell surface, and by the decreased area of XY plane of individual cell (Fig. 1, C and D). We confirmed that the effect of Ezrin depletion using siRNAs on cell morphological change was indeed ascribed to the depletion of Ezrin by performing rescue experiments in which we overexpressed Ezrin resistant to the siRNA for endogenous Ezrin. When Ezrin resistant to siRNA was introduced into Ezrin siRNA-treated cells, the compaction by depletion of Ezrin was reversed (supplemental Fig. S1). Thus, these results support the notion that Ezrin is essential for the maintenance of the flat cell shape of MDCK cells.
To understand the gain of function of Ezrin, we observed the MDCK cells expressing active form of Ezrin (T567D). There was no morphological change between the cells expressing WT Ezrin and those expressing active Ezrin in resting state (Fig. 1, E–G), suggesting that Ezrin in MDCK cells is active without any stimulation. We further investigated the morphological change induced by ephrinA1 stimulation. Although MDCK cells expressing WT Ezrin exhibited compaction, those expressing Ezrin T567D resistant to dephosphorylation kept their flat cell shape (Fig. 1F). These data suggest that Ezrin functions to maintain the flat shape and might be inactivated by ephrinA1 stimulation.
Negative Regulation of Ezrin by ephrinA1/EphA2 Signal
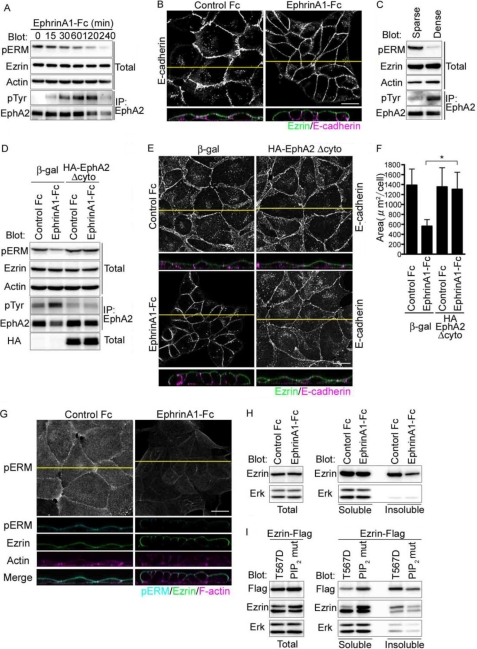
To examine whether the activity of Ezrin is regulated by ephrinA1-triggered signaling, we investigated the phosphorylation of Ezrin that reflects its activity (Fig. 2A). When MDCK cells were stimulated with ephrinA1, Ezrin among ERM proteins were dephosphorylated in a time-dependent manner. Consistently, the cells stimulated with ephrinA1 became compact in parallel with dephosphorylation of Ezrin (Fig. 2B). EphA2 is known to be activated in epithelial cells cultured at confluent condition (20, 26). We examined the relevance of EphA2 activation to the dephosphorylation of Ezrin (Fig. 2C). Presumably, EphA2 was activated by ephrinA ligand expressed on MDCK cells. Dephosphorylation of Ezrin correlated with the activation of EphA2. This result was consistent with the result obtained in the MDCK cells stimulated with ephrinA1-Fc.
FIGURE 2.
EphrinA1/EphA2 signal induces dephosphorylation of Ezrin. A, immunoblot analyses using the antibodies indicated at the left using the cell lysates (total) or the immunoprecipitates with anti-EphA2 (IP: EphA2) prepared from the cells treated with ephrinA1-Fc during the time indicated at the top. B, the confocal images of MDCK cells immunostained with anti-Ezrin and anti-E-cadherin after the stimulation with either control Fc (left) or ephrinA1-Fc (right) for 4 h. The XY image displays the channel of Alexa 546 detecting anti-E-cadherin. The XZ image displays two channels of both Alexa 488 detecting anti-Ezrin and Alexa 546 detecting anti-E-cadherin. The yellow line denotes the plane for the confocal XZ image. C, immunoblot analyses with the antibodies indicated at the left using the cell lysates (total) or the immunoprecipitates with anti-EphA2 (IP: EphA2) from the cells cultured at either sparse or dense condition. D, immunoblot analyses of the immunoprecipitates using anti-EphA2 (IP: EphA2) or cell lysate (total) from the MDCK cells infected with the adenovirus expressing either β-galactosidase (β-gal) or HA-tagged EphA2 lacking cytoplasmic domain (HA-EphA2Δcyto) indicated at the top using antibodies indicated at the left. E, confocal images of the MDCK cells infected with the adenovirus indicated at the top after the treatment of either control Fc (upper panels) or ephrinA1-Fc (lower panels). The top (XY) and bottom (XZ) panels were the confocal images for the cells immunostained with anti-E-cadherin or with both anti-E-cadherin and anti-Ezrin, respectively. The yellow lines in the XY image denote the plane for the confocal XZ image. F, quantitative analyses of the individual cell area calculated using XY images of E. G, the image for phospho-ERM (top panels) is the projection image of stacked XY image. The lower panels are the confocal images of the MDCK cells immunostained with anti-phospho-ERM (pERM) or anti-Ezrin and stained with Alexa Fluor 633 phalloidin after ephrinA1-Fc stimulation. The XZ images display the merged image of pERM, Ezrin, and F-actin (bottom panel). H, immunoblot analyses of the lysate (left panel) and the soluble or insoluble fraction (right panel) of the MDCK cells treated with either ephrinA1-Fc using the antibodies indicated at the left. I, immunoblot analyses of MDCK cells fractioned after the transfection with the plasmids expressing FLAG-tagged either the phosphorylation mimic mutant (T567D) or that incapable of PIP2 binding (PIP2 mut) as described under “Experimental Procedures” using the antibodies indicated at left.
We further confirmed the essential signal mediated by ephrinA1-EphA2 by overexpressing EphA2 lacking the cytoplasmic domain (EphA2Δcyto) that could sequester ephrinA1 or other EphA ligands, because we could not completely exclude the involvement of EphA family receptors besides EphA2 upon ephrinA1 stimulation. Overexpression of EphA2Δcyto resulted in the reduced phosphorylation of EphA2 by ephrinA1 (Fig. 2D). We confirmed that most of the cells expressed the mutant EphA2 when the cells were adenovirally infected (supplemental Fig. S2). Conversely, dephosphorylation upon ephrinA1 stimulation was reversed. Consistently, the columnar shape change promoted by ephrinA1 stimulation was abrogated in the cells expressing this mutant EphA2 (Fig. 2, E and F), indicating the essential role for EphA2 in ephrinA1-triggered signal and ephrinA1-induced dephosphorylation of Ezrin.
Although Ezrin was dephosphorylated by ephrinA1 stimulation, the localization of Ezrin on the apical surface of MDCK cells was not changed. However, it was of note that phosphorylated Ezrin on the apical domain was clearly decreased after the ephrinA1 stimulation (Fig. 2, B and G). We assumed that the columnar shape changes of the MDCK cells induced by ephrinA1 stimulation must be accompanied with actin cytoskeletal change. Because phosphorylated Ezrin on Thr-567 is thought to bind to actin, we quantitatively analyzed the amount of Ezrin binding to actin before and after ephrinA1 stimulation. Ezrin bound to actin filaments detected in insoluble fraction was decreased in the MDCK cells stimulated with ephrinA1 (Fig. 2H). The correct fractionation was confirmed by the data that T567D mutant was increased in insoluble fraction, whereas a mutant Ezrin incapable of binding to PIP2 was increased in soluble fraction (Fig. 2I). Collectively, these results suggest that the ephrinA1/EphA2 signal negatively regulates Ezrin by promoting dephosphorylation of Ezrin at the apical surface of MDCK cells and induces dissociation of actin filaments from Ezrin for the morphological changes.
RhoA-Rho Kinase Signal Is Required for Maintaining Flat Cell Shape
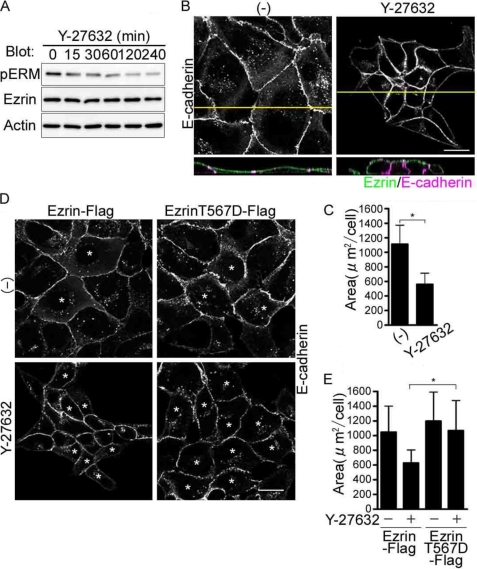
To understand how Ezrin is phosphorylated in the resting MDCK cells, we first examined the effect of Rho kinase inhibitor Y-27632 on phosphorylation of Ezrin, because phosphorylation of Thr-567 is known to be regulated by Rho kinase (13). Phosphorylation of Ezrin decreased in a time-dependent manner (Fig. 3A). MDCK cells treated with Y-27632 became compact as those depleted of Ezrin did (Figs. 3, B and C, and 1, C and D). The columnar cell change with increased lateral domain marked by E-cadherin was observed in the three-dimensional confocal image as in those depleted of Ezrin (Fig. 3, B and C). The cell compaction was also evidenced by the decrease in the area of XY image of individual cell (Fig. 3C). In contrast, the MDCK cells expressing a mutant Ezrin that mimicked the constitutive phosphorylation of Thr-567 (T567D) did not change cell shape (Fig. 3, D and E). These data suggest that the phosphorylation of Ezrin by Rho kinase is essential for maintaining flat cell shape in MDCK cells.
FIGURE 3.
Inhibition Rho kinase leads to the dephosphorylation of Ezrin and compaction of MDCK cells. A, immunoblot analyses with the antibodies indicated at left using the cell lysates from the MDCK cells treated with a Rho kinase inhibitor, Y-27632, for the time indicated at the top. B, the confocal images of the cells treated with Y-27632 for 4 h were obtained as described in the legend of Fig. 2B. C, area of the XY plane was analyzed as described in the legend of Fig. 1D. D, confocal images of the MDCK cells transfected the plasmids indicated at the top and treated with either vehicle (−) or a Rho kinase inhibitor, Y-27632, and immunostained with anti-E-cadherin. Asterisks denote the cells expressing Ezrin-FLAG or EzrinT567D-FLAG. E, quantitative analyses of the cell area calculated using the XY images in D.
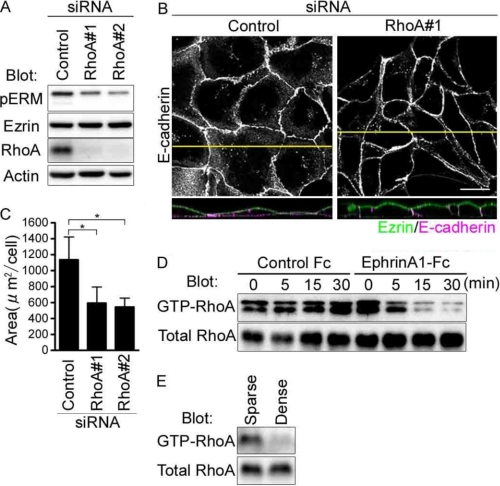
We then tried to test whether RhoA is responsible for Rho kinase-dependent phosphorylation of Ezrin. Depletion of RhoA using RhoA siRNAs led to the dephosphorylation of Ezrin (Fig. 4A). Consistently, RhoA-depleted cells showed columnar shape as those treated with Y-27632 did (Fig. 4B). The increased height of lateral domain indicated by the increased accumulation of E-cadherin at the cell-cell contacts shown in the XZ image was clearer in the cells depleted of RhoA than those treated with control siRNA (Fig. 4, B and C). These results indicate that activation of RhoA-Rho kinase signal is essential for phosphorylation of Ezrin that maintains the flat cell shape.
FIGURE 4.
EphrinA1/EphA2 signal inactivates RhoA that is required for maintaining the flat shape of MDCK cells. A, immunoblot analyses with the antibodies indicated at the left using the cell lysates of the MDCK cells treated with siRNAs indicated at the top. B, the confocal images of the cells transfected with siRNAs indicated at the top were obtained as described in the legend of Fig. 2B. C, area was calculated as described in the legend of Fig. 1D. D and E, pulldown analyses with the antibodies indicated at the left using the lysates of the MDCK cells stimulated with ephrinA1-Fc (D) or those cultured at different density (E).
EphrinA1/EphA2 Signal Induces Inactivation of RhoA
To test whether ephrinA1/EphA2 signal-induced dephosphorylation of Ezrin is dependent on inactivation of RhoA-Rho kinase signal in MDCK cells, we measured the GTP-bound RhoA in the cells stimulated with ephrinA1 by pull-down assay. GTP-bound RhoA was decreased in a time-dependent manner in response to ephrinA1 stimulation (Fig. 4D). When EphA2 was activated in MDCK cells cultured at the confluent condition, Ezrin was dephosphorylated (Fig. 2C). Therefore, we examined whether GTP-bound RhoA is decreased under confluent condition and found that GTP-RhoA was decreased (Fig. 4E). These results were consistent with the previous evidence that the increased cell density parallels the decreased RhoA activation (27). These results suggest that ephrinA1/EphA2 signal inactivates Ezrin by inhibiting the RhoA-Rho kinase signal that phosphorylates Ezrin.
p190RhoGAP-A Is Essential for ephrinA1/EphA2 Signal-mediated Dephosphorylation of Ezrin and Compaction with Polarization
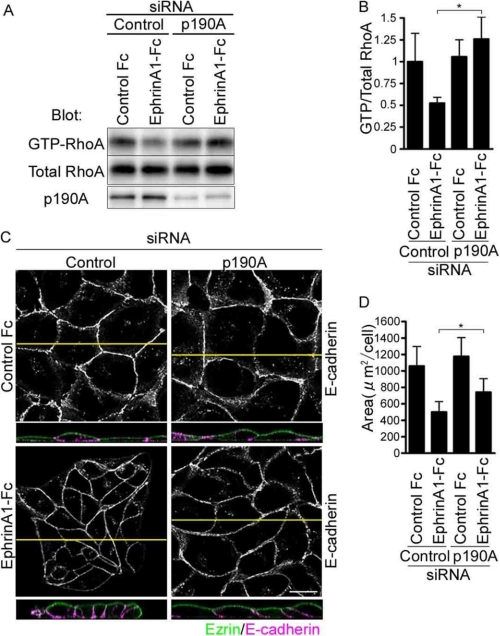
p190RhoGAP-A is reported to inactivate 2RhoA by accelerating hydrolysis of GTP on RhoA in MDCK cells, whereas cell-cell contacts are tightly formed (28). Thus, we hypothesized that p190RhoGAP-A might function downstream of EphA2 to inactivate RhoA upon ephrinA1 stimulation. GTP-bound RhoA was not decreased in the cells depleted of p190RhoGAP-A when stimulated with ephrinA1, whereas GTP-bound RhoA in the control cells was decreased (Fig. 5, A and B). We further studied the effect of depletion of p190RhoGAP-A on ephrinA1/EphA2 signal-induced cell compaction. There was no difference of cell shape and polarity between the control cells and those depleted of p190RhoGAP-A before the stimulation with ephrinA1. The cells treated with control siRNA exhibited columnar appearance with E-cadherin accumulation at the cell-cell contacts, whereas those depleted of p190RhoGAP-A failed to change the cell shape in response to ephrinA1 stimulation (Fig. 5, C and D).
FIGURE 5.
EphrinA1/EphA2 signal induces cell compaction in a manner dependent on p190RhoGAP-A. A, pulldown analyses of GTP-bound RhoA using the lysates from the cells depleted of p190RhoGAP-A (p190A) after the stimulation with ephrinA-Fc for 30 min. B, the result of A was quantitatively analyzed by calculating the intensity of the band of GTP-bound RhoA divided by that of total RhoA. C, the confocal images of the MDCK cells transfected with the siRNAs indicated at the top after the stimulation with either control Fc or ephrinA1-Fc for 4 h were obtained as described in the legend of Fig. 2B. D, area was calculated as described in the legend of Fig. 1D.
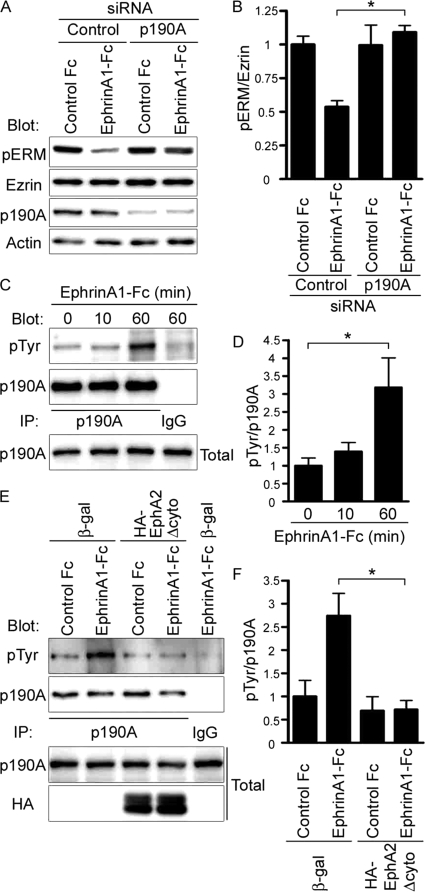
EphrinA1-induced dephosphorylation of Ezrin was blocked in the cells depleted of p190RhoGAP-A, although phosphorylation of Ezrin was not increased (Fig. 6, A and B). Because the GAP activity of p190RhoGAP-A is increased by its tyrosine phosphorylation (29), we examined whether ephrinA1 induces the phosphorylation of p190RhoGAP-A and found that it became phosphorylated in a time-dependent manner (Fig. 6, C and D). Moreover, by overexpressing EphA2Δcyto in MDCK cells to sequester ephrinA1, we confirmed whether phosphorylation of p190RhoGAP-A was induced by ephrinA1/EphA2 signal. Sequestering ephrinA1 resulted in the inhibition of phosphorylation of p190RhoGAP-A (Fig. 6, E and F).
FIGURE 6.
EphrinA1/EphA2 induces phosphorylation of p190RhoGAP-A. A, immunoblot analyses with the antibodies indicated at the left using the cell lysates prepared from the cells treated with the siRNAs before and after the stimulation with ephrinA1-Fc for 4 h. B, dephosphorylation of Ezrin was quantitatively analyzed by calculating the intensity of the phosphorylated Ezrin divided by that of total Ezrin using the lysates from the cells treated with siRNAs after the stimulation with ephrinA1-Fc or control as indicated at the bottom. C, immunoblot analyses with the antibodies indicated at the left using anti-p190RhoGAP-A immunoprecipitates (IP) of the MDCK cells treated with ephrinA1-Fc for the time indicated at the top. D, phosphorylation of p190RhoGAP-A quantitatively analyzed (intensity of phosopho-p190RhoGAP-A divided by that of total p190RhoGAP-A) using at least three independent immunoblots. E, the immunoblot analyses with the antibodies indicated at the left of the anti-p190RhoGAP-A immunoprecipitates (IP) of the cells infected with the adenovirus as described in the legend of Fig. 2D and treated by either control Fc or ephrinA1-Fc for 60 min. F, quantitative analyses of E as described in D.
To further confirm whether p190RhoGAP-A is essential for ephrinA1-induced columnar cell change, we examined the effect of depletion of p190RhoGAP-A and that of forced expression of p190RhoGAP-A resistant to siRNA on the ephrinA1-induced cell shape change to perform a rescue experiment. The effect of depletion of p190RhoGAP-A was reversed by the mutant p190RhoGAP-A resistant to siRNA (Fig. 5C and supplemental Fig. S3). These data indicate that the basal RhoA activity is not regulated by p190RhoGAP-A and that ephrinA1/EphA2 signal-induced compaction is partly ascribed to the RhoA inactivation mediated by p190RhoGAP-A.
EphrinA1/EphA2 Signal Induces Dephosphorylates of Ezrin Independently of Arf6
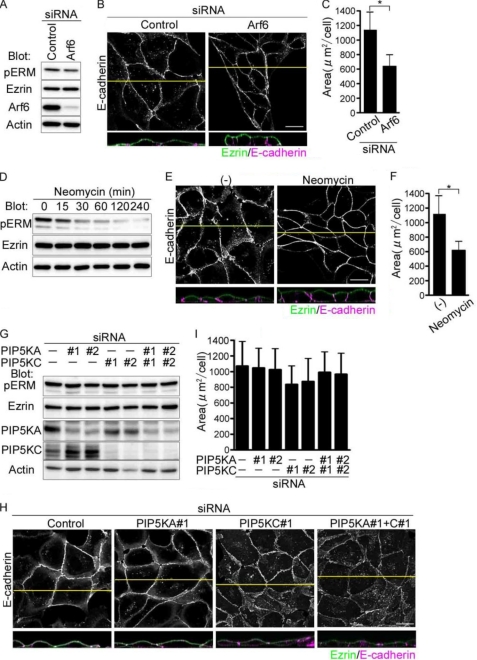
We have previously shown that inactivation of Arf6 through the EphA2-Nck-Git1 pathway induces compaction and enhanced polarization of MDCK cells. Therefore, we determined whether Arf6 is involved in dephosphorylation of Ezrin downstream of ephrinA1/EphA2 signal. Depletion of Arf6 did not affect the dephosphorylation of Ezrin (Fig. 7A), although Arf6 depletion resulted in compaction of MDCK cells (Fig. 7, B and C). Therefore, we assumed the other possibility that Arf6 is involved in the activation of Ezrin, because Arf6 is implicated in the regulation of production of phosphatidylinositol via phosphatidylinositol 4-phosphate 5-kinase (PIP5K) (30). Ezrin is activated by binding to PIP2 and being phosphorylated on Thr-567 (7, 8). Thus, we tested the effect of blocking of PIP2 by treating the cells with neomycin that binds to PIP2 and masks the binding site for PIP2-binding molecules (31). Treatment of MDCK cells with neomycin reduces the phosphorylation of Ezrin and induced the compaction (Fig. 7, D–F), suggesting the involvement of PIP5K downstream of Arf6. We thus examined the effect of depletion of PIP5K on cell compaction. Unexpectedly, the MDCK cells treated with siRNAs for PIP5K-A and -C expressed in MDCK cells did not show any morphological changes (Fig. 7, G–I), excluding the possibility that PIP5K is involved in the regulation of Ezrin. These results, together with our previous data, suggest that ephrinA1/EphA2 signal induces compaction of MDCK cells by two independent mechanisms: one dependent on dephosphorylation of Ezrin and the other dependent on inactivation of Arf6 (Fig. 8).
FIGURE 7.
EphrinA1/EphA2 signal induces cell compaction via inactivation of Ezrin independently of Arf6-mediated signaling. A, immunoblot analyses with the antibodies indicated at the left using the cell lysates of the MDCK cells treated with siRNAs indicated at the top. B, the confocal images of the cells transfected with siRNAs indicated at the top are shown as described in the legend of Fig. 2B. C, area was analyzed as described in the legend of Fig. 1D. D, immunoblot analyses with the antibodies indicated at the left using the cell lysates from the MDCK cells treated with neomycin during the time indicated at the top. E, confocal images of the MDCK cells treated with neomycin for 4 h were obtained as described in the legend of Fig. 2B. F, area of the cells treated with neomycin was calculated as described in the legend of Fig. 1D. G, immunoblot analyses with the antibodies indicated at the left using the lysates from the MDCK cells treated with the siRNAs for PIP5K-A (PIP5KA) and/or PIP5K-C (PIPK5C). H, the confocal images of the cells treated with siRNAs indicated at the top were shown as described in the legend of Fig. 2B. I, area of the cells of H was quantitatively analyzed as described in the legend of Fig. 1D.
FIGURE 8.
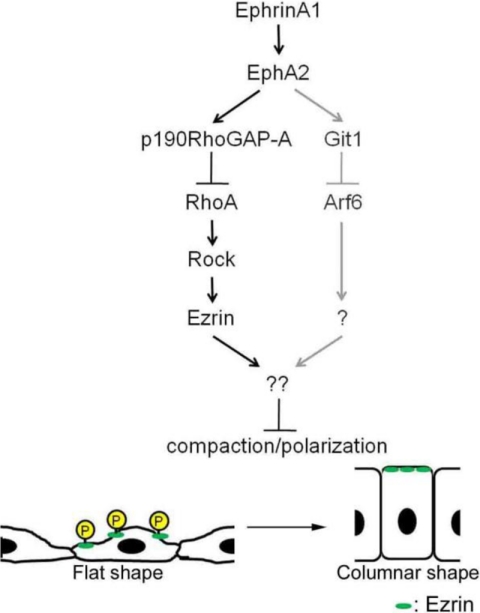
A schematic illustration of ephrinA1/EphA2 signal-induced compaction of MDCK cells. The signaling delineated in this study is indicated by the black arrows and black characters, whereas the previously identified signal is indicated by gray arrows and gray characters. EphrinA1/EphA2 signal induces activation of p190RhoGAP-A and subsequent inactivation of RhoA-Rho kinase that phosphorylates Ezrin. Phosphorylated Ezrin is required for maintaining the flat shape of MDCK cells. Therefore, ephrinA/EphA signal induces compaction with polarity in MDCK cells by inactivating Ezrin, although the localization of Ezrin to the apical domain is unchanged before and after ephrinA1 stimulation or upon cell-cell contact.
DISCUSSION
We demonstrated that the active Ezrin (phosphorylated Ezrin on Thr-567) was essential for forming the flat shape of MDCK cells with cell-cell contacts. The importance of Ezrin in shaping the cells was evidenced by the fact that depletion of Ezrin or dephosphorylation of Ezrin resulted in the columnar cell shape change of MDCK cells. Ezrin has been reported to be involved in the determination of cell shape and polarity (7, 8). Although the active Ezrin is known to change the cell shape of MDCK cells (21, 32), the upstream signal activating Ezrin in the presence of cell-cell contacts has remained unclear. In this study, we focused on the signaling that causes dephosphorylation of Thr-567 in the MDCK cells stimulated with ephrinA1, because we previously found that ephrinA1 induces compaction of MDCK cells.
The active Ezrin inhibited the compaction, whereas depletion of Ezrin in the cells resulted in the compaction with polarity. When the active Ezrin is overexpressed in the mouse egg, the compaction that is usually found at the 8- or 16-cell stage is inhibited (33). In addition, the active Ezrin induces the formation of abnormal membrane protrusions (33). These morphological changes are also observed in MDCK cells expressing Ezrin T567D (32). Ezrin knock-out mice show the loss of villous morphogenesis (34), suggesting that active Ezrin might have the membrane extension activity. Consistently, we found that MDCK cells expressing active Ezrin exhibited a flat shape by horizontally extending the membrane even though cell-cell contacts were preserved.
For Ezrin, cycling between inactivation and activation might be important for shaping the cells to form the organs and tissues. In Ezrin knock-out mice, disorganized intestinal epithelial cells without polarization are found (34), suggesting the important role for Ezrin in the formation of a multicellular epithelium. Activation or inactivation of Ezrin parallels phosphorylation or dephosphorylation of Thr-567. Extracellular stimuli, including epidermal growth factor, platelet-derived growth factor, and hepatocyte growth factor, can induce the phosphorylation of Thr-567 through Ser/Thr kinases including protein kinase Cα, Rho kinase, and NF-κB-inducing kinase (14, 25). Activation of Fas, T-cell receptor and B-cell receptor leads to dephosphorylates ERM protein (35–38). We here reported that ephrinA1/EphA2 induced dephosphorylation of Thr-567 via inactivation of RhoA-Rho kinase through p190RhoGAP-A. These data indicate that the formation of cell-cell contact negatively regulates Ezrin and vice versa, because Ezrin decreases the height of lateral domain at the cell-cell contacts. Therefore, activation and inactivation of Ezrin appear to be essential for organogenesis that requires the cell-cell contacts.
Besides the activation of Ezrin indicated by phosphorylation of Thr-567, PIP2 was required for activated Ezrin-dependent morphological change (Fig. 7). It is controversial whether ephrinA/EphA signal activates phosphatidylinositol 3-kinase. EphrinA1 stimulation results in the recruitment of Src homology 2-containing inositol-5′-phosphatase and subsequently inhibiting the conversion from PIP2 to phosphatidylinositol 3,4,5-triphosphate (39), suggesting the possibility of an increase in PIP2. In contrast, there is a contrasting report that EphA2 activation leads to the activation of phosphatidylinositol 3-kinase in endothelial cells (40, 41), suggesting the possibility of a decrease in PIP2. PIP5 kinase is an effector of Arf6 (30). We previously demonstrated that ephrinA1/EphA2 signal induces compaction of MDCK cells via inactivation of Arf6 and found that PIP2 was essential for maintaining the flat morphology of MDCK cells in this study (Fig. 7). We thus tried to explore whether ephrinA1/EphA2 signal affected the localization of Ezrin in a manner dependent on PIP2. Depletion of PIP5K did not result in any morphological changes, excluding the possibility that Arf6-PIP5K-mediated PIP2 regulation in ephrinA1/EphA2 signal induces compaction. In addition, Arf6 depletion did not affect dephosphorylation of Ezrin (Fig. 7A). These results indicate that ephrinA1/EphA2 signal mainly regulates the inactivation of Ezrin by inhibiting RhoA-Rho kinase signal in a manner independent on Arf6, although it is not clear whether EphA2 phosphorylates p190RhoGAP-A directly or indirectly via other tyrosine kinases.
The changes of cell shape are accompanied with the changes in the domains of plasma membrane, pointing to the polarity. Throughout the experiments, the localization of Ezrin was restricted to the apical domain even in flat or columnar states, suggesting that the activation or inactivation is not dependent on the localization of Ezrin but dependent on the degree of phosphorylation of Thr-567. At present, we have not yet clarified the downstream signaling that controls cell morphology by Ezrin at the apical domain, although we here demonstrated the regulation of phosphorylation by ephrinA1/EphA2 signaling initiated by cell-cell contacts. Ezrin at the border between apical domain and lateral domain is known to bind to actin filament and to Bitesize to control actin organization at the cell-cell junction (42). It is required to explore the molecular mechanism by which active Ezrin maintains the flat morphology. In conclusion, we delineated the signal that regulates ephrinA1/EphA2-induced compaction of MDCK cells (Fig. 8): the engagement ephrinA1 with EphA2 results in the phosphorylation of p190RhoGAP-A and subsequent inactivation of RhoA-Rho kinase signaling, thereby leading to the dephosphorylation of Thr-567 of Ezrin that is essential for maintaining the flat morphology of MDCK cells.
Supplementary Material
Acknowledgments
We are grateful to W. J. Nelson (Stanford University) for anti-gp135 antibody, Y. Kanaho (Tsukuba University) for anti-PIP5K antibodies, S. Tsukita (Osaka University) for Ezrin cDNA, A. Sakakibara for EphA2 cDNA, S. Ohno and A. Suzuki (Yokohama City University) for helpful comments. We also thank M. Sone, K. Hiratomi, and Y. Matsuura for technical assistance.
This work was supported in part by grants from the Ministry of Education, Science, Sports and Culture of Japan (to N. M.); the Ministry of Health, Labour, and Welfare of Japan (to N. M.); Takeda Science Foundation (to N. M.); the Mitsubishi Foundation (to N. M.); and an AstraZeneca Research Grant (to N. M.).

The on-line version of this article (available at http://www.jbc.org) contains supplemental Figs. S1–S3.
- ERM
- Ezrin/Radixin/Moesin
- Arf6
- ADP-ribosylation factor 6
- E-cadherin
- epithelial cell-cadherin
- GAP
- GTPase-activating protein
- MDCK
- Madin-Darby canine kidney
- PIP2
- phosphatidylinositol 4,5-bisphosphate
- PIP5K
- phosphatidylinositol 4-phosphate 5-kinase.
REFERENCES
- 1. Takeichi M. (1991) Science 251, 1451–1455 [DOI] [PubMed] [Google Scholar]
- 2. Gumbiner B. M. (2005) Nat. Rev. Mol. Cell Biol. 6, 622–634 [DOI] [PubMed] [Google Scholar]
- 3. Kalluri R., Weinberg R. A. (2009) J. Clin. Invest. 119, 1420–1428 [DOI] [PMC free article] [PubMed] [Google Scholar]
- 4. Thiery J. P., Acloque H., Huang R. Y., Nieto M. A. (2009) Cell 139, 871–890 [DOI] [PubMed] [Google Scholar]
- 5. St Johnston D., Ahringer J. (2010) Cell 141, 757–774 [DOI] [PubMed] [Google Scholar]
- 6. Adams C. L., Chen Y. T., Smith S. J., Nelson W. J. (1998) J. Cell Biol. 142, 1105–1119 [DOI] [PMC free article] [PubMed] [Google Scholar]
- 7. Bretscher A., Edwards K., Fehon R. G. (2002) Nat. Rev. Mol. Cell Biol. 3, 586–599 [DOI] [PubMed] [Google Scholar]
- 8. Fehon R. G., McClatchey A. I., Bretscher A. (2010) Nat. Rev. Mol. Cell Biol. 11, 276–287 [DOI] [PMC free article] [PubMed] [Google Scholar]
- 9. Tsukita S., Oishi K., Sato N., Sagara J., Kawai A., Tsukita S. (1994) J. Cell Biol. 126, 391–401 [DOI] [PMC free article] [PubMed] [Google Scholar]
- 10. Orlando R. A., Takeda T., Zak B., Schmieder S., Benoit V. M., McQuistan T., Furthmayr H., Farquhar M. G. (2001) J. Am Soc. Nephrol. 12, 1589–1598 [DOI] [PubMed] [Google Scholar]
- 11. Martín-Villar E., Scholl F. G., Gamallo C., Yurrita M. M., Muñoz-Guerra M., Cruces J., Quintanilla M. (2005) Int. J. Cancer 113, 899–910 [DOI] [PubMed] [Google Scholar]
- 12. Niggli V., Andréoli C., Roy C., Mangeat P. (1995) FEBS Lett. 376, 172–176 [DOI] [PubMed] [Google Scholar]
- 13. Matsui T., Maeda M., Doi Y., Yonemura S., Amano M., Kaibuchi K., Tsukita S., Tsukita S. (1998) J. Cell Biol. 140, 647–657 [DOI] [PMC free article] [PubMed] [Google Scholar]
- 14. Baumgartner M., Sillman A. L., Blackwood E. M., Srivastava J., Madson N., Schilling J. W., Wright J. H., Barber D. L. (2006) Proc. Natl. Acad. Sci. U.S.A. 103, 13391–13396 [DOI] [PMC free article] [PubMed] [Google Scholar]
- 15. Ng T., Parsons M., Hughes W. E., Monypenny J., Zicha D., Gautreau A., Arpin M., Gschmeissner S., Verveer P. J., Bastiaens P. I., Parker P. J. (2001) EMBO J. 20, 2723–2741 [DOI] [PMC free article] [PubMed] [Google Scholar]
- 16. Koss M., Pfeiffer G. R., 2nd, Wang Y., Thomas S. T., Yerukhimovich M., Gaarde W. A., Doerschuk C. M., Wang Q. (2006) J. Immunol. 176, 1218–1227 [DOI] [PubMed] [Google Scholar]
- 17. Pasquale E. B. (2010) Nat. Rev. Cancer 10, 165–180 [DOI] [PMC free article] [PubMed] [Google Scholar]
- 18. Surawska H., Ma P. C., Salgia R. (2004) Cytokine Growth Factor Rev. 15, 419–433 [DOI] [PubMed] [Google Scholar]
- 19. Stein E., Schoecklmann H., Daniel T. O. (1997) Trends Cardiovasc. Med. 7, 329–334 [DOI] [PubMed] [Google Scholar]
- 20. Miura K., Nam J. M., Kojima C., Mochizuki N., Sabe H. (2009) Mol. Biol. Cell 20, 1949–1959 [DOI] [PMC free article] [PubMed] [Google Scholar]
- 21. Martín-Villar E., Megías D., Castel S., Yurrita M. M., Vilaró S., Quintanilla M. (2006) J. Cell Sci. 119, 4541–4553 [DOI] [PubMed] [Google Scholar]
- 22. Martin-Belmonte F., Mostov K. (2008) Curr. Opin. Cell Biol. 20, 227–234 [DOI] [PubMed] [Google Scholar]
- 23. Ren X. D., Kiosses W. B., Schwartz M. A. (1999) EMBO J. 18, 578–585 [DOI] [PMC free article] [PubMed] [Google Scholar]
- 24. Yonemura S., Matsui T., Tsukita S., Tsukita Sa. (2002) J. Cell Sci. 115, 2569–2580 [DOI] [PubMed] [Google Scholar]
- 25. Crepaldi T., Gautreau A., Comoglio P. M., Louvard D., Arpin M. (1997) J. Cell Biol. 138, 423–434 [DOI] [PMC free article] [PubMed] [Google Scholar]
- 26. Zantek N. D., Azimi M., Fedor-Chaiken M., Wang B., Brackenbury R., Kinch M. S. (1999) Cell Growth Differ. 10, 629–638 [PubMed] [Google Scholar]
- 27. Noren N. K., Niessen C. M., Gumbiner B. M., Burridge K. (2001) J. Biol. Chem. 276, 33305–33308 [DOI] [PubMed] [Google Scholar]
- 28. Noren N. K., Arthur W. T., Burridge K. (2003) J. Biol. Chem. 278, 13615–13618 [DOI] [PubMed] [Google Scholar]
- 29. Arthur W. T., Petch L. A., Burridge K. (2000) Curr. Biol. 10, 719–722 [DOI] [PubMed] [Google Scholar]
- 30. Honda A., Nogami M., Yokozeki T., Yamazaki M., Nakamura H., Watanabe H., Kawamoto K., Nakayama K., Morris A. J., Frohman M. A., Kanaho Y. (1999) Cell 99, 521–532 [DOI] [PubMed] [Google Scholar]
- 31. Gabev E., Kasianowicz J., Abbott T., McLaughlin S. (1989) Biochim. Biophys. Acta 979, 105–112 [DOI] [PubMed] [Google Scholar]
- 32. Pujuguet P., Del Maestro L., Gautreau A., Louvard D., Arpin M. (2003) Mol. Biol. Cell 14, 2181–2191 [DOI] [PMC free article] [PubMed] [Google Scholar]
- 33. Dard N., Louvet-Vallée S., Santa-Maria A., Maro B. (2004) Dev. Biol. 271, 87–97 [DOI] [PubMed] [Google Scholar]
- 34. Saotome I., Curto M., McClatchey A. I. (2004) Dev. Cell 6, 855–864 [DOI] [PubMed] [Google Scholar]
- 35. Kondo T., Takeuchi K., Doi Y., Yonemura S., Nagata S., Tsukita S. (1997) J. Cell Biol. 139, 749–758 [DOI] [PMC free article] [PubMed] [Google Scholar]
- 36. Brown M. J., Nijhara R., Hallam J. A., Gignac M., Yamada K. M., Erlandsen S. L., Delon J., Kruhlak M., Shaw S. (2003) Blood 102, 3890–3899 [DOI] [PubMed] [Google Scholar]
- 37. Delon J., Kaibuchi K., Germain R. N. (2001) Immunity 15, 691–701 [DOI] [PubMed] [Google Scholar]
- 38. Gupta N., Wollscheid B., Watts J. D., Scheer B., Aebersold R., DeFranco A. L. (2006) Nat. Immunol. 7, 625–633 [DOI] [PubMed] [Google Scholar]
- 39. Zhuang G., Hunter S., Hwang Y., Chen J. (2007) J. Biol. Chem. 282, 2683–2694 [DOI] [PubMed] [Google Scholar]
- 40. Pandey A., Lazar D. F., Saltiel A. R., Dixit V. M. (1994) J. Biol. Chem. 269, 30154–30157 [PubMed] [Google Scholar]
- 41. Brantley-Sieders D. M., Caughron J., Hicks D., Pozzi A., Ruiz J. C., Chen J. (2004) J. Cell Sci. 117, 2037–2049 [DOI] [PubMed] [Google Scholar]
- 42. Pilot F., Philippe J. M., Lemmers C., Lecuit T. (2006) Nature 442, 580–584 [DOI] [PubMed] [Google Scholar]
Associated Data
This section collects any data citations, data availability statements, or supplementary materials included in this article.


