Abstract
RB1-inducible coiled-coil 1 (RB1CC1) functions in various processes, such as cell growth, differentiation, senescence, apoptosis, and autophagy. The conditional transgenic mice with cartilage-specific RB1CC1 excess that were used in the present study were made for the first time by the Cre-loxP system. Cartilage-specific RB1CC1 excess caused dwarfism in mice without causing obvious abnormalities in endochondral ossification and subsequent skeletal development from embryo to adult. In vitro and in vivo analysis revealed that the dwarf phenotype in cartilaginous RB1CC1 excess was induced by reductions in the total amount of cartilage and the number of cartilaginous cells, following suppressions of type II collagen synthesis and Erk1/2 signals. In addition, we have demonstrated that two kinds of SNPs (T-547C and C-468T) in the human RB1CC1 promoter have significant influence on the self-transcriptional level. Accordingly, human genotypic variants of RB1CC1 that either stimulate or inhibit RB1CC1 transcription in vivo may cause body size variations.
Keywords: Collagen, Connective Tissue, Development, ERK, Gene Regulation, RB1-inducible Coiled-coil 1 (RB1CC1), SNPs, Cartilage, Dwarfism, Type II Collagen
Introduction
Human diseases associated with COL2A1 (collagen type II α1) mutations, such as spondyloepiphyseal dysplasia congenita, achondrogenesis, Czech dysplasia, and hypochondrogenesis, are known. The abnormal pro-α1(II) chains produced in these diseases cannot be converted into normal type II collagen, the framework to anchor the chondroid matrix, resulting in dwarfism (1–3). SOX9 regulates type II collagen expression (4), and the mutation causes human campomelic dysplasia (5, 6). c-Krox is also known to regulate type II collagen (7), but it is unclear whether the aberrations cause body size abnormalities. Further studies are warranted to investigate mechanisms regulating type II collagen expression and inducing body size abnormalities, such as dwarfism.
RB1-inducible coiled-coil 1 (RB1CC1; the symbol referred to here and approved by the Human Genome Organization (HUGO) Gene Nomenclature Committee; also known as FIP200, focal adhesion kinase family-interacting protein of 200 kDa) was identified as a novel molecule that dephosphorylated RB1 (8, 9), and increased RB1 expression (8, 10, 11). RB1CC1 forms a complex with hSNF5 (11), p53 (9, 11), PIASy (a protein inhibitor of activated STAT protein y) (12), and/or the other transcriptional regulators in cell nuclei and enhances the promoter activities of RB1, p16, and p21 (9–13). A nuclear expression of RB1CC1 is important for tumor suppression through globally transcriptional activation of the RB1 pathway (11), and genetic rearrangement of RB1CC1 is involved in breast cancer tumorigenesis (14, 15). RB1CC1 is located not only in the nucleus but also in the cytoplasm (9, 10, 16, 17), where it plays an essential role in autophagic progression (16–23), cellular enlargement (24–26), and apoptosis (27, 28). In addition, qualitative or quantitative alterations of RB1CC1 are correlated with various diseases, such as cancer (11, 14, 15, 29–31), neuronal degeneration (32, 33), inflammatory skin disorder (28), and severe anemia (34).
RB1CC1 is presumably involved in the musculoskeletal development (35). During the endochondral ossification, RB1CC1 expression was low in proliferating chondrocytes and increased concomitantly with the increase of size and calcification (35). However, the effects of molecular anomalies of RB1CC1 on the musculoskeletal system have not yet been reported. To identify the effect of RB1CC1 disorder in vivo on the musculoskeletal development, we analyzed Col2-RB1CC1 transgenic mice, which carry highly expressed RB1CC1 in cartilaginous tissues. The present study demonstrated that Col2-RB1CC1 transgenic mice had a dwarf phenotype characterized by reduced production of type II collagen.
EXPERIMENTAL PROCEDURES
Construction of Transgene
The CAG-floxed-Neo-vector, pCALNL5 (36), was purchased from RIKEN BRC (Tsukuba Science City, Japan). To create an RB1CC1 transgene, we prepared a 4.9-kb DNA fragment covering the entire coding region of human RB1CC1 cDNA tagged with a FLAG sequence at the NH2 terminus. The FLAG-tagged RB1CC1 cDNA was cloned into the EcoRI-SmaI sites of pCALNL5 vectors to create CAG-floxed-Neo-RB1CC1.
Generation of Transgenic Mice and PCR Genotyping
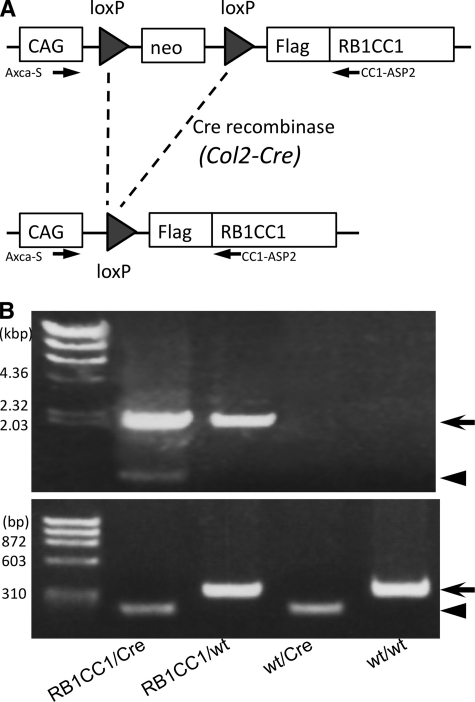
The plasmid CAG-floxed-Neo-RB1CC1 was digested with SfiI and then microinjected into the pronuclei of fertilized eggs from C57BL/6J. Transgenic newborn infants were identified by PCR assays of genomic DNA extracted from the tail. Genomic DNA was amplified by transgene-specific PCR using primers: Axca-S (5′-TGT GCT GTC TCA TCA TCA TTT TGG-3′), derived from the CAG promoter, and CC1-ASP2 (5′-TTG GCC ATT ACT GAA ACT GCA-3′), derived from human RB1CC1 cDNA to amplify an ∼2.2 kb product for CAG-floxed-Neo-RB1CC1 transgenic mice (Fig. 1). Four of 96 newborns were genetically positive for the transgene. CAG-floxed-Neo-RB1CC1 transgenic and normal embryos appeared similar. All of the transgenic newborn mice matured sexually, and four independent transgenic mouse lines could be established.
FIGURE 1.
Generation of Col2-RB1CC1 transgenic mice. A, the Neo gene was flanked by two loxP sequences in CAG-floxed-Neo-RB1CC1 transgenic mice. The transgenic mice were crossed with Col2-Cre transgenic mice, expressing Cre recombinase under the promoter for collagen2 α1 (Col2a1), and Cre-mediated deletion of the Neo gene led to production of FLAG-tagged human RB1CC1 under the CAG promoter in the chondrocytes of Col2-RB1CC1 (RB1CC1/Cre) mice. B, genomic DNA was extracted from mouse tail and analyzed by PCR, as indicated, to distinguish different types of alleles resulting from Cre-mediated recombination. The top arrow indicates 2.2-kb amplified products of the RB1CC1 transgenic allele. The Neo-deleted RB1CC1 allele (arrowhead; 0.8 kbp) is also amplified from the RB1CC1/Cre mouse tail, which contains the chondrocytes. The bottom arrowhead (199 bp) and arrow (324 bp) indicate the amplified products of Col2-Cre transgene and Il2 gene on wild-type mouse chromosome 3 (GenBankTM accession number NT_162143.3; nucleotides 21,361,049–21,361,372).
RB1CC1/Cre double-transgenic pups were generated by mating 2 transgenic mouse lines (lines 44 and 84) of CAG-floxed-Neo-RB1CC1 (RB1CC1/wt) with Col2-Cre (wt/Cre) transgenic mice obtained from the Jackson Laboratory (Bar Harbor, ME). Each transgenic mouse line was monoallelically maintained (i.e. continuously backcrossed onto the C57BL/6J genetic background). In RB1CC1/Cre double transgenic mice, two loxP sequences flanking the Neo gene within the CAG-floxed-Neo-RB1CC1 transgene were crossed with the Col2-Cre transgene, which expresses Cre recombinase under the promoter of Col2a1. Cre-mediated deletion of Neo gene leads to production of FLAG-tagged human RB1CC1 under the direct control of the CAG promoter in the differentiated chondrocytes (RB1CC1/Cre; Fig. 1A). RB1CC1/Cre double-transgenic pups were recognized as Col2-RB1CC1 transgenic mice, which highly expressed RB1CC1 in cartilaginous tissues. Mice were housed and handled according to local and national regulations. All experimental procedures were carried out according to the guidelines of the Institutional Animal Care and Use Committee and approved by the Research Center for Animal Life Science at Shiga University of Medical Science (Approval ID: 2006-7-1H). In addition to the primer pairs for detecting CAG-floxed-Neo-RB1CC1 transgenic mice, the following primers were used for PCR genotyping of the mice obtained by cross-mating: Col2-S, 5′-ACC AGC CAG CTA TCA ACT CG-3′; Col2-AS, 5′-TTA CAT TGG TCC AGC CAC C-3′; WT-S, 5′-CTA GGC CAC AGA ATT GAA AGA TCT-3′; and WT-AS, 5′-GTA GGT GGA AAT TCT AGC ATC ATC C-3′. The combination of primers Col2-S, Col2-AS, WT-S, and WT-AS amplified 199- and 324-bp fragments from Col2-Cre transgene and Il2 on wild-type mouse chromosome 3, respectively (Fig. 1B). The PCR conditions were as follows: 1 cycles at 95 °C for 3 min, followed by 35 cycles at 95 °C for 20 s, 58 °C for 20 s, and 68 °C for 30 s, and 1 cycle at 68 °C for 10 min. RB1CC1/Cre mice were born at the expected Mendelian ratio. The phenotypes of both transgenic mouse lines (lines 44 and 84) were similar.
Analysis of Body Size Phenotype
Body weights of the Col2-RB1CC1 (RB1CC1/Cre) and the other genotype (RB1CC1/wt, wt/Cre, and wt/wt) mice were measured weekly in 4–50-week-old mice. In addition, the cranio-sacral and tibial lengths of these four genotypic mice were measured by radiograms of soft x-rays (type SRO-M50, SOFRON, Tokyo, Japan) under general anesthesia with 40 mg/kg sodium pentobarbital. X-ray examinations were performed until 70 weeks of age.
Skeletal Sample Preparation
Embryos from day 16.5–18.5 and newborn mice were eviscerated and fixed in 100% ethanol for 4 days and then transferred to acetone. After 3 days, they were rinsed with water and stained for 10 days in staining solution consisting of 1 volume of 0.1% Alizarin red S (Sigma) in 95% ethanol, 1 volume of 0.3% Alcian blue 8GX (Sigma) in 70% ethanol, 1 volume of 100% acetic acid, and 17 volumes of ethanol. After rinsing with 96% ethanol, specimens were kept in 20% glycerol, 1% KOH at 37 °C for 16 h and then at room temperature until the skeletons became clearly visible. Finally, the specimens were stored in 100% glycerol after gradual dehydration in 50 and 80% glycerol.
Histological Evaluation
The balance between cartilaginous cell number and extracellular chondroid matrices was analyzed in cartilaginous tissue of Col2-RB1CC1 mice. The cells were counted in areas of 100 μm2 of cartilaginous tissues in cranium, ribs, and spine of day 18.5 embryos from each genotype (RB1CC1/Cre, RB1CC1/wt, wt/Cre, and wt/wt). The status of endochondral ossification was microscopically evaluated in the growth plates of day 18.5 embryonic spines and 4–6-week-old newborn infantile tibias. The columnar proliferating and hypertrophic chondrocytes were counted in the sections stained by Alcian blue and nuclear Fast Red, and all of the numbers were statistically analyzed.
In Vitro RB1CC1 Modification in Chondrogenic Cells
A chondrogenic cell line, ATDC5, was purchased from the RIKEN BRC and maintained in the growth medium, DMEM/Ham's F-12 (1:1) hybrid medium (Invitrogen) supplemented with 5% fetal bovine serum (FBS) (Invitrogen), 10 mg/ml human transferrin (Roche Applied Science), and 3 × 10⁻⁸ m sodium selenite (Sigma), as described previously (37). ATDC5 cells were plated in 6-well plates at a density of 5 × 10⁵ cells/well and cultured until 80–100% confluence. Then the medium was replaced by serum-free OPTI-MEM and plasmid, either pcDNA-FLAG-RB1CC1 (0, 0.5, 1, or 2 μg/well) or the complementary empty vector (pcDNA-FLAG), which were transfected into the cells using Fugene HDTM (Roche Applied Science). To deplete the RB1CC1 expression, siRNA (40 pmol/well) for RB1CC1 (ID 22036, Ambion) or GL3 siRNA (negative control) was transfected by LipofectamineTM RNAi MAX (Invitrogen). Each vector for the transfection to induce the overexpression or knockdown of RB1CC1 was used according to the manufacturer's instructions. To trigger chondrogenesis, 24 h later, these transduced cells were fed by the differentiation medium DMEM/Ham's F-12 hybrid (1:1) medium supplemented with 0.5% FBS, 10 mg/ml human transferrin, 3 × 10⁻⁸ m sodium selenite, and additionally 10 mg/ml of human recombinant insulin (Wako Pure Chemical, Osaka, Japan). After an additional incubation of 0–96 h, the cells were lysed as described by Sarbassov et al. (38). The lysates were centrifuged at 15,000 × g for 1 min, and the supernatants were boiled in SDS sample buffer and examined by Western blotting. The incubated medium samples were used in sulfate GAG3 assays.
Sulfate GAG Assay
Quantitative analysis of the secreted GAG in the medium was done by the Blyscan kit (Biocolor, Northern Ireland, UK) according to the manufacturer's instructions. Briefly, recovered media were mixed with equal volumes of Blyscan Dye Reagent and shaken for 30 min to saturate the GAG-dye binding. The dye bound to GAGs was precipitated by centrifugation and dissolved in Dissociation Reagent. Then the recovered dye concentration was spectrophotometrically measured by the absorbance at 656 nm. A chondroitin 4-sulfate standard solution (Biocolor) was used to generate the standard curves, and all samples were tested in triplicate.
Western Blots
Proteins resolved by SDS-PAGE were transferred to polyvinylidene difluoride (PVDF) filters. After blocking of the filters with TBS-T (10 mm Tris-HCl (pH 7.6), 150 mm sodium chloride, 0.1% Tween 20) containing 5% bovine serum albumin (BSA), the filters were incubated overnight with the indicated primary antibodies in TBS-T containing 2% BSA at 4 °C. The filters were then washed in TBS-T and incubated for 1 h in horseradish peroxidase-conjugated anti-mouse or anti-rabbit IgG (GE Healthcare) diluted 1:20,000 in TBS-T containing 2% BSA. After several washes with TBS-T, the immunoreactivity was detected using the ECL system (GE Healthcare) according to the procedures recommended by the manufacturer.
Antibodies and Reagents
Anti-FLAG (M2) and anti-α tubulin (DM 1A) antibodies were obtained from Sigma. Antibodies for type II collagen (NCL-COLL-IIp), aggrecan (ab36861), cartilage oligomeric matrix protein (COMP; GTX14515), RB1 (G3-245), and p62/SQSTM1 (sequestsome1) were purchased from Novocasta, Abcam, GeneTex, BD Biosciences, and Wako, respectively. DYKDDDDK tag and the other antibodies were from Cell Signal Technology.
Immunohistochemistry
Embryos of day 18.5 from each genotype (RB1CC1/Cre, RB1CC1/wt, wt/Cre, and wt/wt) were sacrificed and embedded in paraffin after fixation in 10% buffered formalin overnight. Deparaffinized serial sections of 4-μm thickness each were processed for two-step immunoperoxidase staining using the following primary antibodies: DYKDDDDK tag, type II collagen, phospho-Erk1/2(202/204), phospho-NFκB(536), and p62/SQSTM1. A high temperature antigen unmasking pretreatment using autoclaving was used for the immunostaining of phospho-NFκB(536), and enzymatic predigestion with trypsin was performed for DYKDDDDK tag and type II collagen. Endogenous peroxidase activity was blocked using 0.3% hydrogen peroxidase in methanol. The sections were then incubated with each of the primary antibodies at 4 °C overnight, rinsed with 1× PBS, and incubated with the secondary antibody (Simple Stain MAX-PO; Nichirei, Japan) at room temperature for 1 h. They were stained with 3,3′-diaminobenzidine tetrahydrochloride and counterstained with hematoxylin.
Human RB1CC1 Promoter-Reporter Assay
Five kinds of SNPs (T-547C, C-468T, C-377T, T-296C, and G-226A; the transcription start site was defined as +1) have been identified in the human RB1CC1 promoter (available at the NCBI, National Institutes of Health, Web site), so we investigated the influence of these SNPs on the RB1CC1 expression in chondrocytes. Human RB1CC1 wild-type promoter region from −1037 to +58 was introduced into the luciferase reporter plasmids (pGL3, Promega, Madison, WI), as reported previously (39). The promoter in pGL3 luciferase plasmid was artificially modified, using the PrimeSTARTM Mutagenesis Basal kit (TaKaRa), according to the manufacturer's instructions, to make the promoter-plasmid with each SNP described above. ATDC5 cells were seeded at 1 × 10⁵ cells/well in a 6-well plate in growth medium. On the next day, after changing the medium to serum-free OPTI-MEM, human RB1CC1 wild type or each SNP promoter-luciferase reporter plasmid (0.5 μg DNA/well) was transfected into the cells using FuGENE HDTM. Twenty-four hours later, the transduced ATDC5 cells were exchanged into the differentiation medium for induction of chondrogenesis. After additional incubation of 24 h, the cells were lysed, and luciferase activity was analyzed using a Luciferase assay kit (Toyo Ink, Japan) and luminometer (EG&G Berthold Lumat LB 9507).
Statistical Analysis
Statistical analysis was performed in StatView 5.0 for Windows (StatView Inc.). All tests for statistical significance were two-sided. A p value of <0.05 was considered statistically significant. One-way factorial analysis of variance and multiple comparison tests accompanied by Scheffe's significance were used to evaluate the relationships between genotypes and body sizes. Similar statistical analyses were applied to histological comparison of cartilage cell numbers, to RB1CC1 promoter activities caused by each SNP, and to the GAG content-affected RB1CC1 expression.
RESULTS
Col2-RB1CC1 Causes Dwarfism in Mice
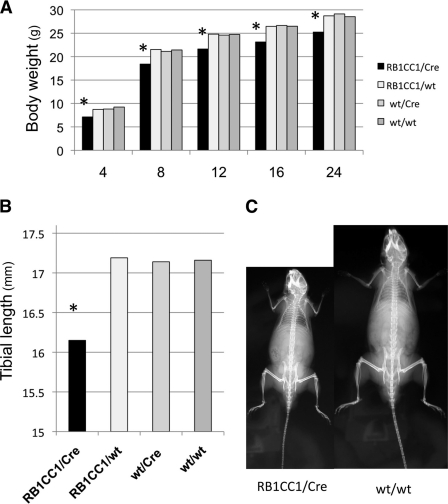
RB1CC1/Cre double-transgenic pups were recognized as Col2-RB1CC1 transgenic mice, which highly expressed RB1CC1 in cartilaginous tissues (Fig. 1). The analysis of body sizes showed that Col2-RB1CC1 mice overexpressing RB1CC1 in chondrocytes had statistically smaller body sizes than mice of the other types (RB1CC1/wt, wt/Cre, and wt/wt; Fig. 2A). The mature Col2-RB1CC1 mice also had significantly smaller bone lengths than those of the other types (Fig. 2B), although there was no disproportional body construction in any of the genotypes (Fig. 2C). Radiographic follow-up until the mice were 70 weeks old revealed that bone development, such as growth plate closure or onset of osteoarthritis, was fundamentally the same among all genotypes of mice (data not shown). The degree of dwarf phenotype was similar in two kinds of RB1CC1-transgenic mouse lines (lines 44 and 84; supplemental Fig. 1).
FIGURE 2.
Col2-RB1CC1 causes dwarfism in mice. A, Col2-RB1CC1 (RB1CC1/Cre) mice had significantly lower body weights than the other types (RB1CC1/wt, wt/Cre, and wt/wt) of mice (*, p = 1.16 × 10⁻¹¹, statistically significant). Numbers along the bottom indicate mouse ages (in weeks). B, Col2-RB1CC1 mice (24 weeks old) had significantly shorter tibial bone lengths than the other types (*, p = 6.98 × 10⁻¹³, statistically significant). The values indicate the mean values from each mouse (ratio of RB1CC1/Cre to RB1CC1/wt to wt/Cre to wt/wt = 26:16:15:17). One-way factorial analysis of variance and multiple comparison tests accompanied by Scheffe's significance were used to evaluate the relationships between genotypes and body sizes. C, representative radiograms of RB1CC1/Cre and wt/wt mice (14 weeks old). Note that the balance between body and limbs was similar in both genotypes. These data originated from line 84 CAG-floxed-Neo-RB1CC1 transgenic male mice.
Col2-RB1CC1 Causes the Dwarf Phenotype without Abnormal Endochondral Ossification
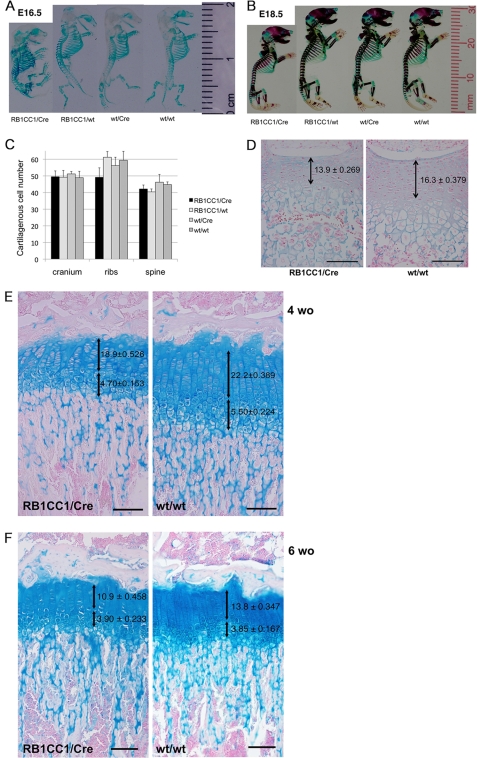
To analyze the status of endochondral ossification in Col2-RB1CC1 mice, we prepared skeletal samples from day 16.5–18.5 embryos of all genotypes. The chondroid volume was smaller in Col2-RB1CC1 mice than in the others, but there was no significantly macroscopic difference in the endochondral ossification among genotypes (Fig. 3, A and B). Microscopically, there were no significant differences between cartilaginous cell numbers in areas of 100 μm2 from each genotype (Fig. 3C), but lesser cell numbers and fewer chondroid matrices were significantly indicated in the spinal growth plates of day 18.5 Col2-RB1CC1 embryos (Fig. 3D). Chondrocyte numbers and chondroid matrices were significantly less in the columnar proliferating zones of tibial growth plates of 4–6-week-old Col2-RB1CC1 infants (Fig. 3, E and F). Numbers of hypertrophic chondrocytes were less in 4-week-old Col2-RB1CC1 tibias (Fig. 3E). However, no obvious abnormality was detected in the endochondral ossification among genotypes. These results indicated that a balanced decrease in cartilaginous cell numbers and extracellular chondroid matrices was the primary cause of dwarf skeletal construction of Col2-RB1CC1 mice.
FIGURE 3.
Col2-RB1CC1 caused the dwarf phenotype with a balanced reduction between cartilaginous cell numbers and extracellular chondroid matrices and without abnormal endochondral ossification. A and B, skeletal samples from day 16.5 (A) and day 18.5 (B) embryos indicated that the dwarf phenotype with less chondroid volume was seen in Col2-RB1CC1 (RB1CC1/Cre) mice. C, no significant difference was seen in the cell numbers of 100 μm2 of various cartilage tissues from each mouse (p = 0.062, cranium; p = 0.254, ribs; p = 0.186, spine). D, lesser cell numbers and fewer chondroid matrices were significantly indicated in the spinal growth plates of day 18.5 Col2-RB1CC1 (RB1CC1/Cre) embryos (p < 0.0001). E and F, lesser cell numbers and fewer chondroid matrices were significant in the columnar proliferating chondrocytes of tibial growth plates of 4-week-old (E; p < 0.0001) and 6-week-old (F; p < 0.0001) Col2-RB1CC1 (RB1CC1/Cre) infants. Numbers of hypertrophic chondrocytes were less in 4-week-old RB1CC1/Cre tibias (E; p = 0.0085). The values indicate the means ± S.E. of cartilaginous cell numbers of one column in the proliferating and hypertrophic zones from 5–6 mice of each genotype. One-way factorial analysis of variance and multiple comparison tests accompanied by Scheffe's significance were used to evaluate the relationships between genotypes and cartilaginous cell numbers. Macroscopically and microscopically, no abnormality was seen in the endochondral ossification of all of the mice (RB1CC1/Cre, RB1CC1/wt, wt/Cre, and wt/wt). Scale bar, 100 μm.
RB1CC1 Suppresses Synthesis of Type II Collagen in Chondrocytic Cells
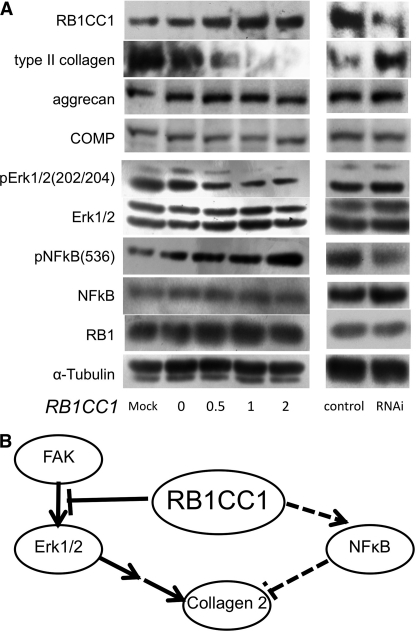
In ATDC5 chondrocytic cells, we simulated the molecular pathway of RB1CC1-mediated repression of extracellular matrix in the chondrocytes of Col2-RB1CC1 mice. RB1CC1 overexpression led to repression of type II collagen synthesis (Fig. 4A, left half). RB1CC1 also repressed phosphorylated Erk1/2 activities and enhanced those of phosphorylated NFκB. Irrespective of RB1CC1 overexpression, the phosphorylation status and expression level of RB1 were unchanged (Fig. 4A, left half). Reciprocally, RB1CC1 knockdown enhanced type II collagen expression (Fig. 4A, right half). The knockdown caused a slight repression of phosphorylated NFκB, whereas phosphorylated Erk1/2 activities were not significantly changed (Fig. 4A, right half). These results suggested that RB1CC1 caused suppression of type II collagen synthesis in the differentiated chondrocytes through multimodal signaling involving Erk suppression and NFκB activation (Fig. 4B).
FIGURE 4.
RB1CC1 repressed type II collagen expression in ATDC5 chondrocytes. A, ATDC5 cells were induced to chondrocytes for 96 h after the transduction of RB1CC1 cDNA (0–2 μg/well) or RNAi (40 pmol/well), and the lysates were analyzed by Western blotting with the indicated antibodies. RB1CC1 repressed type II collagen and phosphorylated Erk1/2 and enhanced phosphorylated NFκB (left half). RB1CC1 RNAi enhanced type II collagen and repressed a little phosphorylated NFκB (right half). B, RB1CC1 led to the suppression of type II collagen in the differentiated chondrocytes via multimodal signalings, such as Erk suppression and NFκB activation.
Excessive RB1CC1 did not inhibit synthesis of aggrecan, COMP (Fig. 4A and supplemental Fig. 2A), and sulfated glycosaminoglycan (supplemental Fig. 2B) during the chondrocytic differentiation in ATDC5. However, in order to construct chondroid matrix, aggrecan, COMP, and sulfated glycosaminoglycan must form a meshwork with type II collagen, so we concluded that type II collagen repression is the major cause of fewer chondroid matrices in RB1CC1 overexpression.
RB1CC1 Reduces Type II Collagen Synthesis in Vivo with Erk Signal Suppression
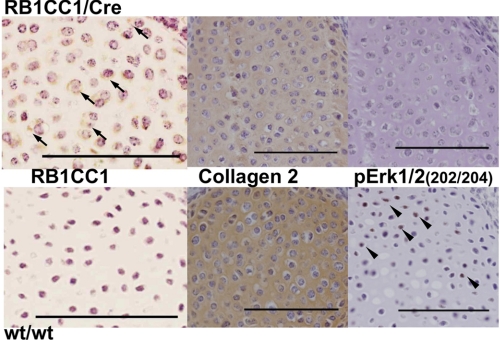
To identify whether RB1CC1 reduces type II collagen synthesis or Erk activity or enhances NFκB activity in day 18.5 embryonic cartilaginous tissue of Col2-RB1CC1 mice, we performed an immunohistochemical analysis of FLAG (exogenous RB1CC1), phospho-Erk1/2(202/204), and phospho-NFκB(536). RB1CC1 has been recognized as an essential component in the autophagic-lysosome pathway. In order to analyze the effect of RB1CC1 overexpression on the autophagic process in chondrocytes, we evaluated immunohistochemically the levels of p62/SQSTM1 (sequestsome 1), which are substrates of that pathway and accumulate in autophagy-deficient cells. In day 18.5 embryos of Col2-RB1CC1 mice, both type II collagen and phospho-Erk1/2 (202/204) levels were reduced (Fig. 5). The data suggested that RB1CC1 excess caused the repression of type II collagen synthesis and the deactivation of the Erk pathway. Neither phospho-NFκB(536) nor p62/SQSTM1 was detected in Col2-RB1CC1 and the other mice (supplemental Fig. 3), suggesting the absence of in vivo abnormalities in both NFκB and autophagic pathways of Col2-RB1CC1 mice.
FIGURE 5.
Type II collagen was reduced with Erk signal suppression in Col2-RB1CC1 (RB1CC1/Cre) mice. FLAG (exogenous RB1CC1; arrows) was seen only in the chondrocytic cytoplasm of day 18.5 RB1CC1/Cre embryos, and type II collagen in the chondroid matrix and phosphorylated Erk (202/204; arrowheads) in the chondrocytic nuclei were prominently reduced. Scale bar, 100 μm.
Human RB1CC1 Promoter SNP Can Modify Self-activation
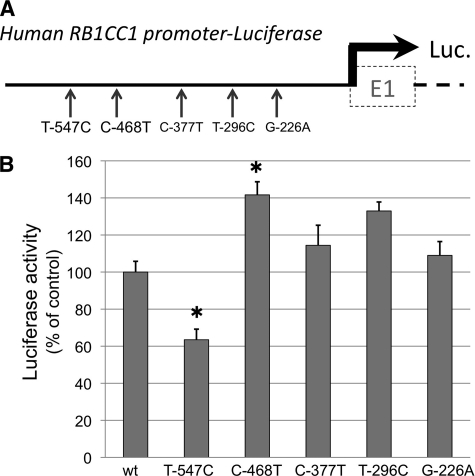
Five kinds of SNPs (T-547C, C-468T, C-377T, T-296C, and G-226A) in the human RB1CC1 promoter were evaluated for their effect on RB1CC1 expression in ATDC5 chondrocytes (Fig. 6A). A luciferase reporter assay for human RB1CC1 promoter activity demonstrated a significant decrease in T-547C SNP (mean ± S.E. = 63.5 ± 5.7%, p = 1.6 × 10⁻⁴) and an increase in C-468T SNP (141.6 ± 7.1%, p = 1.8 × 10⁻⁴), compared with the activity of common variants (Fig. 6B). The data suggested that the body size of individuals with such SNPs on the RB1CC1 promoter could possibly be influenced by modulation of RB1CC1 self-transcribing activity.
FIGURE 6.
Human RB1CC1 promoter SNP modified the self-activation. A, luciferase reporter vectors containing each kind of SNP (T-547C, C-468T, C-377T, T-296C, or G-226A) on the human RB1CC1 promoter were constructed and transduced into ATDC5 chondrocytes. B, luciferase reporter assays demonstrated that T-547C significantly decreased the activity (mean ± S.E. (error bars) = 63.5 ± 5.7%) and that C-468T increased it (141.6 ± 7.1%), compared with the activity of common variant (wt). The means ± S.E. were from more than quadruplicate experiments. One-way factorial analysis of variance and multiple comparison tests accompanied by Scheffe's significance were used to evaluate the relationships between each SNP and the promoter activity (*, p < 0.05, statistically significant).
DISCUSSION
In the present study, we have demonstrated that the cartilage-specific overexpression of RB1CC1 causes the dwarf phenotype in mice. RB1CC1 plays a role in a variety of processes, such as inhibition of cell proliferation (8, 9), cell growth (24–26), apoptosis (27, 28), and autophagy (16–22). However, the precise mechanism of musculoskeletal diseases caused by an RB1CC1-associated disorder is not clearly understood. In the Col2-RB1CC1 mouse, the dwarfism was not accompanied by any anomalies in body shape, and although the cartilaginous volume was smaller than that of the control, there was no abnormality in the endochondral ossification. In vitro cell signaling analyses revealed that RB1CC1 repressed both type II collagen production and Erk1/2 activity and enhanced NFκB signaling. These results suggested that RB1CC1 suppressed type II collagen synthesis in the chondrocytes through multimodal signalings, such as Erk suppression and NFκB activation. Positive activities of FAK-Erk1/2 are required to produce type II collagen in chondrocytes (40, 41), and exogenous or endogenous activation of NFκB represses type II collagen synthesis (42, 43). RB1CC1 plays a contradictory role in FAK-Erk1/2 signaling (44) and/or contributes to endogenous activation of NFκB (27, 28, 34). In vivo findings in chondrocytes were concordant with the signaling data in vitro with the exception of those related to NFκB. RB1CC1 excess in Col2-RB1CC1 mice was strongly associated with type II collagen reduction and Erk1/2 repression, reducing cartilaginous volume and cells, and finally leading to dwarfism. RB1CC1 introduction increased NFκB expression in chondrocytes in vitro but not in chondrocytes of Col2-RB1CC1 cartilaginous tissue. Chondrocytes in vivo are embedded in abundant avascular extracellular matrix and are comparatively resistant to various stimuli that might trigger NFκB activation. On the other hand, chondrocytes in vitro have insufficient extracellular matrix and imperfect interaction between extracellular matrix and intracellular signaling, so they are often susceptible to various intrinsic and/or extrinsic stimuli. It seems quite possible that these environmental differences were the major cause of the discordance in NFκB activation in the chondrocytes in these two experimental systems.
In this experiment, cartilage-specific RB1CC1 excess did not lead to any apparent in vivo aberrance with regard to NFκB activity or p62/SQSTM1 accumulation, although RB1CC1 excess was possibly associated with NFκB activation in vitro. RB1CC1 is also called FIP200, and some reports have discussed mouse disorders caused by RB1CC1/FIP200 knock-out (27, 28, 33, 34). The complete deletion of mouse RB1CC1/FIP200 resulted in embryonic lethality caused by heart failure and liver degeneration associated with insufficiency of NFκB activities (27). Ablation of RB1CC1/FIP200 in skin keratinocytes repressed endogenous NFκB activity and led to skin inflammatory disorders (28). Neuron-specific deletion of RB1CC1/FIP200 resulted in abnormal accumulation of ubiquitinated proteins and p62/SQSTM1, followed by neuronal cell death and neurodegeneration (33). However, cartilage-specific RB1CC1 excess could have no effect on either intrinsic NFκB or autophagy in vivo.
Interestingly, cartilage-specific RB1CC1 excess suppressed type II collagen synthesis in chondrocytes and led to the dwarf phenotype in the present study, which establishes that RB1CC1 is a negative regulator of type II collagen synthesis and is a possible cause of dwarfism in humans. Five kinds of SNP are present in the human RB1CC1 promoter, and two of them (T-547C and C-468T) are associated with significantly different RB1CC1 transcription activities compared with that of common variants. Although the five SNPs have not been reported to have any correlation to human diseases yet, these variations could possibly affect synthesis of type II collagen through changes in RB1CC1 expression and may lead to body size variations.
In conclusion, the conditional transgenic mice with cartilage-specific RB1CC1 excess in vivo have been reported for the first time in the present study. Cartilage-specific RB1CC1 excess caused type II collagen reduction, accompanied by suppression of the Erk1/2 pathway in cartilaginous cells, reduced the total amounts of cartilage and the numbers of cartilaginous cells, and finally led to the dwarf phenotype. Further analysis is needed to clarify how the other signaling pathways involving NFκB and autophagy contribute to type II collagen production and the subsequent variances of body size. The present study has also demonstrated the following novel findings. Variations in RB1CC1 amounts in vivo cause body size variants, and the RB1CC1 concentration variations are possibly caused by genotypic variants of RB1CC1. RB1CC1 studies will provide new insight into cartilaginous and skeletal development and may help to elucidate the causes of differences in individual growth and body size.
Supplementary Material
Acknowledgments
We are grateful to Yusuke Hama, Takuma Inui, and Sawako Hirayama for experimental assistance.
This work was supported by KAKENHI (Grant-in-Aid for Scientific Research) from the Ministry of Education, Culture, Sports, Science, and Technology, Japan and the Japanese Society of Laboratory Medicine Fund for the Promotion of Scientific Research.

The on-line version of this article (available at http://www.jbc.org) contains supplemental Figs. 1–3.
- GAG
- glycosaminoglycan
- COMP
- cartilage oligomeric matrix protein.
REFERENCES
- 1. Körkkö J., Cohn D. H., Ala-Kokko L., Krakow D., Prockop D. J. (2000) Am. J. Med. Genet. 92, 95–100 [DOI] [PubMed] [Google Scholar]
- 2. Horton W. A., Machado M. A., Ellard J., Campbell D., Bartley J., Ramirez F., Vitale E., Lee B. (1992) Proc. Natl. Acad. Sci. U.S.A. 89, 4583–4587 [DOI] [PMC free article] [PubMed] [Google Scholar]
- 3. Hoornaert K. P., Marik I., Kozlowski K., Cole T., Le Merrer M., Leroy J. G., Coucke P. J., Sillence D., Mortier G. R. (2007) Eur. J. Hum. Genet. 15, 1269–1275 [DOI] [PubMed] [Google Scholar]
- 4. Oldershaw R. A., Baxter M. A., Lowe E. T., Bates N., Grady L. M., Soncin F., Brison D. R., Hardingham T. E., Kimber S. J. (2010) Nat. Biotechnol. 28, 1187–1194 [DOI] [PubMed] [Google Scholar]
- 5. Foster J. W., Dominguez-Steglich M. A., Guioli S., Kwok C., Weller P. A., Stevanovi M., Weissenbach J., Mansour S., Young I. D., Goodfellow P. N. (1994) Nature 372, 525–530 [DOI] [PubMed] [Google Scholar]
- 6. Wagner T., Wirth J., Meyer J., Zabel B., Held M., Zimmer J., Pasantes J., Bricarelli F. D., Keutel J., Hustert E., Wolf U., Tommerup N., Schempp W., Scherer G. (1994) Cell 79, 1111–1120 [DOI] [PubMed] [Google Scholar]
- 7. Ghayor C., Herrouin J. F., Chadjichristos C., Ala-Kokko L., Takigawa M., Pujol J. P., Galéra P. (2000) J. Biol. Chem. 275, 27421–27438 [DOI] [PubMed] [Google Scholar]
- 8. Chano T., Ikegawa S., Kontani K., Okabe H., Baldini N., Saeki Y. (2002) Oncogene 21, 1295–1298 [DOI] [PubMed] [Google Scholar]
- 9. Melkoumian Z. K., Peng X., Gan B., Wu X., Guan J. L. (2005) Cancer Res. 65, 6676–6684 [DOI] [PubMed] [Google Scholar]
- 10. Ikebuchi K., Chano T., Ochi Y., Tameno H., Shimada T., Hisa Y., Okabe H. (2009) Int. J. Cancer 125, 861–867 [DOI] [PubMed] [Google Scholar]
- 11. Chano T., Ikebuchi K., Ochi Y., Tameno H., Tomita Y., Jin Y., Inaji H., Ishitobi M., Teramoto K., Nishimura I., Minami K., Inoue H., Isono T., Saitoh M., Shimada T., Hisa Y., Okabe H. (2010) PLoS One 5, e11404. [DOI] [PMC free article] [PubMed] [Google Scholar]
- 12. Martin N., Schwamborn K., Urlaub H., Gan B., Guan J. L., Dejean A. (2008) Mol. Cell. Biol. 28, 2771–2781 [DOI] [PMC free article] [PubMed] [Google Scholar]
- 13. Ochi Y., Chano T., Ikebuchi K., Inoue H., Isono T., Arai A., Tameno H., Shimada T., Hisa Y., Okabe H. (2011) Oncol. Rep. 26, 805–812 [DOI] [PubMed] [Google Scholar]
- 14. Chano T., Kontani K., Teramoto K., Okabe H., Ikegawa S. (2002) Nat. Genet. 31, 285–288 [DOI] [PubMed] [Google Scholar]
- 15. Schmidt-Kittler O., Ragg T., Daskalakis A., Granzow M., Ahr A., Blankenstein T. J., Kaufmann M., Diebold J., Arnholdt H., Muller P., Bischoff J., Harich D., Schlimok G., Riethmuller G., Eils R., Klein C. A. (2003) Proc. Natl. Acad. Sci. U.S.A. 100, 7737–7742 [DOI] [PMC free article] [PubMed] [Google Scholar]
- 16. Hara T., Takamura A., Kishi C., Iemura S., Natsume T., Guan J. L., Mizushima N. (2008) J. Cell Biol. 181, 497–510 [DOI] [PMC free article] [PubMed] [Google Scholar]
- 17. Hosokawa N., Hara T., Kaizuka T., Kishi C., Takamura A., Miura Y., Iemura S., Natsume T., Takehana K., Yamada N., Guan J. L., Oshiro N., Mizushima N. (2009) Mol. Biol. Cell 20, 1981–1991 [DOI] [PMC free article] [PubMed] [Google Scholar]
- 18. Hara T., Mizushima N. (2009) Autophagy 5, 85–87 [DOI] [PubMed] [Google Scholar]
- 19. Jung C. H., Jun C. B., Ro S. H., Kim Y. M., Otto N. M., Cao J., Kundu M., Kim D. H. (2009) Mol. Biol. Cell 20, 1992–2003 [DOI] [PMC free article] [PubMed] [Google Scholar]
- 20. Ganley I. G., Lam du H., Wang J., Ding X., Chen S., Jiang X. (2009) J. Biol. Chem. 284, 12297–12305 [DOI] [PMC free article] [PubMed] [Google Scholar]
- 21. Chan E. Y. (2009) Sci. Signal. 2, pe51. [DOI] [PubMed] [Google Scholar]
- 22. Mizushima N. (2010) Curr. Opin. Cell Biol. 22, 132–139 [DOI] [PubMed] [Google Scholar]
- 23. Morselli E., Shen S., Ruckenstuhl C., Bauer M. A., Mariño G., Galluzzi L., Criollo A., Michaud M., Maiuri M. C., Chano T., Madeo F., Kroemer G. (2011) Cell Cycle 10, 2763–2769 [DOI] [PubMed] [Google Scholar]
- 24. Gan B., Melkoumian Z. K., Wu X., Guan K. L., Guan J. L. (2005) J. Cell Biol. 170, 379–389 [DOI] [PMC free article] [PubMed] [Google Scholar]
- 25. Chano T., Saji M., Inoue H., Minami K., Kobayashi T., Hino O., Okabe H. (2006) Int. J. Mol. Med. 18, 425–432 [PubMed] [Google Scholar]
- 26. Rosner M., Hanneder M., Siegel N., Valli A., Hengstschläger M. (2008) Mutat. Res. 658, 234–246 [DOI] [PubMed] [Google Scholar]
- 27. Gan B., Peng X., Nagy T., Alcaraz A., Gu H., Guan J. L. (2006) J. Cell Biol. 175, 121–133 [DOI] [PMC free article] [PubMed] [Google Scholar]
- 28. Wei H., Gan B., Wu X., Guan J. L. (2009) J. Biol. Chem. 284, 6004–6013 [DOI] [PMC free article] [PubMed] [Google Scholar]
- 29. Ledig S., Röpke A., Wieacker P. (2010) Sex. Dev. 4, 225–232 [DOI] [PubMed] [Google Scholar]
- 30. Chano T., Ikebuchi K., Tomita Y., Jin Y., Inaji H., Ishitobi M., Teramoto K., Ochi Y., Tameno H., Nishimura I., Minami K., Inoue H., Isono T., Saitoh M., Shimada T., Hisa Y., Okabe H. (2010) PLoS One 5, e15737. [DOI] [PMC free article] [PubMed] [Google Scholar]
- 31. Paun B. C., Cheng Y., Leggett B. A., Young J., Meltzer S. J., Mori Y. (2009) PLoS One 4, e7715. [DOI] [PMC free article] [PubMed] [Google Scholar]
- 32. Chano T., Okabe H., Hulette C. M. (2007) Brain Res. 1168, 97–105 [DOI] [PubMed] [Google Scholar]
- 33. Liang C. C., Wang C., Peng X., Gan B., Guan J. L. (2010) J. Biol. Chem. 285, 3499–3509 [DOI] [PMC free article] [PubMed] [Google Scholar]
- 34. Liu F., Lee J. Y., Wei H., Tanabe O., Engel J. D., Morrison S. J., Guan J. L. (2010) Blood 116, 4806–4814 [DOI] [PMC free article] [PubMed] [Google Scholar]
- 35. Chano T., Saeki Y., Serra M., Matsumoto K., Okabe H. (2002) Am. J. Pathol. 161, 359–364 [DOI] [PMC free article] [PubMed] [Google Scholar]
- 36. Kanegae Y., Takamori K., Sato Y., Lee G., Nakai M., Saito I. (1996) Gene 181, 207–212 [DOI] [PubMed] [Google Scholar]
- 37. Shukunami C., Ishizeki K., Atsumi T., Ohta Y., Suzuki F., Hiraki Y. (1997) J. Bone Miner. Res. 12, 1174–1188 [DOI] [PubMed] [Google Scholar]
- 38. Sarbassov D. D., Guertin D. A., Ali S. M., Sabatini D. M. (2005) Science 307, 1098–1101 [DOI] [PubMed] [Google Scholar]
- 39. Bamba N., Chano T., Taga T., Ohta S., Takeuchi Y., Okabe H. (2004) Int. J. Mol. Med. 14, 583–587 [PubMed] [Google Scholar]
- 40. Takahashi I., Onodera K., Sasano Y., Mizoguchi I., Bae J. W., Mitani H., Kagayama M., Mitani H. (2003) Eur. J. Cell Biol. 82, 182–192 [DOI] [PubMed] [Google Scholar]
- 41. Nishida T., Kawaki H., Baxter R. M., Deyoung R. A., Takigawa M., Lyons K. M. (2007) J. Cell Commun. Signal. 1, 45–58 [DOI] [PMC free article] [PubMed] [Google Scholar]
- 42. Wehling N., Palmer G. D., Pilapil C., Liu F., Wells J. W., Müller P. E., Evans C. H., Porter R. M. (2009) Arthritis Rheum. 60, 801–812 [DOI] [PMC free article] [PubMed] [Google Scholar]
- 43. Buhrmann C., Mobasheri A., Matis U., Shakibaei M. (2010) Arthritis Res. Ther. 12, R127. [DOI] [PMC free article] [PubMed] [Google Scholar]
- 44. Abbi S., Ueda H., Zheng C., Cooper L. A., Zhao J., Christopher R., Guan J. L. (2002) Mol. Biol. Cell 13, 3178–3191 [DOI] [PMC free article] [PubMed] [Google Scholar]
Associated Data
This section collects any data citations, data availability statements, or supplementary materials included in this article.


