

Abstract
Background and Aims
Expansins are plant cell wall loosening proteins important in a variety of physiological processes. They comprise a large superfamily of genes consisting of four families (EXPA, EXPB, EXLA and EXLB) whose evolutionary relationships have been well characterized in angiosperms, but not in basal land plants. This work attempts to connect the expansin superfamily in bryophytes with the evolutionary history of this superfamily in angiosperms.
Methods
The expansin superfamily in Physcomitrella patens has been assembled from the Physcomitrella sequencing project data generated by the Joint Genome Institute and compared with angiosperm expansin superfamilies. Phylogenetic, motif, intron and distance analyses have been used for this purpose.
Key Results
A gene superfamily is revealed that contains similar numbers of genes as found in arabidopsis, but lacking EXLA or EXLB genes. This similarity in gene numbers exists even though expansin evolution in Physcomitrella diverged from the angiosperm line approx. 400 million years ago. Phylogenetic analyses suggest that there were a minimum of two EXPA genes and one EXPB gene in the last common ancestor of angiosperms and Physcomitrella. Motif analysis seems to suggest that EXPA protein function is similar in bryophytes and angiosperms, but that EXPB function may be altered.
Conclusions
The EXPA genes of Physcomitrella are likely to have maintained the same biochemical function as angiosperm expansins despite their independent evolutionary history. Changes seen at normally conserved residues in the Physcomitrella EXPB family suggest a possible change in function as one mode of evolution in this family.
Key words: Expansin, Physcomitrella patens, cell wall loosening, gene family evolution, plant phylogenetics, intron
INTRODUCTION
Expansins are a group of proteins first identified as being important in rapid pH-dependant plant cell wall extension or ‘acid growth’ (McQueen-Mason et al., 1992) and were subsequently characterized as a multigene family (Shcherban et al., 1995). A second family of expansin genes, which include a group of grass pollen allergens that loosen cell walls, was later identified (Cosgrove et al., 1997). These two families, initially referred to as α-expansins and β-expansins, respectively, have recently been renamed EXPA and EXPB (Kende et al., 2004). Two smaller families of expansins, EXLA and EXLB, have been identified by sequence similarity, although their function remains unknown at this time. The members of these four families that make up the expansin superfamily in plants share certain additional characteristics such as a two-domain structure, a signal peptide and intron similarities (Cosgrove, 2000; Sampedro and Cosgrove, 2005).
Expansins in the EXPA and EXPB families weaken the linkage between cellulose microfibrils, allowing them to slide past each other, or ‘creep’, in response to wall stress produced by the internal turgor pressure of the cell (Cosgrove, 2000). Expansins have now been implicated as being important in a host of plant growth and development processes. In addition to plant cell growth (Cho and Cosgrove, 2000; Lee and Kende, 2001; Lee et al., 2003), expansins have been shown to be involved in organogenesis (Cho and Cosgrove, 2002), wall degradation during fruit ripening (Civello et al., 1999; Rose and Bennett, 1999; Rose et al., 2000), pollen tube penetration of the stigma, and many other processes where cell wall loosening is crucial (Lee et al., 2001; Cosgrove et al., 2002; Li et al., 2003b).
Expansins often exhibit cell-specific expression patterns (Cho and Cosgrove, 2002; Gray-Mitsumune et al., 2004; Zenoni et al., 2004), suggesting their evolutionary history may involve the specialization of gene expression. Several studies have made attempts to further classify expansins (Link and Cosgrove, 1998) and understand the evolutionary origin and history of the expansin superfamily (Li et al., 2002). This has proved difficult due to the limitations of phylogenetic analyses and also due to a lack of information on the expansin superfamily in many key species, particularly more basal plant species. Through the use of gene colinearity data in conjunction with traditional phylogenetic techniques, the evolutionary relationships of expansins in arabidopsis (Arabidopsis thaliana), rice (Oryza sativa ‘Nipponbare’ – Japonica cultivar group) and poplar (Populus trichocarpa) is now well understood. These studies revealed 17 orthologous gene clades (12 EXPA, two EXPB. one EXLA, two EXLB) in the expansin superfamilies of arabidopsis and rice. This synteny-based analysis of evolution seems to be applicable to many angiosperm species and may be useful in all species where significant synteny can be detected (Sampedro et al., 2005, 2006).
Physcomitrella patens has been used for many years as a model bryophyte, owing much of its current popularity to its relatively efficient homologous recombination mechanisms and thus potential for reverse genetic studies (Schaefer, 2002). With the sequencing of the Physcomitrella patens genome (DOE Joint Genome Institute), the opportunity to extend the analyses of the expansin superfamily back to basal land plant lineages and to gain further understanding of the dynamic way in which this gene superfamily grows and changes is now available. When this study started, it was thought that a less complex, and perhaps smaller, gene family would be observed in Physcomitrella. The cell-specific expression pattern seen with many arabidopsis expansins (Cosgrove, 2000) led us to hypothesize that new expansins are likely to have arisen in response to new cell types. Therefore it was thought that mosses, with fewer described cell types, might have simpler expansin superfamilies. However, this prediction is not supported by the data collected for Physcomitrella. In this study, the structure of the expansin superfamily in Physcomitrella patens is analysed and this structure related to the superfamily previously defined in fully sequenced angiosperm genomes.
MATERIALS AND METHODS
Isolation of PpEXPA5 and PpEXPA6 sequences
The PCR techniques used to isolate these two Physcomitrella EXPA genes are detailed in Supplementary material available online.
Trace archive searches
Trace archives for Physcomitrella patens (5420 461 traces on 21 September 2005) were searched using the ‘Cross-species Mega BLAST’ (http://www.ncbi.nlm.nih.gov/blast/tracemb.shtml). All arabidopsis, rice and known Physcomitrella sequences (AY028634, AY074815, AY074816, AY074817, AY131155, AY131156, AY074818, AY074818) were used as BLAST queries under default parameters. The traces identified by these searches were downloaded in .scr trace format for assembly into contigs. All new Physcomitrella expansins found in this way were then used to search the trace archive again.
Assembly of contigs
Trace files were assembled into contigs with the SeqMan application in the DNASTAR software package. The ends of the traces were trimmed on the ‘high’ quality setting (quality score = 16). The alignments were created with a minimum match percentage of 90 % over 50 base pairs. Assembly was performed after the completion of all searches.
Determination of intron positions
Where feasible, the DNASTAR MegAlign program was used to identify intron locations by alignment of cDNA or EST sequence and genomic sequences. When only genomic sequences were available, the NetGene2 internet service (http://www.cbs.dtu.dk/services/NetGene2/) was used to predict intron splice sites. Alternatively, translated sequences were aligned with closely related protein sequences and the intron locations were estimated from gaps in the alignment and previous knowledge of expansin introns.
Sequence alignment and phylogenetic tree construction
Alignments of Physcomitrella sequences (see Supplementary material available online) with selected arabidopsis and rice sequences were generated via the Clustal W function of the MegAlign application of the DNASTAR software package with default alignment parameters (Gonnet Series protein weight matrix, gap penalty of 15, gap length penalty of 6·66, delay Divergent Seqs 30 %). The alignments were then trimmed from a conserved tryptophan near the N terminus to a conserved phenylalanine near the C terminus in order to remove the signal peptide and C terminal extensions (a very long C terminal extension for PpEXPA20 is not completely removed in this way) present in some expansin genes.
These alignments (see Supplementary material) were then used as the input to generate Bayesian, parsimony and neighbour-joining phylogenetic trees. MrBayes version 3·0b4 (Huelsenbeck and Ronquist, 2001) was used to generate the Bayesian trees (Jones amino acid model, gamma estimation, 300 000 generations, five Markov chains – burnin as indicated in figure legends). The TREEVIEW software application (Page, 1996) was then used to visualize the consensus trees and manually root them at Physcomitrella groups A, B and C for EXPA trees or at AtEXPA1 for EXPB trees.
Protein parsimony trees were made using the same alignment with the Phylogenetic Analysis Using Parsimony software package (PAUP*) version 4·0 (Swofford, 2002). Maximum parsimony trees were generated by a heuristic search with 100 replicates using random additions. A bootstrap analysis with 500 replicates was then performed with ten random branch addition replicates per bootstrap replicate. The trees were then visualized and manually rooted as above. If the bootstrap consensus tree contained adequate information, it was used in the figure. If many branches in the consensus tree were poorly resolved, then one of the maximum parsimony trees was used with bootstrap values noted on nodes with good support in the bootstrap consensus tree.
Neighbour-joining trees were constructed using the MEGA Phylogeny software version 3·1 (Kumar et al., 2004). Poisson-corrected amino acid distances with complete deletion of gaps were used as input to the neighbour-joining algorithm. Bootstrap properties were based on 1000 bootstrap replicates. The trees were manually rooted as above.
Generation of sequence LOGOs
Amino acid sequences for all arabidopsis, rice and Physcomitrella EXPA or EXPB genes were aligned using the MUSCLE 3·6 sequence alignment program (Edgar, 2004) and trimmed as was done for phylogenetic tree construction. Any insertions specific to less than 50 % of the aligned sequences were removed. These alignments were then divided into Physcomitrella and arabidopsis–rice portions and used to generate sequence LOGOs using WebLOGO (Crooks et al., 2004; http://weblogo.berkeley.edu/).
Calculation of between group mean distances, Ka/Ks, and base compositions
Amino acid alignments of all Populus, arabidopsis, rice and Physcomitrella EXPA and EXPB sequences were made using the Clustal W alignment feature of the MEGA 3·1 software package (Kumar et al., 2004). MEGA 3·1 was then used to determine the between-group mean Poisson-corrected amino acid distances with pairwise deletion of gaps. Standard error was also calculated for these values using 500 bootstrap replicates. Synonymous and nonsynonymous substitution rates as well as base compositions were also calculated using MEGA 3·1 (Kumar et al., 2004).
RESULTS
A census of the expansin superfamily in Physcomitrella patens
Using the raw sequence available for Physcomitrella in the NCBI trace archive on 21 September 2005 (http://www.ncbi.nlm.nih.gov/Traces/trace.cgi?) the first look at the expansin superfamily in basal land plants was obtained (see Supplementary material). The sequence in the database represented a 10·8 × genome coverage based on a genome size of 511 Mb (Schween et al., 2003).
In Table 1, a comparison of the relative sizes of the expansin families (EXPA, EXPB, EXLA and EXLB) is presented for the two fully sequenced angiosperms as well as the data currently available from Populus and Physcomitrella. As is the case in arabidopsis, rice and Populus, the EXPA family is the largest family in Physcomitrella. The EXPB family of Physcomitrella appears not to have expanded as occurred in rice and is of a size similar to that in arabidopsis and Populus. Several partial EXPA and EXPB sequences,thought to be pseudogenes, were also found (see Supplementary material).
Table 1.
Numbers and type of expansin genes found in a sampling of plant species with completed or nearly completed genome sequences
| Arabidopsis thaliana | Oryza sativa | Populus trichocarpa | Physcomitrella patens | |
|---|---|---|---|---|
| EXPA | 26 | 33 | 27 | 27 |
| EXPB | 6 | 18 | 3 | 7 |
| EXLA | 3 | 4 | 2 | 0 |
| EXLB | 1 | 1 | 4 | 0 |
| Sequences available: | Complete genome | Complete genome | 473·1 Mbp | 5546·3 Mbp in |
| 22 136 scaffolds | 5420 461 traces | |||
| 7·5 × coverage | 10·8 × coverage |
In contrast to the three species previously studied, it has not been possible to identify any sequence in the extensive trace archive for Physcomitrella that corresponds to the EXLA or EXLB family. This is likely to indicate that these families arose after the divergence of the Physcomitrella lineage from the angiosperm lineage, as the presence of these genes was not detected by either the nucleotide–nucleotide MEGA BLAST offered on the trace archive or by a tBLASTx search of the Physcomitrella trace archive locally (thanks to Kerr Wall and Claude dePamphilis). Similar searches of the Selaginella moellendorffii genome did not reveal the presence of these genes either (data not shown). If these genes are indeed absent in Physcomitrella and Selaginella, it is more likely that they arose later in land plant evolution rather than were lost independently in both lineages. The availability of more basal land plant genomes will doubtless provide an answer to this question.
Phylogenetic analysis of Physcomitrella expansins
An analysis of the expansin superfamily in arabidopsis and rice (Sampedro et al., 2005), utilizing gene colinearity data in conjunction with traditional phylogenetic techniques, revealed that there are 17 orthologous clades (13 EXPA, two EXPB, one EXLA, two EXLB) shared between arabidopsis and rice. These clades were numbered in that study using the family name followed by a roman numeral (i.e. EXPA-IV). Although microsynteny cannot be used to compare organisms as distantly related as Physcomitrella and angiosperms, the classification system of Sampedro et al. (2005) will be utilized here to discuss the relationship of Physcomitrella expansins to their angiosperm counterparts based upon results obtained via traditional phylogenetic techniques.
The 27 EXPA genes assembled from trace data for Physcomitrella were translated into amino acid sequences and aligned with a selection of arabidopsis and rice sequences representing the clades described by Sampedro et al. (2005). A Populus sequence (PtEXPA26) has been added to better resolve clade EXPA-XI. This alignment (see Supplementary material) was then used to produce Bayesian, parsimony and neighbour-joining phylogenetic trees. Figure 1 shows a Bayesian likelihood phylogenic tree based on this alignment.
Fig. 1.

Bayesian likelihood tree for EXPA family. Burnin was set to 60. The tree was rooted manually at groups A, B and C. Clade and groupings are marked with circles (or bars when they are poorly resolved as in the case of clades EXPA-I, EXPA-II and EXPA-III). Physcomitrella patens sequences are unshaded, rice sequences are shaded in black, arabidopsis sequences boxed, and a Populus sequence in grey text. Intron patterns (‘o’ indicates an intronless gene) are given next to each gene's name, and the typical EXPA intron pattern is indicated.
None of the Physcomitrella EXPA genes group consistently with a particular described clade from arabidopsis, rice and Populus. They do have their own distinct groupings, however, and may be divided into six groups (A–F on Fig. 1) based on phylogenetic analyses.
Groups A, B and C all form one large grouping on the Bayesian tree with good support (1·00). This is also seen in the parsimony or neighbour-joining trees shown in Supplementary material.
Group C is distinguishable not only by its placement on phylogenetic trees, but also by its intron pattern. Many of the Physcomitrella EXPA genes found in the trace archive have only intron ‘B’ or are intronless (Fig. 1). All of these genes belong to group C. All other known Physcomitrella EXPA genes have either both introns ‘A’ and ‘B’ or intron ‘A’ only (Fig. 2). This group also shows a relatively high level of sequence divergence as indicated by longer branches in all tree building methods.
Fig. 2.

Model of intron evolution for Physcomitrella EXPA family. Black bars represent from left to right, the EXPA family, putative Physcomitrella homologous groupings, and genes within these groupings. Intron losses are indicated below the lines leading to each group.
Another characteristic of this group is a substitution of the normally highly conserved HATFYG motif near the N terminus of EXPA proteins (see Fig. 2, residues 5–10) with HITYYG (and in one case RITYYG). This unique motif, combined with the shared intron pattern and proliferation of intronless genes, may suggest that this group has expanded recently, perhaps via retrotransposition events, and that its members have gone through a period of relaxed selection. The average synonymous and nonsynonymous substitution rate (Ka/Ks) within the Physcomitrella groups presented here for group C is 0·292, while groups A and B have Ka/Ks ratios of 0·269 and 0·346, respectively. Thus, while selection may have once been relaxed on the genes of this group, we conclude that group C is evolving under purifying selection.
Group D consists of two genes (PpEXPA8 and PpEXPA13). Although this group is grouped with AtEXPA8 on the Bayesian tree (Fig. 1), the support is fairly weak (0·78) and this grouping is not supported by the other tree building methods (see Supplementary material). Thus, the relationship of this group to an angiosperm clade cannot be established.
The final two Physcomitrella EXPA sequences, PpEXPA1 and PpEXPA6, do not seem to branch consistently as a sister to any known clade. Therefore these genes are each placed into their own unique group, E and F, respectively.
EXPA trees are all rooted at Physcomitrella groups A, B and C as this is more congruent with the species tree. In a separate analysis, the expansin superfamily from Selaginella moellendorffii (a spikemoss, also sequenced by JGI) was assembled. Including Selaginella genes in these trees supports this rooting. Bayesian trees rooted with an EXPB sequence containing the Selaginella EXPA family place Physcomitrella groups A, B and C at the base of the tree (data not shown). Rooting EXPA trees containing only Physcomitrella and angiosperm sequence with an EXPB sequence roots the tree at clade EXPA-X (data not shown). This places the Physcomitrella sequences internally on the tree, and it is difficult to resolve with the species tree, thus leading to the rooting of the trees at Physcomitrella groups A, B and C. It must be emphasized that until these rooting difficulties are resolved, estimations of gene numbers in the last common ancestor of Physcomitrella and angiosperms will be uncertain.
Six of the seven EXPB genes assembled from Physcomitrella were translated into amino acid sequence and aligned with a selection of arabidopsis and rice sequences representing the clades described by Sampedro et al. (2005). PpEXPB7 was not included because it is a partial sequence and a probable pseudogene. This alignment (see Supplementary material) was then used to produce Bayesian, parsimony and neighbour-joining phylogenetic trees. Figure 3 shows a Bayesian likelihood phylogenic tree based on this alignment.
Fig. 3.
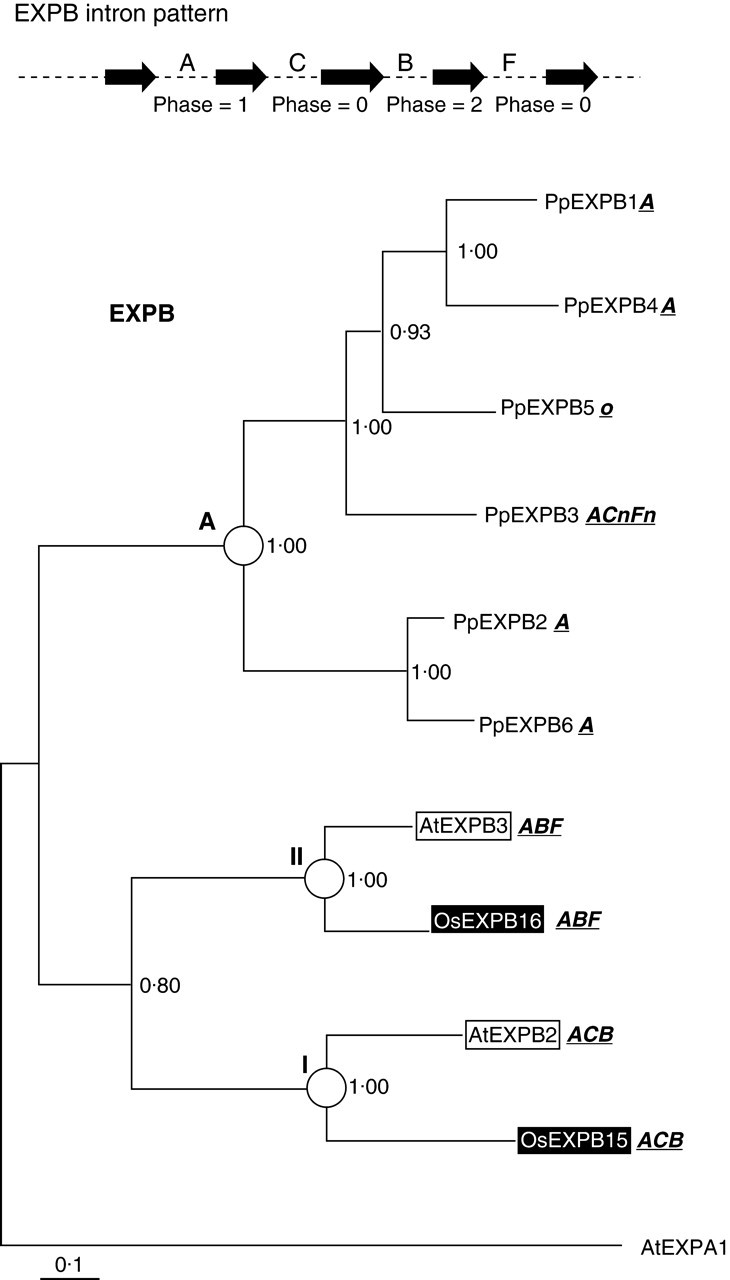
Bayesian likelihood tree for EXPB family. Burnin was set to 10. The tree was rooted at AtEXPA1. Clade and groupings are marked with circles or bars. Physcomitrella patens sequences are unshaded, rice sequences are shaded in black, and arabidopsis sequences boxed. Intron patterns are given next to each gene's name (‘o’ represents an intronless gene and ‘n’ represents a novel intron), and the typical EXPB intron pattern is indicated.
These Physcomitrella EXPB sequences all group together and form a branch outside of arabidopsis–rice clades EXPB I and II in the Bayesian and parsimony trees when the tree is rooted with an EXPA sequence (AtEXPA1), suggesting that Physcomitrella EXPB genes are a monophyletic sister group to all angiosperm EXPB genes. This is not seen in the neighbour-joining tree (see Supplementary material), with the Physcomitrella sequences grouping as a sister to clade EXPB-I. When EXPB sequences from Selaginella moellendorffii are added, the Physcomitrella EXPB clearly form a group outside of clades EXPB-I and EXPB-II in all tree-building methods (data not shown).
Previous work has shown the difficulty in using traditional phylogenic methods to elucidate relationships between members of the expansins families (Sampedro et al., 2005). Also, without the addition of extensive gymnosperm and expansin sequences from other seedless land plant lineages, phylogenetic reconstructions of angiosperm and bryophyte gene families may be unreliable. Future analyses will certainly need to include more intermediary sequences as they becomes available in order to improve the quality of these gene family phylogenies. Trees built with the relatively sparse gymnosperm EXPA and EXPB now available do not improve the resolution of the Physcomitrella expansin phylogenies (data not shown), doubtless due to the very incomplete sequence sets available for these organisms. Estimates of the number of expansins in the last common ancestor of Physcomitrella and angiosperms given here are not affected by adding gymnosperm sequences currently available to the analysis.
Distances of Physcomitrella expansins to angiosperm expansins
In order to better understand the relationship of the Physcomitrella expansin families to their angiosperm counterparts, Poisson-corrected amino acid distances were calculated for each Physcomitrella expansin to each arabidopsis and rice expansin (see Supplementary material). The average between-group Poisson-corrected amino acid distances for both the EXPA and EXPB families of arabidopsis, Populus, rice and Physcomitrella were also calculated (Fig. 4). Figure 4 shows that, as would be expected, the Physcomitrella EXPA and EXPB families have a greater average distance to the arabidopsis families than do the families from Populus or rice. It should also be noted that the EXPB distances are in general somewhat greater, suggesting lower levels of conservation than are present in the EXPA family.
Fig. 4.

Average distances of Physcomitrella expansin gene families to their angiosperm counterparts. (A) Between group average distances for the EXPA gene family. Values indicated are the average Poisson-corrected amino acid distance to the arabidopsis EXPA family. Error bars are standard errors based on 500 bootstrap replicates. (B) Between group average distances for the EXPB gene family. Values indicated are the average Poisson-corrected amino acid distance to the arabidopsis EXPA family. Error bars are standard errors based on 500 bootstrap replicates.
Although the average distances of Physcomitrella expansins to their angiosperm counterparts is great, certain individual genes have surprisingly low distances. PpEXPA1, for example, has a very low Poisson-corrected amino acid distance to many arabidopsis and rice sequences (when compared with other Physcomitrella EXPA genes; see Supplementary material). The average nucleotide composition of the EXPA family (see Supplementary material) in arabidopsis, rice and Physcomitrella reveals a possible bias in Physcomitrella genes. This slight bias seen in Physcomitrella may contribute to the difficulty in placing even sequences such as PpEXPA1 as a sister to an angiosperm clade.
Intron pattern of Physcomitrella expansins
In addition to having a conserved amino acid sequence, expansins have been shown to have a fairly conserved intron pattern (see the expansin website, http://www.bio.psu.edu/expansins/). Sampedro et al. (2005) (see Supplementary material) hypothesized the evolutionary history of these introns. Based on what was known of the intron patterns seen in arabidopsis and rice, the intron pattern for ancestral EXPA and EXPB sequences was modelled using parsimony as a basis for determining the pattern (the number of gains/losses was minimized). In this way, it was hypothesized that the ancestral EXPA intron pattern consisted of introns ‘A’ and ‘B’. The ancestral EXPB intron pattern was hypothesized to consist of introns ‘A’, ‘B’, ‘C’ and ‘F’.
Of the 27 EXPA genes now known in Physcomitrella, 15 have introns ‘A’ and ‘B’, one has only intron ‘A’, six have only intron ‘B’ and six are intronless. These patterns are indicated next to the gene names in Fig. 1. Figure 2 shows a model of the evolution of the pattern based on these phylogenetic analyses (Fig. 1) and the inferred ancestral intron patterns mentioned above. Of the six full-length EXPB genes now discovered in Physcomitrella, four have only intron ‘A’, one is intronless and one has ‘A’, ‘C’, ‘F’ and two novel introns. These patterns are indicated next to the gene names in Fig. 3. Figure 5 shows a model for the evolution of these patterns based on the inferred ancestral EXPB intron pattern from Sampedro et al. (2005).
Fig. 5.

Model of intron evolution for Physcomitrella EXPB family. Black bars represent from left to right, the EXPB family, putative Physcomitrella homologous groupings, and genes within these groupings. Intron losses are indicated below the lines and intron gains above the lines leading to each group.
Sequence LOGOS
In an effort to determine if any of the highly conserved amino acid residues seen in angiosperm expansin are altered in Physcomitrella, a sequence LOGO (http://weblogo.berkeley.edu/) (Schneider and Stephens, 1990; Crooks et al., 2004) comparing the EXPA gene family in rice and arabidopsis with Physcomitrella was generated. This LOGO is shown in Fig. 6 (boxed residues are normally conserved across all four expansin families). There do not appear to be any differences in highly conserved amino acid residues in Physcomitrella when compared with the rice–arabidopsis sequence.
Fig. 6.

SeqLOGO for the EXPA family. In each pair, the top lines are rice/arabidopsis sequences and the lower lines are Physcomitrella. The height of the letters indicates frequency of the amino acid in that group of sequences. Boxed residues represent those that are normally conserved in all four expansin families.
Figure 7 shows a sequence LOGO for the EXPB gene family in rice and arabidopsis compared with one from Physcomitrella. It appears that there are at least six conserved differences between the Physcomitrella and arabidopsis/rice EXPB genes. These are marked with arrows and consist of a threonine in Physcomitrella at residue 27 where one is typically not seen, a conserved histidine at residue 91 in arabidopsis and rice changed to an alanine in Physcomitrella, a phenylalanine at residue 99 in arabidopsis and rice changed to an isoleucine in Physcomitrella, an aspartic acid at residue 155 changed to a proline, and two conserved tryptophans at residues 172 and 218 changed to phenylalanine.
Fig. 7.

SeqLOGO for the EXPB family. In each pair, the top lines are rice/arabidopsis sequences and the lower lines are Physcomitrella. The height of the letters indicates frequency of the amino acid in that group of sequences. Boxed residues represent those that are normally conserved in all four expansin families. Black arrows indicate changes in the Physcomitrella EXPB family to normally conserved residues in EXPB genes. Codes indicate the region of the protein in which the change resides. LBS = long binding surface; HC = hydrophobic core; BDC = between domain contacts; SBP = short binding pocket (Yennawar et al., 2006).
DISCUSSION
With the availability of extensive genomic sequence for Physcomitrella patens, understanding of the patterns of expansin superfamily evolution may be extended to some of the earliest land plant lineages. With the extensive analysis of angiosperm expansin evolution made by Sampedro et al. (2005, 2006) as a framework, it was not possible to place any Physcomitrella sequences as a sister group to particular arabidopsis/rice clades. Instead, potential orthologous groups with multiple arabidopsis/rice clades were observed (all Physcomitrella EXPB genes appear to be co-orthologues of both arabidopsis/rice EXPB clades, for example). This is based on the phylogenetic analyses of the Physcomitrella EXPA and EXPB gene families presented here (Figs 1 and 3, and Supplementary material). The large evolutionary distances between Physcomitrella and angiosperms complicate these analyses. At present, however, a minimum of two EXPA genes and one EXPB gene in the last common ancestor of angiosperms and Physcomitrella may be inferred based on the position of Physcomitrella gene groups on phylogenetic trees.
The pattern of introns seen in Physcomitrella is useful for determining the pattern of intron evolution in the EXPA family, with the pattern seen in this bryophyte supporting the predicted ancestral state estimated from previously available angiosperm sequences (Sampedro et al., 2005).
Superfamily composition
The most obvious difference between the Physcomitrella and angiosperm expansin superfamilies is the lack of members of the EXLA or EXLB family. Members of both of these families are present in pine (Sampedro et al., 2006). One could determine when these gene families first arose by analysing fern, horsetail or basal Spermatopsida sequences. It might then prove interesting to relate the appearance of these divergent expansin families with a functional or morphological innovation during land plant history. The uncertain biological function of the EXLA and EXLB gene families make predictions of the timing of their appearance difficult at this time.
The relatively small size of the EXPB gene family found in Physcomitrella, Populus and arabidopsis, as compared with the larger family in rice, may be related to the unique cell wall chemistry of grasses compared with other monocots, eudicots or moss (Carpita, 1996; Popper and Fry, 2003). The pollen EXPB proteins from maize are more efficacious at causing cell wall creep in grass walls than in dicot walls (Cosgrove et al., 1997; Li et al., 2003a), from which it can be inferred that certain EXPB proteins may be optimized for cell wall loosening in grass cell walls. The composition of the Physcomitrella EXPB gene family is more evidence that this expansion of the EXPB family is grass specific, possibly as an adaptation to altered cell wall chemistry in grasses.
Physcomitrella patens phylogenetic analysis and ancestral gene number estimates
The Physcomitrella EXPA family can be broken into several potentially homologous groupings supported by all phylogenetic trees and other data such as intron patterns. Groups A, B and C form a single large group that appears to be bryophyte specific. Bayesian trees including the Selaginella sequence rooted at an EXPB gene (data not shown) suggest that these groups may be sister groups to all angiosperm EXPA genes.
Several members of groups A, B and C have been shown to increase their expression levels in response to NaCl, perhaps in the production of a ‘brood cell’ to resist desiccation (Schipper et al., 2002). Without a well-developed vascular system, resistance to desiccation is a more pressing concern in mosses than in vascular plants, and could indicate a need for multiple expansin genes used in response to salt stress. There are no known angiosperm expansins related to these groups of Physcomitrella EXPA genes. However, when all of the Physcomitrella EXPA genes are constrained as a monophyletic group and a parsimony analysis is performed, maximum parsimony trees of length 2284 are obtained (only two steps longer than the maximum parsimony trees; see Supplementary material), indicating that even the sequences outside of these three groups may be difficult to relate to angiosperm genes.
The remaining Physcomitrella EXPA sequences can be placed into three groups (D, E and F) based on phylogenetic trees (see Fig. 1 and Supplementary material). These seem to be more closely related to angiosperm expansins but are not obviously a sister group to any specific arabidopsis–rice clade. When these three groups are constrained to be monophyletic and a parsimony analysis is done, however, maximum parsimony trees of length 2288 are obtained (six steps longer than the maximum parsimony trees; see Supplementary material). This result suggests that there may be some relationship between these groups and the angiosperm clades, but phylogenetic analyses cannot resolve them at this time.
Thus, based on these analyses, we predict that the last common ancestor of Physcomitrella and angiosperms had a minimum of two EXPA genes: one giving rise to groups A, B and C, and the other giving rise to groups D, E and F and the angiosperm expansins. This would be consistent with a model of expansin evolution in which a core group of ‘generalist’ expansins may give rise to groups of expansins with more specialized roles in different plant lineages.
In light of the evidence that suggests that the expansin gene families have evolved mostly independently in Physcomitrella and angiosperms, the similarity of the EXPA gene family size in these groups may be significant. It may in fact reflect some vital role of gene family size in expansin function. From the data shown in Table 1, it would seem that a gene family of a certain size is critical for fulfilling the multiple roles of expansins in planta, but that beyond some maximum number of genes (around 30 for the EXPA family, for instance), function perhaps becomes redundant.
It appears that the Physcomitrella EXPB genes are not a sister group to either of the known EXPB clades, but may instead be a sister group to the entire tracheophyte EXPB family, indicating one EXPB gene in the last common ancestor of Physcomitrella and angiosperms. EXPB gene sequences from additional bryophytes and perhaps green algae may clarify whether this group represents a more ancestral EXPB protein or a specialization seen in Physcomitrella.
Physcomitrella patens expansin distance analysis
The lone gene of group E, PpEXPA1, is expressed to high levels in Physcomitrella protonema under a variety of treatment conditions (Schipper et al., 2002). This gene also has the lowest pairwise distance to an arabidopsis or rice EXPA gene of any Physcomitrella EXPA gene (see Supplementary material), with a low distance of 0·344 to AtEXPA10 (arabidopsis–rice clade EXPA-I). Arabidopsis–rice clades EXPA I-IV are the most conserved of all the arabidopsis–rice clades (they have the lowest distances between putative arabidopsis and rice orthologues – data not shown), indicating that they are under strong purifying selection. In fact, nearly all Physcomitrella EXPA genes have their lowest pairwise distance to a member of these clades (see Supplementary material), again potentially suggesting that they are more conserved. The generally high expression levels of PpEXPA1 in protonema tissue along with its low pairwise distance to these conserved arabidopsis–rice clades may indicate a more general cell-wall loosening role and potentially ancestral function for this gene. It should also be noted that Schipper et al. (2002) were unable to obtain knockouts of this particular Physcomitrella EXPA gene via homologous recombination. This could indicate a critical role for this gene in Physcomitrella growth and development (assuming that knockouts were not obtained due to their lethality).
Despite isolated cases like that of PpEXPA1, most of the Physcomitrella expansins have fairly great distances to their angiosperm counterparts (Fig. 4). This large evolutionary distance doubtlessly adds to the difficulty of phylogenetic analysis mentioned previously. The somewhat larger EXPB distances tell a similar story to the EXPB sequence LOGO (Fig. 7), with changes to normally conserved amino acids indicating less conservation in this family.
Physcomitrella patens expansin intron pattern analysis
While there is no detectable sequence homology among expansin introns, their position and phase is conserved between angiosperms and Physcomitrella. Therefore, an analysis of their evolutionary history is possible based on observing patterns of intron losses and gains.
The intron pattern seen in Physcomitrella EXPA genes supports the ancestral ‘AB’ intron pattern as being the most parsimonious, as only three losses and no gains are required, while other ancestral states would require more changes (Fig. 2). PpEXPA4 contains an intron in its 5′ untranslated region (Schipper et al., 2002) that may or may not correspond to intron ‘G’ [see Sampedro et al. (2005) and Supplementary material]. Without the much more conserved amino acid coding sequence as a reference this is difficult to ascertain. This intron is considered novel in order to simplify the evolution model.
The Physcomitrella EXPB genes present a more complicated intron story. Figure 5 shows that an ancestral intron pattern of ‘ACBF’ requires at least six intron losses and two intron gains to reflect current intron patterns. An ancestral intron pattern of ‘AB’ would require two losses and four gains, whereas an ancestral pattern of ‘A’ would require one loss and four gains.
For now an inferred ancestral intron pattern of ‘ACBF’ for the EXPB family will be retained despite it being a less parsimonious explanation for the intron patterns observed. This is based on the presence of introns ‘A’ and ‘B’ in both EXPA and EXPB families and the presence of intron ‘C’ in an ancient group of barwin-like proteins distantly related to expansin domain 1 (Friedrich et al., 1991; Sampedro and Cosgrove, 2005). This analysis is, of course, subject to revision as more data becomes available, particularly from other bryophytes or Charaphycean algae (if they have comparable expansin genes).
Conservation of the amino acid sequence in Physcomitrella patens expansins
It is concluded from the presence of all normally highly conserved amino acids in the Physcomitrella EXPA family (Fig. 6) that the biochemical function of EXPA proteins is likely to be the same in Physcomitrella as in angiosperms. Most of the changes leading to the great distances between Physcomitrella and angiosperm EXPA genes are occurring in the normally less conserved portions of the protein. While some selective pressure has influenced the composition of these regions in Physcomitrella and angiosperms, no Physcomitrella-specific motifs were detected that would lead to the conclusion that differences in these regions represent changes in EXPA function in Physcomitrella as compared with angiosperms.
The changes to several of the normally highly conserved amino acid residues seen in the Physcomitrella EXPB genes (Fig. 7), on the other hand, may indicate an alteration of biochemical function in this family. These changes are distributed in the long binding surface, hydrophobic core, contact area between domains, and in the short binding pocket of the EXPB protein (see Fig. 7) as determined by the crystal structure of Zea m 1, a pollen EXPB gene from maize (Yennawar et al., 2006). Most of these conserved changes are conservative or neutral based on a PAM250 matrix. The only two substitutions that are not conservative are the alanine for histidine in the hydrophobic core and the proline for aspartic acid in an area of contact between domains 1 and 2 (see Fig. 7). This would seem to indicate that any alteration in the Physcomitrella EXPB protein would potentially involve shape and domain arrangement rather than in the way it interacts with polysaccharides. Thus, although some change of function cannot be ruled out, conservation of amino acid types at putative binding surfaces would suggest a similar function for Physcomitrella EXPB genes to their angiosperm counterparts.
It is still possible that the Physcomitrella EXPB genes represent a more ancestral form of the gene from which both arabidopsis–rice clade EXPB-I and EXPB-II are derived. Alternatively, it is possible that these genes satisfy a bryophyte-specific need and are more derived themselves.
CONCLUSIONS
The availability of large amounts of genomic sequence from Physcomitrella patens affords us a great opportunity to begin to unravel the evolutionary history of the expansin gene superfamily.
The complex expansin superfamily in Physcomitrella revealed here does not support the hypothesis that new expansins evolved during the evoution of new cell types (Cosgrove, 2000). Even this moss, which has fewer described cell types than angiosperms, seems to find it an advantage to maintain a large superfamily with multiple subdivisions.
It was not possible to place any group of Physcomitrella expansins sister to a known arabidopsis/rice expansin clade using sequence-based phylogenetic techniques, probably due to the large evolutionary distances between Physcomitrella and angiosperm expansins. Future analyses will need to include substantial gymnosperm and other intermediary expansin sequences as they become available to help reduce the inevitable tree-building inaccuracy associated with comparing such distantly related organisms. It must also be acknowledged that these difficulties mean that the estimate of two EXPA and one EXPB gene in the last common ancestor of Physcomitrella and angiosperms is likely an underestimation and that this estimate requires a large number of gene duplications to explain the observed gene patterns.
The lack of obviously homologous groups of genes between Physcomitrella and angiosperms, coupled with the lack of conserved amino acid differences in the EXPA gene family between arabidopsis/rice and Physcomitrella, lead to the conclusion that this family is likely to have evolved to meet the specialized needs of this bryophyte without altering the biochemical function of EXPA proteins observed in angiosperms. The Physcomitrella EXPB family, on the other hand, contains conserved amino acid changes at important sites, potentially indicating an alteration in protein function. The conservation of binding surfaces, however, argues for a similar function. As the genomics age progresses and more and more species give up their secrets, the dynamic nature of this superfamily, so integral to plant growth and development, will doubtlessly become clear as will its importance to the regulation and diversification of plant morphologies.
SUPPLEMENTARY MATERIAL
Supplementary material, available online at http://aob.oxfordjournals.org/ contains trees built by alternate methods, sequence assemblies, alignments, a description of the isolation of PpEXPA5 and PpEXAP6, and of partial gene sequences.
ACKNOWLEDGEMENTS
The authors acknowledge the contribution of P. Kerr Wall to the data search and assembly portion of this work. We also thank Claude W. dePamphilis for his contribution to the data assembly and phylogenetic analyses presented here, and for many stimulating discussions. This work was funded by an NSF Graduate Research Fellowship to R.E.C. and NSF grant IBN-9874432 to D.J.C.
LITERATURE CITED
- Carpita NC. Structure and biogenesis of the cell walls of grasses. Annual Review of Plant Physiology and Plant Molecular Biology. 1996;47:445–476. doi: 10.1146/annurev.arplant.47.1.445. [DOI] [PubMed] [Google Scholar]
- Cho HT, Cosgrove DJ. Altered expression of expansin modulates leaf growth and pedicel abscission in Arabidopsis thaliana. Proceedings of the National Academy of Sciences of the USA. 2000;97:9783–9788. doi: 10.1073/pnas.160276997. [DOI] [PMC free article] [PubMed] [Google Scholar]
- Cho HT, Cosgrove DJ. Regulation of root hair initiation and expansin gene expression in Arabidopsis. The Plant Cell. 2002;14:3237–3253. doi: 10.1105/tpc.006437. [DOI] [PMC free article] [PubMed] [Google Scholar]
- Civello PM, Powell AL, Sabehat A, Bennett AB. An expansin gene expressed in ripening strawberry fruit. Plant Physiology. 1999;121:1273–1280. doi: 10.1104/pp.121.4.1273. [DOI] [PMC free article] [PubMed] [Google Scholar]
- Cosgrove DJ. Loosening of plant cell walls by expansins. Nature. 2000;407:321–326. doi: 10.1038/35030000. [DOI] [PubMed] [Google Scholar]
- Cosgrove DJ, Bedinger P, Durachko DM. Group I allergens of grass pollen as cell wall-loosening agents. Proceedings of the National Academy of Sciences of the USA. 1997;94:6559–6564. doi: 10.1073/pnas.94.12.6559. [DOI] [PMC free article] [PubMed] [Google Scholar]
- Cosgrove DJ, Li LC, Cho HT, Hoffmann-Benning S, Moore RC, Blecker D. The growing world of expansins. Plant Cell Physiology. 2002;43:1436–1444. doi: 10.1093/pcp/pcf180. [DOI] [PubMed] [Google Scholar]
- Crooks GE, Hon G, Chandonia JM, Brenner SE. WebLogo: a sequence logo generator. Genome Research. 2004;14:1188–1190. doi: 10.1101/gr.849004. [DOI] [PMC free article] [PubMed] [Google Scholar]
- Edgar RC. MUSCLE: a multiple sequence alignment method with reduced time and space complexity. BMC Bioinformatics. 2004;5:113. doi: 10.1186/1471-2105-5-113. [DOI] [PMC free article] [PubMed] [Google Scholar]
- Friedrich L, Moyer M, Ward E, Ryals J. Pathogenesis-related protein 4 is structurally homologous to the carboxy-terminal domains of hevein, Win-1 and Win-2. Molecular and General Genetics. 1991;230:113–119. doi: 10.1007/BF00290658. [DOI] [PubMed] [Google Scholar]
- Gray-Mitsumune M, Mellerowicz EJ, Abe H, Schrader J, Winzell A, Sterky F, et al. Expansins abundant in secondary xylem belong to subgroup A of the alpha-expansin gene family. Plant Physiology. 2004;135:1552–1564. doi: 10.1104/pp.104.039321. [DOI] [PMC free article] [PubMed] [Google Scholar]
- Huelsenbeck JP, Ronquist F. MrBayes: Bayesian inference of phylogenetic trees. Bioinformatics. 2001;17:754. doi: 10.1093/bioinformatics/17.8.754. [DOI] [PubMed] [Google Scholar]
- Kende H, Bradford K, Brummell D, Cho HT, Cosgrove D, Fleming A, et al. Nomenclature for members of the expansin superfamily of genes proteins. Plant Molecular Biology. 2004;55:311–314. doi: 10.1007/s11103-004-0158-6. [DOI] [PubMed] [Google Scholar]
- Kumar S, Tamura K, Nei M. MEGA3: integrated software for molecular evolutionary genetics analysis and sequence alignment. Brief Bioinformatics. 2004;5:150–163. doi: 10.1093/bib/5.2.150. [DOI] [PubMed] [Google Scholar]
- Lee DK, Ahn JH, Song SK, Choi YD, Lee JS. Expression of an expansin gene is correlated with root elongation in soybean. Plant Physiology. 2003;131:985–997. doi: 10.1104/pp.009902. [DOI] [PMC free article] [PubMed] [Google Scholar]
- Lee Y, Kende H. Expression of beta-expansins is correlated with internodal elongation in deepwater rice. Plant Physiology. 2001;127:645–654. [PMC free article] [PubMed] [Google Scholar]
- Lee Y, Choi D, Kende H. Expansins: ever-expanding numbers and functions. Current Opinions in Plant Biology. 2001;4:527–532. doi: 10.1016/s1369-5266(00)00211-9. [DOI] [PubMed] [Google Scholar]
- Li Y, Darley CP, Ongaro V, Fleming A, Schipper O, Baldauf SL, et al. Plant expansins are a complex multigene family with an ancient evolutionary origin. Plant Physiology. 2002;128:854–864. doi: 10.1104/pp.010658. [DOI] [PMC free article] [PubMed] [Google Scholar]
- Li LC, Bedinger PA, Volk C, Jones AD, Cosgrove DJ. Purification characterization of four beta-expansins (Zea m 1 isoforms) from maize pollen. Plant Physiology. 2003;132:2073–2085. doi: 10.1104/pp.103.020024. [DOI] [PMC free article] [PubMed] [Google Scholar]
- Li Y, Jones L, McQueen-Mason S. Expansins cell growth. Current Opinions in Plant Biology. 2003;6:603–610. doi: 10.1016/j.pbi.2003.09.003. [DOI] [PubMed] [Google Scholar]
- Link BM, Cosgrove DJ. Acid-growth response and alpha-expansins in suspension cultures of bright yellow 2 tobacco. Plant Physiology. 1998;118:907–916. doi: 10.1104/pp.118.3.907. [DOI] [PMC free article] [PubMed] [Google Scholar]
- McQueen-Mason S, Durachko DM, Cosgrove DJ. Two endogenous proteins that induce cell wall extension in plants. The Plant Cell. 1992;4:1425–1433. doi: 10.1105/tpc.4.11.1425. [DOI] [PMC free article] [PubMed] [Google Scholar]
- Page RDM. TREEVIEW: an application to display phylogenetic trees on personal computers. Computer Applications in the Biosciences. 1996;12:357–358. doi: 10.1093/bioinformatics/12.4.357. [DOI] [PubMed] [Google Scholar]
- Popper ZA, Fry SC. Primary cell wall composition of bryophytes and charophytes. Annals of Botany. 2003;91:1–12. doi: 10.1093/aob/mcg013. [DOI] [PMC free article] [PubMed] [Google Scholar]
- Rose JK, Bennett AB. Cooperative disassembly of the cellulose-xyloglucan network of plant cell walls: parallels between cell expansion and fruit ripening. Trends in Plant Science. 1999;4:176–183. doi: 10.1016/s1360-1385(99)01405-3. [DOI] [PubMed] [Google Scholar]
- Rose JK, Cosgrove DJ, Albersheim P, Darvill AG, Bennett AB. Detection of expansin proteins and activity during tomato fruit ontogeny. Plant Physiology. 2000;123:1583–1592. doi: 10.1104/pp.123.4.1583. [DOI] [PMC free article] [PubMed] [Google Scholar]
- Sampedro J, Cosgrove DJ. The expansin superfamily. Genome Biology. 2005;6:242. doi: 10.1186/gb-2005-6-12-242. [DOI] [PMC free article] [PubMed] [Google Scholar]
- Sampedro J, Lee Y, Carey RE, dePamphilis C, Cosgrove DJ. Use of genomic history to improve phylogeny and understanding of births and deaths in a gene family. The Plant Journal. 2005;44:409–419. doi: 10.1111/j.1365-313X.2005.02540.x. [DOI] [PubMed] [Google Scholar]
- Sampedro J, Carey RE, Cosgrove DJ. Genome histories clarify evolution of the expansin superfamily: new insights from the poplar genome and pine ESTs. Journal of Plant Research. 2006;119:11–21. doi: 10.1007/s10265-005-0253-z. [DOI] [PubMed] [Google Scholar]
- Schaefer DG. A new moss genetics: targeted mutagenesis in Physcomitrella patens. Annual Reviews in Plant Biology. 2002;53:477–501. doi: 10.1146/annurev.arplant.53.100301.135202. [DOI] [PubMed] [Google Scholar]
- Schipper O, Schaefer D, Reski R, Flemin A. Expansins in the bryophyte Physcomitrella patens. Plant Molecular Biology. 2002;50:789–802. doi: 10.1023/a:1019907207433. [DOI] [PubMed] [Google Scholar]
- Schneider TD, Stephens RM. Sequence logos: a new way to display consensus sequences. Nucleic Acids Research. 1990;18:6097–6100. doi: 10.1093/nar/18.20.6097. [DOI] [PMC free article] [PubMed] [Google Scholar]
- Schween G, Hohe A, Koprivova A, Reski R. Effects of nutrients, cell density and culture techniques on protoplast regeneration and early protonema development in a moss, Physcomitrella patens. Journal of Plant Physiology. 2003;160:209–212. doi: 10.1078/0176-1617-00855. [DOI] [PubMed] [Google Scholar]
- Shcherban TY, Shi J. Durachko DM, Guiltinan MJ, McQueen-Mason SJ, Shieh M, et al. Molecular cloning sequence analysis of expansins – a highly conserved, multigene family of proteins that mediate cell wall extension in plants. Proceedings of the National Academy of Sciences of the USA. 1995;92:9245–9249. doi: 10.1073/pnas.92.20.9245. [DOI] [PMC free article] [PubMed] [Google Scholar]
- Swofford DL. PAUP*. Phylogenetic analysis using parsimony (*and other methods). Sunderland, MA: Sinaur Associates. 2002 [Google Scholar]
- Yennawar NH, Li LC, Dudzinski DM, Tabuchi A, Cosgrove DJ. Crystal structure and activities of EXPB1 (Zea m 1), a beta-expansin and group-1 pollen allergen from maize. Proceedings of the National Academy of Sciences of the USA. 2006;103:14664–14671. doi: 10.1073/pnas.0605979103. [DOI] [PMC free article] [PubMed] [Google Scholar]
- Zenoni S, Reale L, Tornielli GB, Lanfaloni L, Porceddu A, Ferrarini A, et al. Downregulation of the Petunia hybrida alpha-expansin gene PhEXP1 reduces the amount of crystalline cellulose in cell walls leads to phenotypic changes in petal limbs. The Plant Cell. 2004;16:295–308. doi: 10.1105/tpc.018705. [DOI] [PMC free article] [PubMed] [Google Scholar]
Associated Data
This section collects any data citations, data availability statements, or supplementary materials included in this article.