Abstract
Background and Aims
Salinity is a widespread soil problem limiting productivity of cereal crops worldwide. Rice is particularly sensitive to salt stress during the seedling stage, with consequent poor crop establishment, as well as during reproduction where salinity can severely disrupt grain formation and yield. Tolerance at the seedling stage is weakly associated with tolerance during reproduction. Physiological responses to salinity were evaluated for contrasting genotypes, during the seedling and reproductive stages.
Methods
Three rice genotypes differing in their tolerance of salinity were evaluated in a set of greenhouse experiments under salt stress during both seedling stage and reproduction.
Key Results
Photosynthetic CO2 fixation, stomatal conductance (gs) and transpiration decreased substantially because of salt stress, but with greater reduction in the sensitive cultivar IR29. The tolerant lines IR651 and IR632 had more responsive stomata that tended to close faster during the first few hours of stress, followed by partial recovery after a brief period of acclimation. However, in the sensitive line, gs continued to decrease for longer duration and with no recovery afterward. Chlorophyll fluorescence measurements revealed that non-photochemical quenching increased, whereas the electron transport rate decreased under salt stress. Salt-tolerant cultivars exhibited much lower lipid peroxidation, maintained elevated levels of reduced ascorbic acid and showed increased activities of the enzymes involved in the reactive oxygen scavenging system during both developmental stages.
Conclusions
Upregulation of the anti-oxidant system appears to play a role in salt tolerance of rice, with tolerant genotypes also maintaining relatively higher photosynthetic function; during both the vegetative and reproductive stages.
Key words: Chlorophyll fluorescence, photosynthesis, reactive oxygen species, rice, Oryza sativa, salinity
INTRODUCTION
Salt stress limits rice (Oryza sativa) production in vast areas worldwide, and the problem is ever increasing because of irrational human acts, causing secondary salinization, as well as because of global warming, with the consequent rise in sea level and increase in storm incidences, particularly in coastal areas (Peltier and Tushingham, 1989; Pessarakli and Szabolcs, 1999; Wassmannn et al., 2004). Salinity imposes both ionic and osmotic stresses on plants (reviewed by Munns et al., 2006), and salt exclusion from photosynthetic tissues was considered an important mechanism associated with salt tolerance in monocots (Yeo et al., 1990; Moradi et al., 2003, Davenport et al., 2005). Stomatal closure is often a rapid initial response to salt stress. In wheat, James et al. (2002) showed that a stress-induced reduction in stomatal conductance was seen when the leaf emerged, but after some time there was a further decline, probably caused by salt toxicity, as the concentrations of Na+ and Cl− in the leaf tissue increase further. Chen and Gallie (2004) suggested that the redox state of ascorbate might play an important role in stomatal function through regulating H2O2 concentration as a signal involved in guard cell movement. Beside the effects of osmotic stress, apparently other factors could also be implicated in regulating stomatal function under salt stress (Zhang et al., 2006).
Dionisio-Sese and Tobita (2000) reported that the net photosynthetic rate, measured in terms of CO2 assimilation of the youngest fully expanded leaf of four rice varieties, declined with increasing level of salinity stress. They suggested that this might be due to a direct effect of salt on stomatal resistance via a reduction in guard cell turgor. Chlorophyll fluorescence is a rapid and non-intrusive tool used to screen varieties for salinity tolerance (Maxwell and Johnson, 2000). In Sorghum, Netondo et al. (2004) reported that maximum quantum yield of photosystem II (PSII; Fv/Fm), photochemical quenching coefficient (qP) and electron transport rate (ETR) significantly decreased, but non-photochemical quenching (qN) increased substantially under saline conditions. However, for rice cultivars contrasting in salinity tolerance, Fv/Fm was almost not affected by salt stress, whereas qN increased in sensitive cultivars with increasing salt stress (Dionisio-Sese and Tobita, 2000). Sensitivity to salt stress in cereals might thus be associated with both reduction in PSII photochemical efficiency and enhanced qN to dissipate excess energy.
Several factors associated with salinity stress can lead to an increase in reactive oxygen species (ROS; Asada, 1999). Free radical scavenging systems such as superoxide dismutase (SOD; EC 1·15·1·1) can be a critical component of salinity tolerance (Bohnert and Jensen, 1996) because of their protection of chloroplast function under high salinity (Orcutt and Nilsen, 2000). Salinity causes a significant decrease in SOD activity in rice seedlings, with noticeable differences between varieties (Dionisio-Sese and Tobita, 1998). The predominant peroxidase enzyme is ascorbate peroxidase (APX; EC 1·11·1·11), which catalyses oxidation of ascorbate (AsA) by H2O2, generating dehydroascorbate radicals (Hideg, 1999). In chloroplast, the enzyme primarily occurs in stroma thylakoid, where superoxide and H2O2 are produced (Asada, 2006). Lin and Kao (2000) reported a significant increase in APX activity in salt-treated rice seedlings and concluded that this could be due to the effect of AsA in controlling H2O2 under stress. The functioning of this enzyme is supported by a large (10–300 mm) AsA pool, which constitutes the largest pool of antioxidants found in plants (Chen and Gallie, 2004). However, this pool would be exhausted within a few minutes without the high-capacity regenerating system consisting of the monodehydroascorbate reductase (EC 1·6·5·4) and dehydroascorbate reductase (EC 1·8·5·1) enzymes (Pignocchi et al., 2003). AsA is an important primary metabolite in plants that functions as an antioxidant, an enzyme cofactor and a cell signalling modulator in a wide array of crucial physiological processes, including biosynthesis of the cell wall, secondary metabolites and phytohormones, stress tolerance, photoprotection, cell division and growth (Wolucka et al., 2005). Besides, it is also important for the regeneration of membrane-bound antioxidants (Hideg, 1999). Glutathione is a water-soluble tripeptide containing a sulfhydryl group, and has several important roles (Hideg, 1999; Asada, 2006). Reduced glutathione is the substrate for dehydroascorbate reductase in the glutathione–ascorbate cycle. The oxidized product is re-reduced by glutathione reductase (GR; EC 1·6·4·2), a flavoprotein, using NADPH as an electron acceptor. Glutathione is found in chloroplasts in 1–5 mm concentration and, under physiological conditions, the ratio of the reduced and oxidized forms is kept high, around 10 : 1 (Asada, 1999). Reduced glutathione scavenges hydroxyl radicals and singlet oxygen and may protect enzyme thiol groups (Hideg, 1999). Maintenance and regeneration of a high concentration of reduced AsA and glutathione, as well as the upregulation of the activity of enzymes involved in their regeneration, could help in reducing harmful effects of ROS generated during salt stress.
Rice is a salt-sensitive crop, yet it is the only cereal that can grow fairly well in salt-affected soils because of its ability to grow in standing water that can help leach salts from top soils to a level low enough for subsequent crops (Bhumbla and Abrol, 1978), and also because it thrives during the rainy season in coastal saline areas where other crops cannot survive recurrent flooding. Rice is relatively tolerant of salt stress during germination, active tillering and towards maturity, and is sensitive during the early seedling and reproductive stages (Pearson and Bernstein, 1959; Zheng et al., 2001). Salinity tolerance at the seedling and reproductive stages is only weakly associated (Moradi et al., 2003); hence, the discovery of contributing traits at both stages is essential for developing resilient salt-tolerant cultivars. The physiological bases of salt tolerance during the early seedling stage are fairly established, key traits include salt exclusion, compartmentation of ions in structural and older tissues, vigorous growth and higher tissue tolerance (Yeo and Flowers, 1986; Yeo et al, 1990; Peng and Ismail, 2004); nonetheless, little is known about the important mechanisms associated with tolerance during reproduction. In this study, the effects of salinity on some physiological traits such as photosynthesis, chlorophyll fluorescence and the activity of enzymes involved in ROS scavenging systems were investigated during the seedling stage and the reproductive stage.
MATERIALS AND METHODS
Three rice cultivars contrasting in tolerance of salt stress during the vegetative and reproductive stages (Moradi et al., 2003) were selected for this investigation. IR65192-4B-10-3 and IR63295-AC209-7 (abbreviated as IR651 and IR632, respectively, henceforth) are breeding lines tolerant of salt stress at both the seedling and reproductive stages, but with the former having a higher level of tolerance at the seedling stage. IR29 is a cultivar sensitive to salt stress during both stages and is commonly used as a sensitive check in breeding nurseries. Two experiments were conducted, with salt stress imposed during the seedling stage in the first experiment and during reproduction in the second experiment. The first experiment was repeated once with some modifications.
Experiment Ia
This experiment was conducted in a growth cabinet with light intensity of about 700 µmol m−2 s−1 and 12 h duration, 70 % relative humidity and 29/22 °C day/night temperature. Pre-germinated seeds of each cultivar were sown in holes made on Styrofoam sheets with a nylon net bottom (Gregorio et al., 1997). Two seeds were sown per hole, with 50 holes per entry. The sheets were first floated on distilled water in 11 L plastic trays for 3 d, after which a nutrient solution (Yoshida et al., 1976) was used until the plants were 21 d old. A control treatment (nutrient solution) and two levels of salt stress were introduced thereafter, with the latter corresponding to electrical conductivities (ECs) of 6 and 12 dS m−1 using NaCl, and with seedlings harvested 7 d after the start of the salt treatments for subsequent measurements. A randomized complete block design was used with three replications. The culture solution was renewed once with the pH adjusted daily to 5·5 by adding either NaOH or HCl.
Experiment Ib
In the repeat experiment, only two salinity levels were used, control and an EC of 12 dS m−1, and the duration of the treatment was extended to 14 d with harvesting at 35 d after sowing. Nutrient solution was renewed once every 5 d. All other conditions were the same as those in experiment Ia.
Experiment II
This experiment was conducted to evaluate the effects of salt stress starting at about 10–7 d before panicle initiation and continuing through harvest. The experiment was carried out in a greenhouse with air temperature in the range of about 25 to 35 °C and light intensity in the range of about 600–1000 µmol m−2 s−2, and was conducted using a randomized complete block design with three replications and with 12 pots per cultivar in each replication. Pre-germinated seeds were sown in 1 L perforated plastic pots filled with fertilized (50 N, 25 P and 25 K mg kg−1) Maahas clay soil (43 % clay, 44 % silt and 13 % sand; pH 5·9; Tirol-Padre and Ladha, 2004) and were kept in concrete tanks filled with tap water. The level of water was maintained at 3 cm below the soil surface for 2 d. Five seeds of each of the three cultivars were sown in each pot, thinned to one seedling 2 weeks later, and the water level was raised to about 1–2 cm above the soil surface. When the seedlings were 28 d old, water was siphoned out and the pots were drained for 12 h, then flooded with tap water (control) or with a saline solution with EC of 3 dS m−1 using NaCl for 3 d, then increased progressively to 4 and 5 dS m−1 at 3 d intervals, and finally stabilized at 6 ± 0·3 dS m−1 through harvesting. The pots were kept flooded thereafter for the duration of the experiment, and the EC of the water was monitored daily and adjusted when necessary using NaCl and tap water. All parameters were measured on flag leaves of the first four tillers that were tagged 25 d after sowing.
Sodium and potassium measurements
The third leaf below the youngest fully expanded leaf in experiment Ib and leaf number 3 below the flag leaf in experiment II were harvested for the determination of Na+ and K+ concentrations. Harvesting was performed 14 d after the start of salt stress treatment in experiment Ib and at maturity (61, 65 and 66 d from the start of salt stress treatment for IR632, IR651 and IR29, respectively) in experiment II. Dried samples were ground to a fine powder and about 0·1 g was transferred to a test tube containing 10 mL of 0·1 n acetic acid, and heated in a water bath at 80 °C for 2 h. The extracted tissue was cooled at room temperature and left overnight, and then filtered using Whitman filter paper number 40. Sodium and potassium concentrations were then determined using an atomic absorption spectrometer (Perkins Elmer, Norwalk, CT, USA).
Gas exchange measurements
During the vegetative stage, gas exchange measurements were conducted on the youngest fully expanded leaf at 7 d after treatment in experiment Ia, and at 0, 4, 72, 168, 240 and 312 h after treatment in experiment Ib. Net CO2 assimilation, stomatal conductance, internal CO2 concentration (Ci) and transpiration rate were assessed on intact leaves using the LiCor 6400 gas exchange system (Lincoln, NE, USA) and four sub-measurements were made on four different plants selected randomly from the 100 seedlings of each cultivar grown in each replication. During the reproductive stage in experiment II, the same parameters were measured at flowering (65–70 d after sowing) on flag leaves of the tagged tillers after 1–2 h of acclimation in a growth cabinet, under a light intensity of about 1000 µmol m−2 s−1, relative humidity of 70 % and 29 °C to ensure measurements under stable conditions.
Chlorophyll fluorescence measurements
Fluorescence yield determinants were measured on the same leaves used for gas exchange measurements, as described by Dionisio-Sese and Tobita (2000). Chlorophyll fluorescence in dark- and light-adapted leaves was excited, and measured using a portable chlorophyll fluorometer (PAM-2000 WALZ, Germany). Maximum quantum yield (Fv/Fm) was determined after a 30 min dark acclimation of selected leaves using a dark leaf clip. Actual quantum yield (ΔF/Fm or ΦPSII) was measured on the youngest fully expanded leaves that were illuminated for 30 min in the growth chamber with actinic light after dark adaptation, with four measurements conducted per replication, and was calculated as ΦPSII = (F′m – Ft)/F′m, where F′m and Ft refer to maximum and steady-state fluorescence in the light, respectively. ETR was calculated as ETR = ΦPSII × PFDa × 0·5, where PFDa is absorbed light in μmol photon m−2 s−1 and 0·5 is a factor that accounts for the partitioning of energy between PSII and PSI (Maxwell and Johnson, 2000). From the fluorescence data obtained with the same dark-adapted and steady-state-illuminated leaves, qN was calculated as qN = 1 − (F′m − F′0)/(Fm − F0). At the flowering stage, fluorescence parameters were measured on the same flag leaves used for photosynthetic gas exchange measurements using the same procedure described above.
Preparation of extracts for assays of ROS enzymes
The youngest fully expanded leaf (experiment Ia) or the flag leaf (experiment II) were harvest, respectively, at 7 and 35 d after the start of the treatment, snap-frozen in liquid nitrogen and then kept at −80 °C until measurements. Leaves (0·5 g) were homogenized in 100 mm potassium phosphate buffer (pH 7·8) containing 0·1 mm EDTA, 1 % (w/v) PVP, 0·5 % (v/v) Triton X-100, 5 mm ascorbate and 1 mm EDTA. The homogenate was centrifuged at 10 000 g for 20 min at 4 °C. The supernatant was collected for measurements of antioxidant enzyme activities.
Superoxide dismutase assay
SOD activity was determined following the method described by Asada et al. (1973). An aliquot of 1 mL of the crude enzyme solution in a cellulose tube was dialysed in 1 L of potassium phosphate buffer for 2 h and then 1 L of the same buffer for 18 h at 4 °C. The sample was centrifuged at 10 000 g for 20 min and the supernatant was added to the reaction mixture at 30 °C. The reaction mixture consisted of 50 mm potassium phosphate buffer (pH 7·8), 10 mm cytochrome c and 0·1 mm xanthine and xanthine oxidase. The reaction was started by the addition of xanthine and monitored at 550 nm using a UV spectrophotometer.
Ascorbate peroxidase assay
APX activity was determined following the procedure of Nakano and Asada (1981) with slight modifications. The crude extract described above was used together with a reaction solution containing 25 mm potassium phosphate buffer, 0·25 mm ascorbate, 0·1 mm EDTA and 0·1 mm hydrogen peroxide. The oxidation of ascorbate was monitored at 290 nm with a UV spectrophotometer.
Glutathione reductase assay
The reaction mixture for the determination of GR activity consisted of 25 mm potassium phosphate buffer, 0·12 mm NADPH, 0·5 mm reduced glutathione and the crude enzyme solution, according to Foyer and Halliwell (1986). The oxidation of glutathione was determined at 340 nm with a UV spectrophotometer.
Ascorbate concentration
The amount of AsA in leaf samples was measured based on the method of Shigeoka et al. (1979) using sub-samples from the same leaf tissue used for the determination of ROS enzyme activities. About 0·5 g of fresh leaf tissue was frozen in liquid nitrogen and ground with a mortar and pestle. Ground tissue was mixed with 10 mL of 10 % trichloroacetic acid (TCA), and the supernatant obtained after centrifugation at 10 000 g for 20 min at 4 °C was analysed for total and reduced ascorbic acid.
Malondialdehyde (MDA) determination
The amount of MDA was measured according to the method of Dionisio-Sese and Tobita (1998) using sub-samples from the same leaves used for measuring ROS enzyme activities and AsA. A pre-weighed (0·5 g) fresh leaf sample was ground to a fine powder in liquid nitrogen. The ground powder was homogenized in 5 mL of ice-cold 50 mm potassium phosphate buffer (pH 7·0) and the extract was centrifuged at 4 °C for 30 min at 20 000 g. A 1 mL aliquot of the extract was then mixed with the same volume of a 0·5 % (w/v) thiobarbituric acid solution containing 20 % (w/v) trichloroacetic acid. The mixture was heated at 95 °C for 30 min and the reaction was stopped quickly by placing the sample in an ice bath. The cooled mixture was centrifuged at 10 000 g for 10 min, and the absorbance of the supernatant was determined at 532 and 600 nm. After subtracting the non-specific absorbance at 600 nm, the MDA concentration was determined using the extinction coefficient of 155 mm−1 cm−1.
Proline measurements
Fresh flag leaf tissue (0·5 g) was ground in liquid nitrogen and then extracted in 20 mL of hot water for 30 min with moderate shaking. The homogenate was centrifuged at 5000 g for 10 min. The proline concentration was quantified using the ninhydrin acid reagent method as described by Bates et al. (1973) using l-proline as a standard.
Statistical analysis
Statistical analysis was performed for each parameter studied based on a randomized complete block design model with three replications using SAS software version 6·1. Associations among characters were examined by simple correlation analysis.
RESULTS
In experiment Ia, no significant differences in biomass production were observed but with significant differences in other physiological traits. This was probably because the seedlings were subjected to salt stress only for 7 d. However, in experiment Ib conducted during the seedling stage as well as in experiment II during the reproductive stage, clear differences in aboveground biomass production (Table 1) and salt uptake (Table 2) were observed, both between genotypes and because of salt stress. On average, salinity reduced total seedling biomass by about 26 % and total plant biomass at maturity by about 31 %. Total biomass of seedlings of the two tolerant lines (IR651 and IR632) decreased by 18 and 15 %, respectively, whereas that of IR29 decreased by 46 % under salt stress. Salinity imposed during the reproductive stage decreased shoot biomass of the two tolerant lines to a similar extent to that observed during the seedling stage (17 and 16 % for IR651 and IR632, respectively), but substantially reduced total biomass of the sensitive cultivar by about 73 % (Table 1). The sodium concentration in leaves of the sensitive genotype IR29 was significantly higher and the K+/Na+ ratio was lower under salt stress during both seedling and reproductive stages (Table 2). Salt stress also resulted in greater reduction in grain yield (per plant) of the sensitive genotype IR29, where it decreased by about 93 %, but only by 25 and 18 % for IR632 and IR651, respectively (data not shown).
Table 1.
Shoot dry weight of three rice cultivars under control and salt stress conditions measured during the seedling stage at 14 d after the start of salt stress in experiment Ib and at the reproductive stage at harvest
| Seedling stage (g seedling−1) | Reproductive stage (g plant−1) | |||
|---|---|---|---|---|
| Cultivar | Control | 12 dS m−1 | Control | 6 dS m−1 |
| IR632 | 0·459 | 0·389 | 35·3 | 29·2 |
| IR651 | 0·468 | 0·385 | 39·0 | 32·8 |
| IR29 | 0·451 | 0·243 | 26·4 | 7·1 |
| Mean | 0·459 | 0·339 | 33·6 | 23·0 |
| Significance | ||||
| Salinity (S) | ** | *** | ||
| Cultivar | *** | *** | ||
| S × C | ** | *** | ||
| LSD0·05 | ||||
| Salinity (S) | 0·014 | 3·9 | ||
| Cultivar (S) | 0·019 | 7·1 | ||
| S × C | 0·013 | 6·5 | ||
| CV % | 8 | 8·1 | ||
Data are means of three replications with six and four sub-samples per replication, respectively, at the vegetative and reproductive stages.
**, *** significant at P < 0·01 and 0·001, respectively.
Table 2.
Na+ concentration and K+/Na+ ratio of three rice cultivars under control and salt stress conditions measured using the third leaf below the fully expanded leaf, 14 d after the start of salt stress in experiment Ib, and using the third leaf below the flag leaf at harvest in experiment II
| Seedling stage | Reproductive stage | |||||||
|---|---|---|---|---|---|---|---|---|
| Na+ concentration (mmol kg−1 d. wt) | K+/Na+ ratio | Na+ concentration (mmol kg−1 d. wt) | K+/Na+ ratio | |||||
| Cultivars | Control | EC12 | Control | EC12 | Control | EC6 | Control | EC6 |
| IR632 | 35 | 427 | 21·0 | 1·40 | 50 | 593 | 16·20 | 1·56 |
| IR651 | 35 | 647 | 22·0 | 1·27 | 66 | 427 | 7·61 | 0·89 |
| IR29 | 49 | 897 | 19·2 | 0·97 | 101 | 640 | 6·56 | 0·64 |
| Mean | 40 | 657 | 20·7 | 1·21 | 73 | 553 | 10·13 | 1·03 |
| Significance | ||||||||
| Salinity (S) | *** | *** | *** | *** | ||||
| Cultivar (C) | ** | * | *** | ** | ||||
| S × C | *** | *** | *** | *** | ||||
| LSD0·05 | ||||||||
| Salinity (S) | 2·24 | 0·032 | 2·92 | 0·022 | ||||
| Cultivar (C) | 3·52 | 0·052 | 4·33 | 0·053 | ||||
| S × C | 1·55 | 0·071 | 3·43 | 0·076 | ||||
| CV | 6·7 | 6·1 | 5·1 | 5·3 | ||||
Data are means of three replications with six and four sub-samples per replication, respectively, at the seedling and reproductive stages.
*,** and *** significant at P < 0·05, 0·01 and 0·001, respectively.
Gas exchange responses to salt stress at the seedling stage
In experiment Ia, gas exchange parameters were measured 7 d after the imposition of salt stress. The photosynthetic CO2 fixation rate decreased by about 18 and 35 % when seedlings were subjected to salt stress of 6 and 12 dS m−1, respectively; however, reductions in stomatal conductance (gs) and transpiration rate were much greater, amounting to 58 and 74 % for gs, and 44 and 63 % for transpiration rate under the intermediate and high salt stress, respectively. Conversely, the reduction in Ci was much lower, amounting to only 9 and 15 %, respectively, at stress levels of 6 and 12 dS m−1. The salt-tolerant cultivar IR651 had the highest stomatal conductance under both 6 and 12 dS m−1, amounting to 0·677 and 0·409 mol H2O m−2 s−1, compared with 0·366 and 0·206 mol H2O m−2 s−1, respectively, for IR29.
Experiment Ib was designed to detect earlier responses to salt stress and to assess time course genotypic differences in these responses that might be associated with tolerance. In general, responses were relatively fast, with a reduction in all attributes measured occurring within 4 h of exposure to salt stress, and with mean photosynthetic CO2 fixation, stomatal conductance, transpiration and Ci decreased by 19, 72, 63 and 18 %, respectively (Fig. 1), though, a partial recovery was observed in Ci after 72 h of salt stress (Fig. 1C). Genotypic responses were also variable, with the salt-tolerant lines IR651 and IR632 showing a relatively greater decline in photosynthesis, gs and transpiration within the first 4 h following the start of the stress treatment; however, this response lasted for longer in the salt-sensitive cultivar IR29 (Fig. 1A, B, D). A partial recovery in photosynthesis and gs was observed in the tolerant cultivars after 72 h of stress, particularly in the most tolerant line (IR651), but with mostly no apparent recovery with time in IR29 and with a greater effect on photosynthetic CO2 fixation (Fig. 1A). By the end of the experiment, more than 50 % of the recently expanded leaves of IR29 seedlings (leaf 7) were greatly damaged, whereas the most tolerant lines (IR651 and IR632) still maintained active growth and new leaf formation, but older leaves were severely damaged in all three cultivars. The slower response of stomata of IR29 after the start of salt stress might have resulted in increased salt accumulation (Table 2). In contrast, the tolerant cultivars showed faster and earlier stomatal response, followed by partial resumption in gs and photosynthesis after a brief period of acclimation. Salinity also resulted in a significant reduction in Ci, but to a lesser extent than its effects on photosynthesis and gs, and with no effect due to genotype or interaction with salinity (Fig. 1C).
Fig. 1.
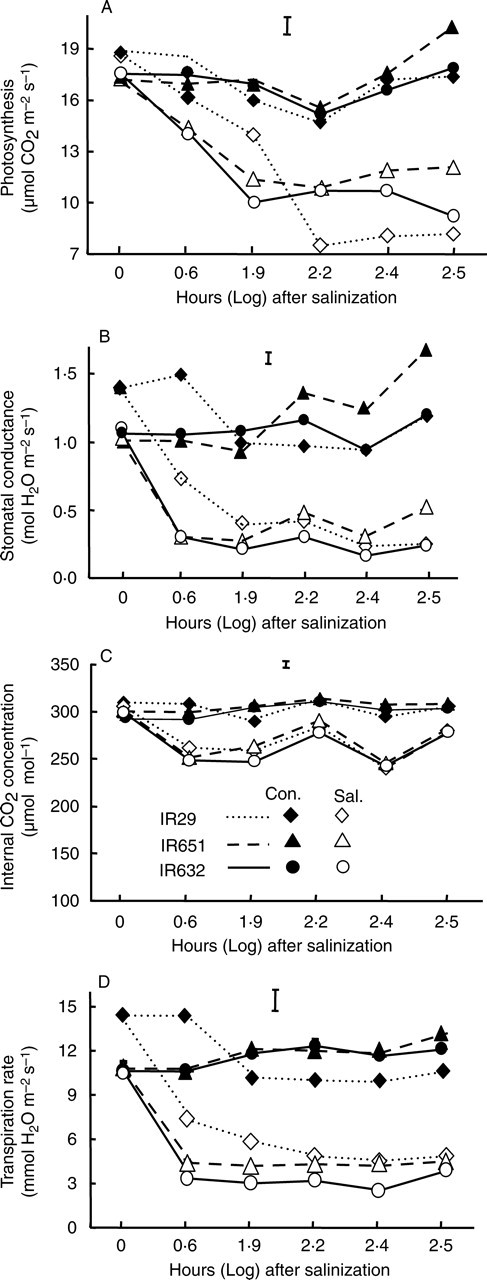
(A) Photosynthesis, (B) stomatal conductance, (C) internal CO2 (Ci) and (D) transpiration rate measured on the youngest fully expanded leaf of three rice cultivars during the seedling stage under control and salt stress of 12 dS m−1 in experiment Ib. The data are mean values of three replications with four measurements per replication, and vertical bars are LSD0·05. The log values on the x-axis correspond to 0, 4, 72, 168, 240 and 312 h after the start of salt stress treatment of 14-day-old seedlings. Con. = Control, Sal. = salt stress.
Gas exchange responses to salt stress during the reproductive stage
Photosynthesis, gs and transpiration rate measured using the flag leaf at flowering decreased by 40, 65 and 55 %, respectively, under salt stress, whereas internal CO2 decreased only by about 5 %. Genotypic differences as well as interactions with salinity were also significant for all attributes except for Ci. The tolerant line IR651 had the highest photosynthetic rate under salt stress, followed by IR632 (Fig. 2A). Both cultivars also showed the least reduction in photosynthesis due to salt stress (24 and 17 %, respectively, compared with 48 % in IR29). However, the higher photosynthesis of IR651 was also associated with higher gs under salinity (Fig. 2B). These results showed that responses in gas exchange parameters were similar to those observed during the seedling stage in the first experiment as well as after the initial acclimation period in the second experiment, with the tolerant lines having a higher photosynthetic gas exchange rate under salt stress than the sensitive cultivar.
Fig. 2.
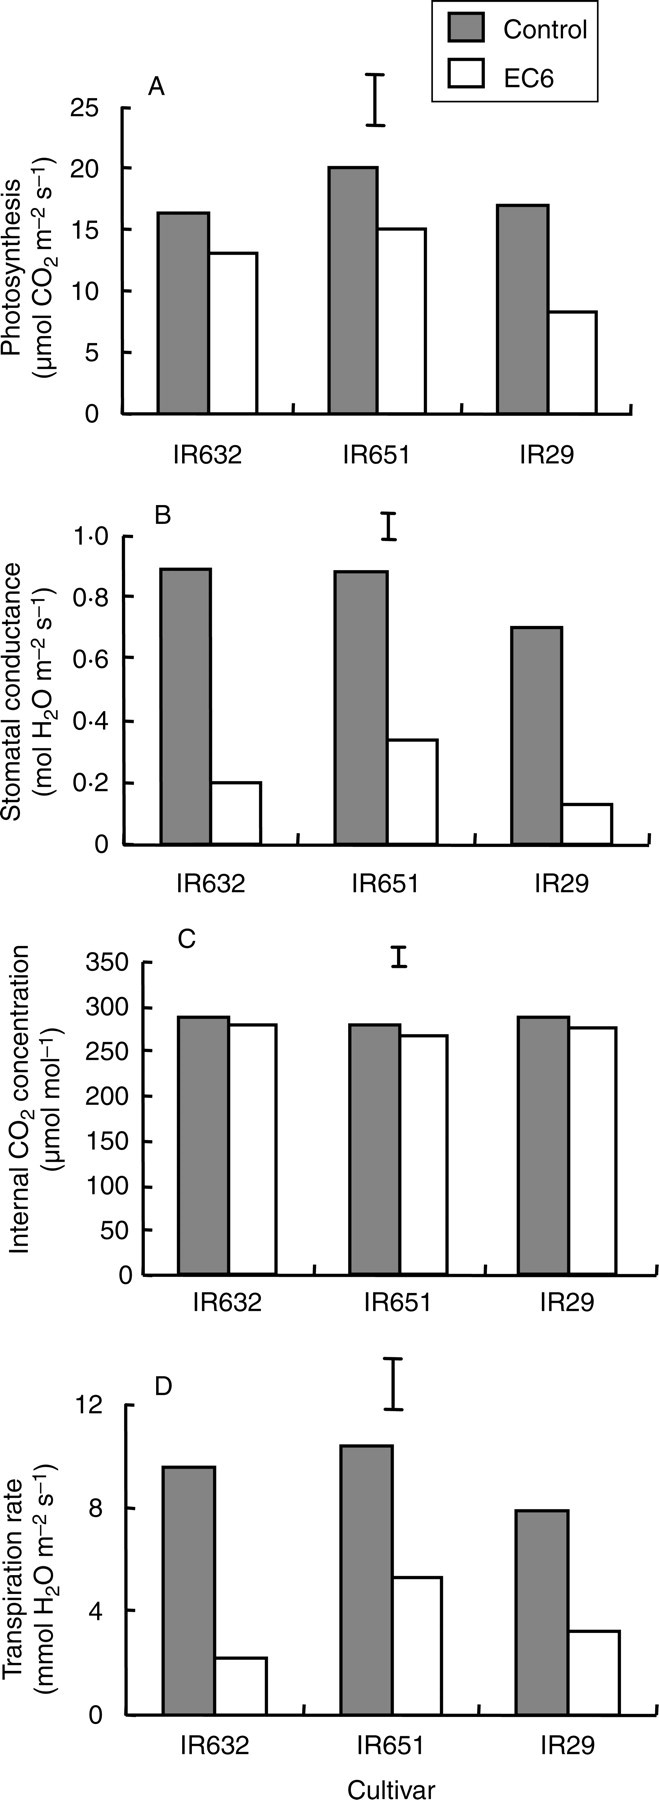
(A) Photosynthetic CO2 fixation, (B) stomatal conductance, (C) internal CO2 concentration and (D) transpiration rate of three rice cultivars measured using the flag leaf at flowering (35 d after the start of salt stress treatment) in experiment II. The data are mean values of three replications with four subsamples per replication. Vertical bars indicate LSD0·05.
Chlorophyll fluorescence during the vegetative and reproductive stages
During the seedling stage, measurements of chlorophyll fluorescence were conducted 7 d after salinization using leaf number 3 below the youngest fully expanded leaf (leaf number 4 from the bottom) of each cultivar in experiment Ia. No significant differences in actual quantum yield of photosynthesis (ΦPSII) were observed because of salinity (Fig. 3A), although the ETR decreased progressively and significantly with increasing salinity level (Fig. 3B). A similar but opposite trend was also observed with qN, which increased substantially with increasing salinity level (Fig. 3C), suggesting that photo-inhibition may have occurred. No significant differences were observed due to cultivars or their interaction with salinity in the three parameters studied in this experiment (data not shown).
Fig. 3.
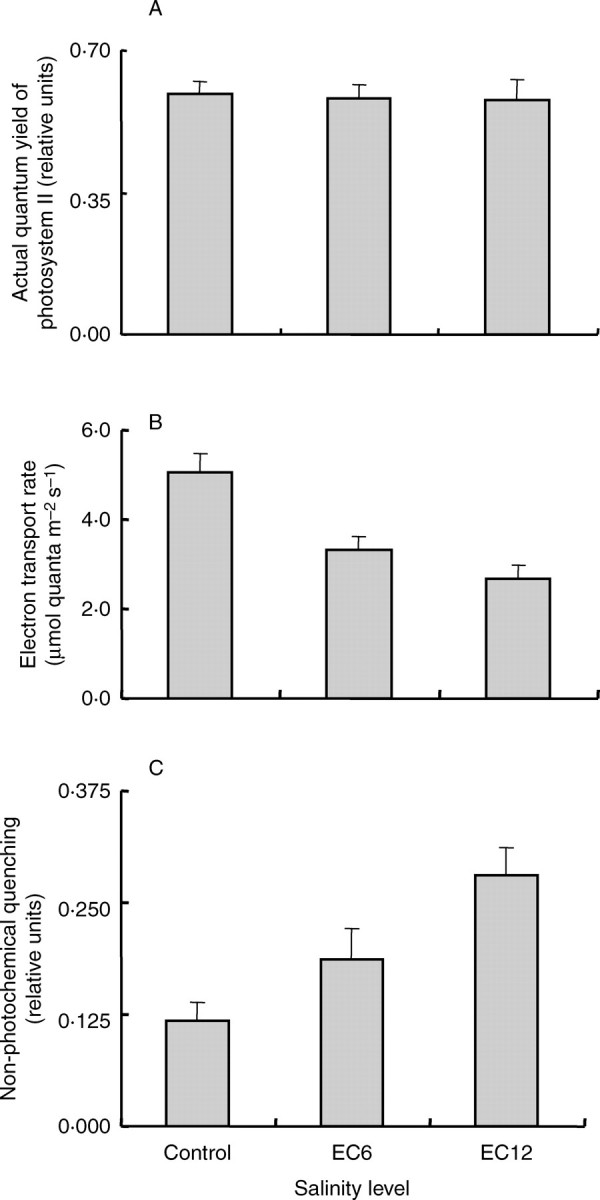
(A) Actual quantum yield of photosystem II (ΦPSII), (B) electron transport rate (ETR) and (C) non-photochemical quenching (qN) of chlorophyll fluorescence of the fully expanded youngest leaf under either control conditions, or 6 and 12 dS m−1 measured 7 d after the start of the salt stress treatment during the seedling stage in experiment Ia. Data are means of three cultivars each replicated three times, and vertical bars indicate SE.
At flowering, salt stress did not cause significant changes in average ΦPSII but significantly reduced the ETR and increased qN, as observed during the seedling stage. The ETR decreased under salinity by about 31 %, whereas qN increased dramatically by about 132 %. No reduction in ΦPSII was observed in the tolerant lines IR651 and IR632, while that of IR29 decreased by about 15 % under salt stress (Fig. 4A). The ETR of IR29 showed only a slight reduction (16 %) but a greater reduction was seen in IR632, where it decreased by about 33 % under salt stress (Fig. 4B). Conversely, qN increased substantially in all cultivars under salt stress (Fig. 4C). Salinity tolerance of IR651 therefore seems to be associated with a lower reduction in ΦPSII and substantial increase in qN, whereas that of IR632 is associated with a minimal reduction in ΦPSII but a moderate increase in qN under salt stress.
Fig. 4.
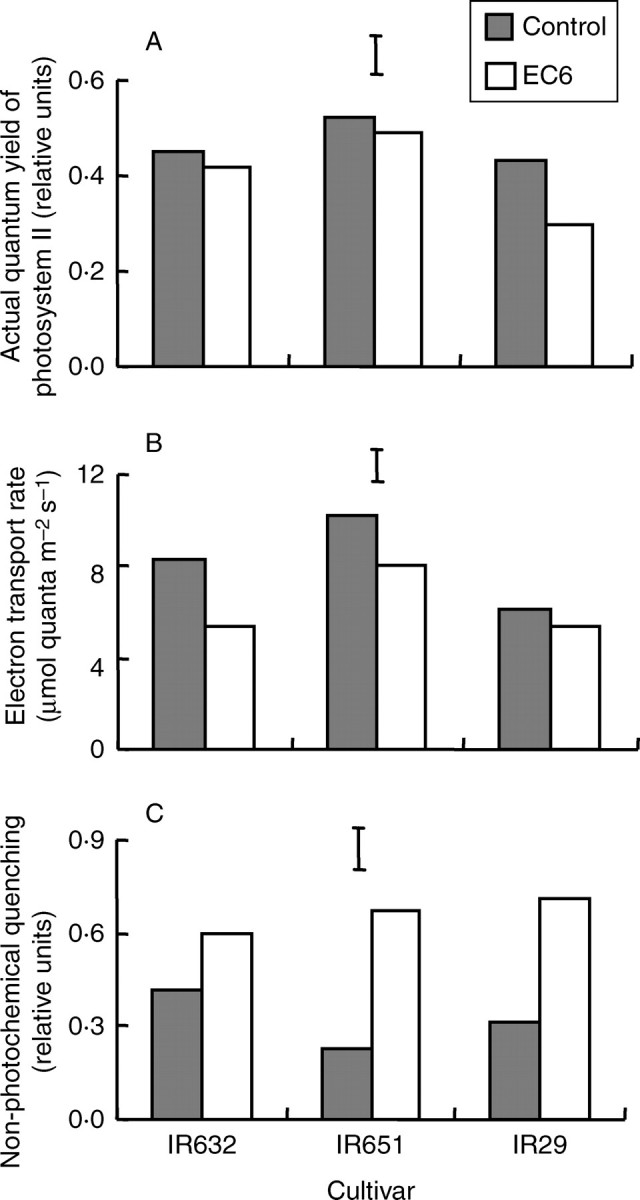
(A) Actual quantum yield of photosystem II (ΦPSII); (B) electron transport rate (ETR) and (C) non-photochemical quenching (qN) of chlorophyll fluorescence measured on the flag leaf of three rice cultivars at flowering (35 d after the start of salt stress treatment) in experiment II. The data are mean values of three replications and four sub-samples per replication. Vertical bars indicate LSD0·05.
Effects of salinity on reactive oxygen species and scavengers during the vegetative and reproductive stages
The level of MDA in seedlings increased with increasing salinity stress in IR29, but showed no significant change in the two tolerant lines (Fig. 5A). This indicated that the extent of lipid peroxidation in IR29 was significantly higher under salt stress. Total AsA decreased significantly only in IR29 under an EC of 12 dS m−1, but did not change in IR651 and IR632 (Fig. 5B). The two tolerant lines showed significantly higher levels of reduced AsA, either constitutively (IR632) or with increasing level of salt stress (IR651). Conversely, reduced AsA decreased with increasing salinity stress in the intolerant cultivar IR29 (Fig. 5C).
Fig. 5.
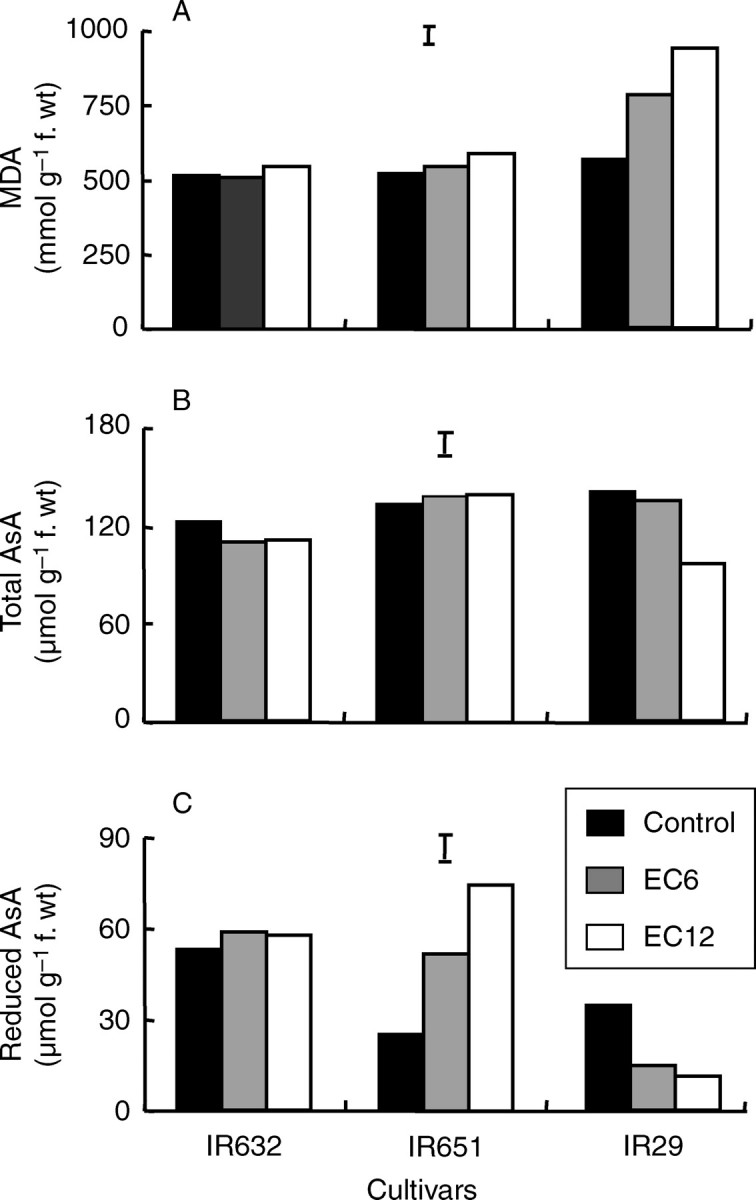
Concentration of (A) malondialdehyde (MDA), (B) total and (C) reduced ascorbate in the youngest fully expanded leaves of three rice cultivars under different levels of salt stress. Leaf samples were collected 7 d after the start of salt stress treatment during the seedling stage in experiment Ia. Vertical bars indicate LSD0·05.
Similar trends were observed at flowering, where the level of MDA increased dramatically under salt stress in IR29 (Fig. 6A). However, a slight increase in MDA was also apparent in the tolerant lines IR651 and IR632, and this could be attributed to the longer duration of salt stress in this experiment compared with that at the seedling stage. Salinity caused a slight, though insignificant, increase in total AsA in the tolerant cultivars but a slight reduction in IR29 (Fig. 6B). The two tolerant cultivars (IR651 and IR632) showed higher levels of reduced AsA, under control conditions, and it further increased slightly under salinity (Fig. 6C). However, reduced AsA was lower in the flag leaves of IR29 and decreased even more under salt stress (Fig. 6C).
Fig. 6.
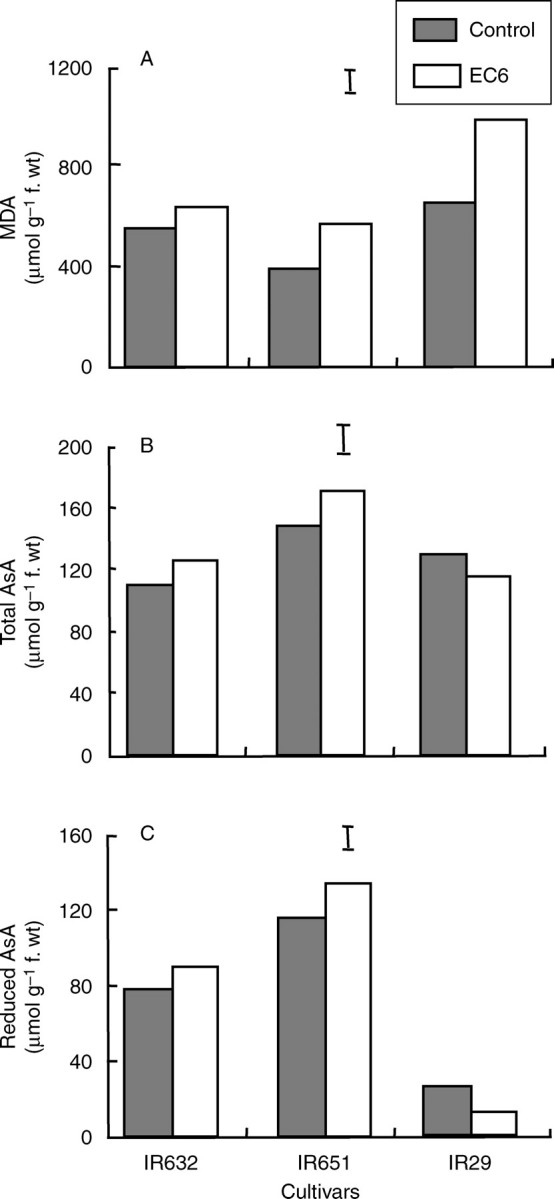
Concentration of (A) malondialdehyde (MDA), (B) total and (C) reduced ascorbate measured in the flag leaf of three rice cultivars at flowering (35 d after the start of salt stress treatment) in experiment II. The data are mean values of three replications with two sub-samples per replication, and vertical bars indicate LSD0·05.
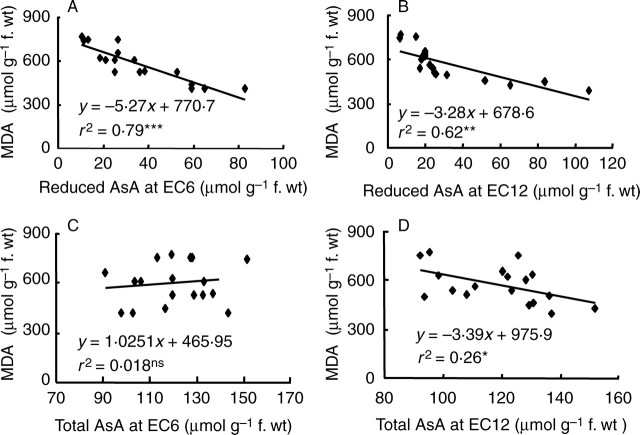
The MDA level measured in leaves of seedlings subjected to salt stress for 7 d correlated negatively with the level of reduced AsA (R2 = 0·79 and 0·62 at 6 and 12 dS m−1, respectively, Fig. 7A, B), but not with total AsA at an EC of 6 dS m−1 (R2 = 0·02, Fig. 7C) and showed a weak negative correlation at an EC of 12 dS m−1 (R2 = 0·26, Fig. 7D). A similar trend was also observed during flowering, when a stronger negative correlation of MDA with reduced AsA (R2 = 0·71) was observed than with total AsA (R2 = 0·21).
Fig. 7.
Correlations of MDA with reduced AsA at an EC of (A) 6 dS m−1 and (B) 12 dS m−1, and with total AsA at an EC of (C) 6 dS m−1 and (D) 12 dS m−1. Data are derived from Fig. 5. Measurements were made using the fully expanded youngest leaves at 7 d after the start of salt stress treatment in experiment Ia. *, **, *** significant at P < 0·05, 0·01 and 0·001, respectively. ns, non-significant.
The activity of SOD was constitutively high in IR651 and increased further under both salinity levels in IR632 and under 12 dS m−1 in IR651, but it decreased progressively with increasing salt stress in IR29 (Fig. 8A). APX activity was constitutively high in IR651 and IR29, and increased under salt stress in both IR632 and IR651. However, in the salt-intolerant line IR29, APX activity decreased significantly and progressively with increasing salt stress (Fig. 8B). GR activity increased in leaves of the tolerant lines with increasing salt stress, particularly in IR651, which showed a > 3·5-fold increase in activity under 12 dS m−1. However, GR activity in leaves of IR29 did not change under salt stress (Fig. 8C). When measured in the flag leaf at flowering, the responses of these three enzymes were essentially similar to those observed at the seedling stage (Fig. 9). Both SOD and APX were constitutively high in the most tolerant line, IR651, and were upregulated by salt stress in both tolerant lines, but downregulated in the sensitive cultivar (Fig. 9A, B). GR activity also increased in both tolerant lines under salinity, with the greatest increase of about 120 % in IR651, but showed no change in the sensitive cultivar (Fig. 9C).
Fig. 8.
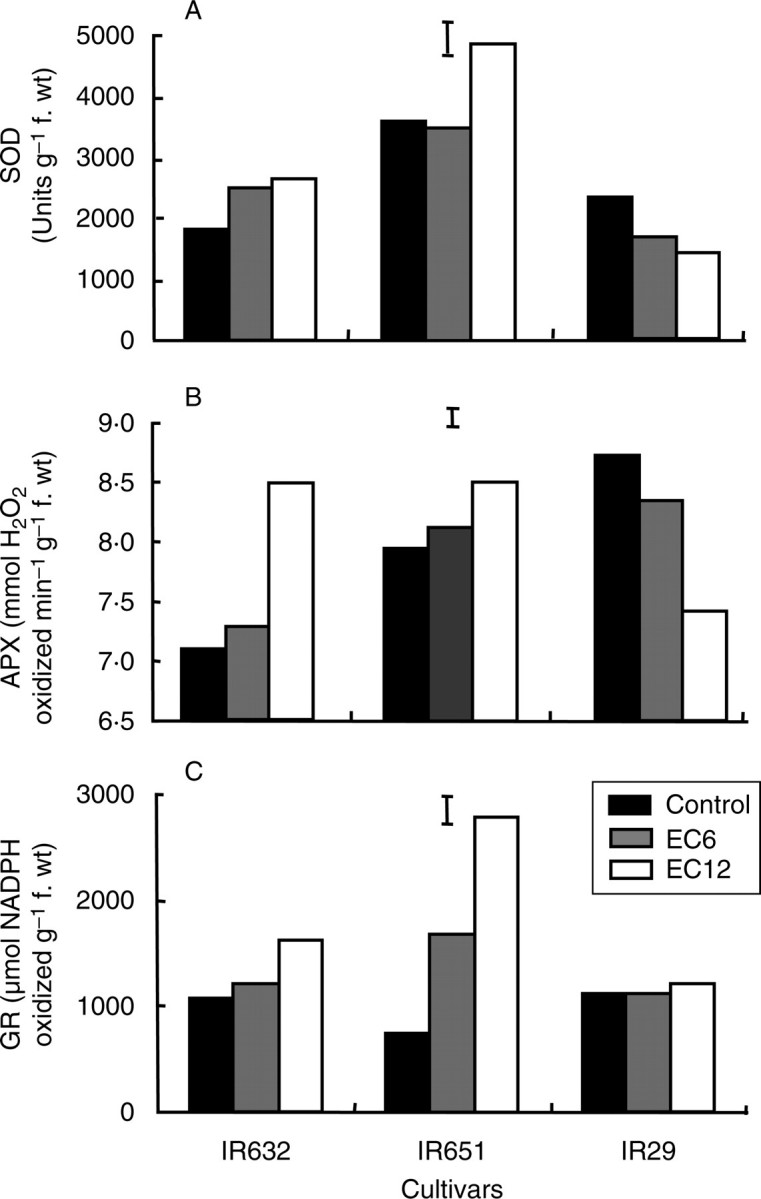
Activities of (A) superoxide dismutase, (B) ascorbate peroxidase and (C) glutathione reductase in leaves of three rice cultivars under control and salt stress measured 7 d after the start of stress treatment in experiment Ia. Measurements were made on the fully expanded youngest leaves, and vertical bars indicate LSD0·05.
Fig. 9.
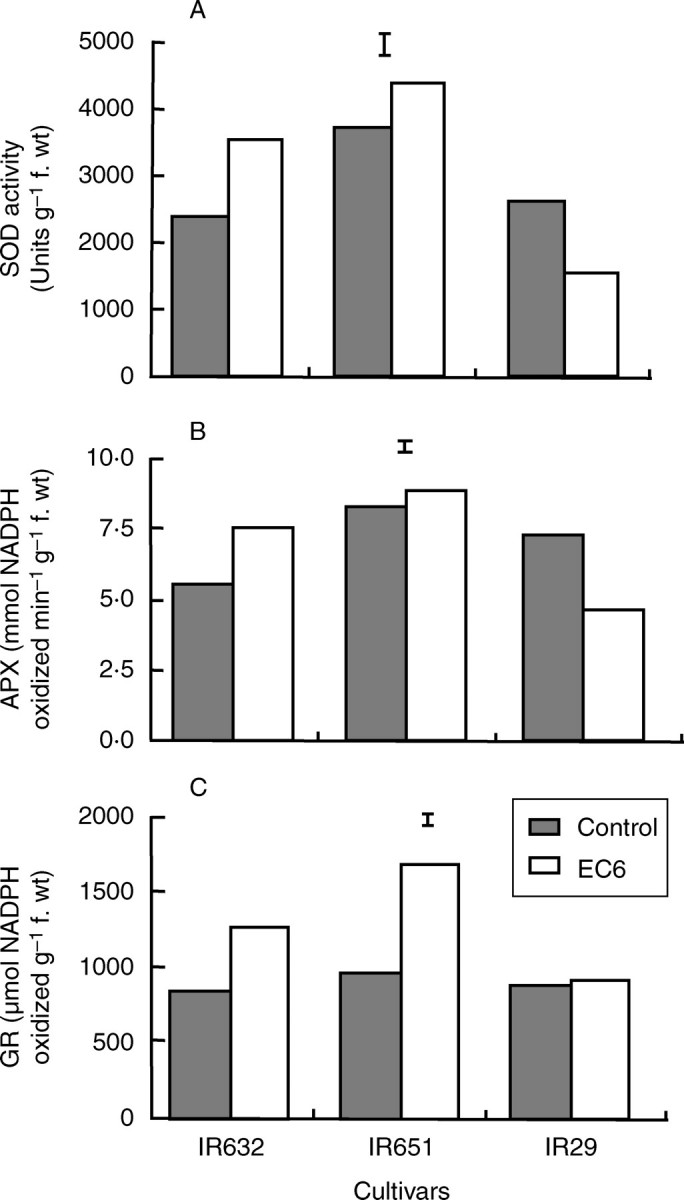
Activities of (A) superoxide dismutase, (B) ascorbate peroxidase and (C) glutathione reductase in three rice cultivars measured using the flag leaf tissue at flowering (35 d after the start of salt stress treatment) in experiment II. The data are mean values of three replications with three sub-samples per replication, and the vertical bars indicate LSD0·05.
Effect of salinity on proline accumulation
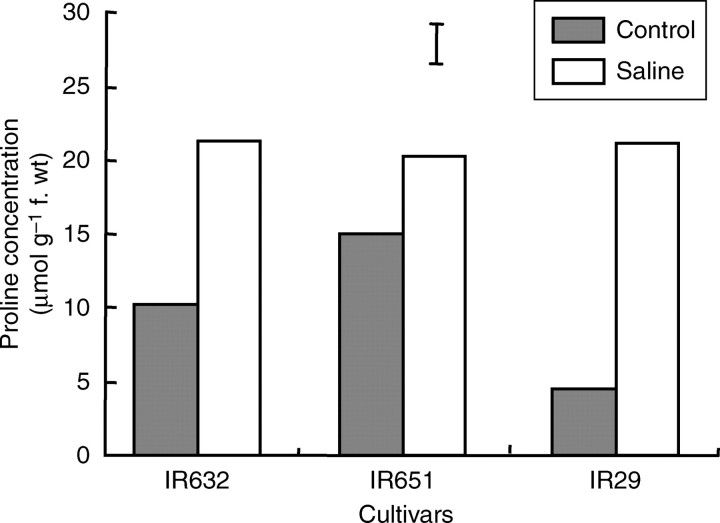
Proline concentration was measured using the flag leaf tissue at flowering to determine its association with salinity tolerance. Under control conditions, proline concentration was higher in the flag leaf of IR651 and was lowest in IR29. However, under salt stress, proline concentration increased significantly in all three lines. The highest percentage increase relative to that under control conditions was observed in IR29, in which proline concentration increased by about 369 %, and the lowest increase was observed in the most tolerant line (IR651), in which it increased by only 35 % under salinity stress (Fig. 10).
Fig. 10.
Proline concentration in the flag leaf of three rice cultivars at flowering (35 d after the start of salt stress treatment) in experiment II. Data are the mean values of three replications with four sub-samples per replication, and vertical bars indicate LSD0·05.
DISCUSSION
Salt stress significantly reduced the growth of the three rice genotypes during both the seedling and reproductive stage (Table 1). At the seedling stage, this effect was apparent only when seedlings were subjected to salt stress for about 2 weeks in experiment Ib, but not when seedlings were stressed for only 1 week. In wheat, genotypic differences in biomass production under salt stress were observed only after 3 weeks of stress (James et al., 2002). The observed reduction in plant biomass might be due to a combination of slower growth and development as a result of osmotic stress (Shani and Ben-Gal, 2005), inhibition of photosynthesis as a result of direct effects of salinity on the photosynthetic apparatus or indirect effects as a result of a reduction in sink capacity (Kato and Takeda, 1996). The fact that the two tolerant breeding lines maintained substantially greater biomass under salt stress, lower Na+ concentration and higher K+/Na+ ratio in leaves (Table 2) than the sensitive cultivar (IR29) during both stages, as well as greater grain yield when subject to salt stress during reproduction, confirmed their tolerance of salt stress as we observed previously (Moradi et al., 2003).
During the seedling stage, gas exchange attributes were significantly reduced by salt stress, with a greater reduction with time of exposure. A substantial reduction in photosynthesis, stomatal conductance and transpiration was detected within only 4 h of exposure to salt stress (Fig. 1). The salt-tolerant cultivars seem to have better control over their stomata and maintained lower transpiration rates in the short term immediately after the imposition of salt stress (Fig. 1) probably to limit damaging effects of the influx of large quantities of salt and to allow further acclimation. James et al. (2002) observed a large decrease in stomatal conductance of two contrasting wheat genotypes under salinity, which was not associated with poor water relations, but presumably due to ‘root signals’ as the leaf turgor of both genotypes did not change under stress.
The observed decrease in gs and reduction in transpiration rate might be among the important adaptive mechanisms of salinity tolerance in rice (Flowers and Yeo, 1981; Robinson, 1988). Interestingly, the most tolerant cultivar (IR651) had the highest photosynthesis rate and gs after 312 h of exposure to salt stress. The salt concentration in leaves of the tolerant lines was lower than that of the intolerant line IR29 (Table 2), and this could be attributed to the initial period of acclimation following exposure to salt stress, when a reduction in gs and transpiration will also result in reduced salt uptake, as most of this uptake in rice is known to occur passively, through the transpiration stream (Yeo and Flowers, 1986). However, processes occurring during this early acclimation period await further investigation. Mechanisms underlying the longer term adaptive responses observed in the tolerant cultivar after 312 h are not clear, but probably involve processes that resulted in better control of uptake and/or translocation of toxic salts to the shoot.
During the reproductive stage, photosynthesis, stomatal conductance and transpiration, measured on the flag leaf at flowering, also decreased under saline conditions, with greater effects on stomatal conductance and transpiration, whereas Ci did not show a significant reduction (Fig. 2), and is similar to that observed at the seedling stage (Fig. 1). IR651 again maintained the highest photosynthetic CO2 fixation rate under salt stress, and this is associated with higher gs (Fig. 2), similar to the longer term responses of the seedlings of this line to salt stress. The lack of parallel effects of salinity on Ci again suggested a direct effect of salinity on carbon assimilation, apart from its effect on gs. Salt accumulation in the mesophyll cells may inhibit carbon assimilation, resulting in an increase in internal CO2 concentration, with eventual reduction in stomatal conductance (Maxwell and Johnson, 2000), particularly in sensitive cultivars such as IR29.
Salinity is known to inhibit photosynthesis in a number of plant species (Longstreth and Nobel, 1979; Flowers and Yeo, 1981; Yeo et al., 1985; Dionsio-Sese and Tobita, 2000). Possible reasons for this include stomatal closure, feedback inhibition due to reduced sink activity, decreased efficiency of Rubisco, displacement of essential cations from the endo-membrane structure (leading to changes in permeability), and swelling and disorganization of the grana (Flowers and Yeo, 1981), or due to the direct effects of salt on stomatal conductance via a reduction in guard cell turgor and intercellular CO2 partial pressure (Dionisio-Sese and Tobita, 2000). Recently, Chen and Gallie (2004) reported that the AsA redox state controls the rate of transpiration and stomatal conductance. They observed that a higher AsA redox state substantially increases the total open stomatal area of a leaf and consequently results in greater stomatal conductance and a higher transpiration rate. Zheng et al. (2001) reported that the transpiration rate generally tends to decline with increasing rhizospheric salinity and this could be attributed to lower water potential in roots and the transport of abscisic acid (ABA) from root to shoot to induce stomatal closure. In wheat, James et al. (2002) observed that reduction in gs occurred under salt stress before an apparent decline in leaf water potential, and argued that chemical signals are likely to cause the decrease in gs. The preliminary data on early stomatal response to salinity also suggested the involvement of root–shoot communication in this initial acclimation stage of the tolerant lines, where stomatal conductance decreased substantially before any noticeable change in leaf water potential (A. M. Ismail, unpubl. res.).
Although the actual quantum yield of PSII did not change substantially, the ETR under saline conditions decreased and qN increased significantly, and this was consistent in both stages despite the longer exposure to salinity during the reproductive stage (Figs 3 and 4). In both IR651 and IR632, ΦPSII did not change significantly, which agreed with their relatively higher photosynthetic gas exchange rate under salt stress. In sorghum, Netondo et al. (2004) observed no significant change in the photosynthetic quantum yield (Fv/Fm) in response to salt stress, but qN increased and ETR decreased, which agreed with the current observations in rice. The increase in qN may reflect a reduced demand for products of electron transport and, hence, increased heat dissipation. These results suggested that, beside its direct effect on stomatal conductance, salinity may reduce photosynthesis through its indirect effect on the photosynthetic apparatus.
Another common damage anticipated under stress conditions is the accumulation of excessive ROS (Asada, 2006), which occurs when the reduction in ΦPSII is much lower than the extent of the reduction in photosynthesis, suggesting movement of electrons to oxygen molecules rather than being used for carbon assimilation. ROS can also cause serious damage to organelles such as chloroplasts, mitochondria and plasma membranes. Among the three cultivars, IR651 and IR632 had the highest level of reduced AsA, which is known to play a vital role in ROS detoxification in plant cells. The two tolerant lines also showed higher activities of SOD, APX and GR, which further ensure detoxification of ROS and regeneration of reduced AsA. The higher qN in IR651 associated with a higher concentration of reduced AsA and higher activities of the scavenging enzymes probably suggested that the excess energy generated in this tolerant line under salt stress is effectively dissipated through upregulation of the reactive oxygen scavenging system. AsA can directly scavenge superoxide, hydroxyl radicals and singlet oxygen, and can serve as an enzyme cofactor, for example for violaxanthin de-epoxidase (Fedoroff, 2006), which catalyses the conversion of violaxanthin to zeaxanthin (the xanthophyll cycle), required for the dissipation of excess excitation energy during qN. Also AsA can act as a secondary antioxidant during reductive recycling of the oxidized form of α-tocopherol, another lipophilic antioxidant molecule (Shalata and Neumann, 2001). The high levels of qN in IR29, on the other hand, might be due to an adverse salt effect on the enzymes involved in the dark reactions of photosynthesis and could result in the generation of excess ROS with subsequent damage to lipid membranes, as demonstrated by the high levels of MDA and severe leaf damage in this cultivar.
The strong negative correlation observed between the level of reduced AsA and MDA at an EC of both 6 dS m−1 (R2 = 0·79, Fig. 7A) and 12 dS m−1 (R2 = 0·62, Fig. 7B), during the seedling stage as well as at flowering (R2 = 0·71) suggested that reduced AsA apparently plays a vital role in reducing membrane damage during salinity stress. Similar observations were also made previously (Noctor and Foyer, 1998; Shalata and Neumann, 2001; Fedoroff, 2006).
During both stages, activities of SOD, APX and GR in IR651 and IR632 increased significantly and with a greater increase in GR activity, while those of IR29 either declined or stayed unchanged (Figs 8 and 9). The superior performance of the salt-tolerant lines, particularly that of IR651, may therefore be partially attributed to their ability to detoxify effectively ROS generated during stress as a consequence of reduced photochemical carbon fixation and excess energy. These processes involve the maintenance of higher activity of SOD (46 % increase at EC of 12 dS m−1) for the detoxification of O2− and production of H2O2 (Fig. 8A) and a high activity of APX (19 % increase in IR651 but a substantial reduction in IR29 at EC of 12 dS m−1, Fig. 8B), together with a high level of reduced AsA (Figs 5C and 6C) for detoxification of H2O2 to H2O. In addition to that, GR activity in IR651 leaves was significantly higher (273 % at an EC of 12 dS m−1 at the vegetative stage) under salt stress than in other cultivars (Figs 8C and 9C).
The upregulation of this antioxidant system in the tolerant lines, together with the maintenance of a high level of reduced AsA and lower MDA compared with those observed in IR29, suggested that this pathway probably plays a functional role in mitigating the effects of salt stress in rice. AsA may also be involved in the maintenance of the higher stomatal conductance observed in the tolerant line IR651 (Chen and Gallie, 2004). The agreement between results obtained at the early seedling stage and those at flowering suggested that mechanisms associated with detoxification of these ROS are effective at both stages, though their effects are more prominent during the early vegetative stage.
One distinctive feature of most plants growing in saline environments is the accumulation of increased amounts of low molecular weight water-soluble metabolites in their cells, such as proline (Hasegawa et al., 2000), possibly for osmotic adjustment. The accumulation of proline in the flag leaf of the three lines was studied at flowering to investigate its association with tolerance to salt stress. The proline concentration significantly increased in the flag leaf of all cultivars under salinity, with the highest relative increase observed in IR29, in which it increased by about 369 %, whereas a much lower increase was observed in the most tolerant line, IR651 (Fig. 10). It has been repeatedly inferred, but not yet proven, that there might be a relationship between salt tolerance and the accumulation of proline and other metabolites for osmotic adjustment. However, the present results suggest that the increase in proline concentration may not be associated with salinity tolerance, which agrees with similar observations made previously (Colmer et al., 1995). However, elevated proline levels may also confer additional regulatory or osmoprotective functions under salt stress, such as its role in the control of the activity of plasma membrane transporters involved in cell osmotic adjustment in barley roots (Cuin and Shabala, 2005). Given the fact that proline biosynthesis is a highly energy-demanding process and that only small quantities of proline are probably required for the control of plasma membrane transporters (Cuin and Shabala, 2005), the observed overproduction of proline in IR29 may not be explained by these processes, but rather may be a reflection of poor performance and greater damage in response to salt stress.
This study showed that tolerant rice cultivars maintained a relatively higher photosynthetic function after a brief period of acclimation following exposure to salt stress. These cultivars also tend to upregulate their antioxidant system to detoxify ROS generated during stress and to dissipate excess energy, as demonstrated by their higher levels of reduced AsA, lower level of MDA that did not increase under salt stress and the upregulation of the activity of enzymes involved in the detoxification system. The greater tolerance of IR651 seems to be associated with a more efficient antioxidant system than IR632, and also a greater ability to recover after a brief acclimation upon exposure to salt stress. The mechanisms investigated in this study seem to be effective both at the early seedling stage and at flowering.
ACKNOWLEDGEMENTS
We thank the Rice Research Institute (RRII) and the Agricultural Biotechnology Research Institute of Iran (ABRII) for providing support for F.M. We also thank Drs Arcelia A. Alejar, Shaobing Peng, Restituta P. Robles and Maribel L. Dionisio-Sese for their advice and valuable suggestions, and J.A. Egdane and E. Ella for technical assistance during the study.
LITERATURE CITED
- Asada K. The water–water cycle in chloroplasts: scavenging of active oxygens and dissipation of excess photons. Annual Review of Plant Physiology and Plant Molecular Biology. 1999;50:601–639. doi: 10.1146/annurev.arplant.50.1.601. [DOI] [PubMed] [Google Scholar]
- Asada K. Production and scavenging of reactive oxygen species in chloroplasts and their functions. Plant Physiology. 2006;141:391–396. doi: 10.1104/pp.106.082040. [DOI] [PMC free article] [PubMed] [Google Scholar]
- Asada K, Urano M, Takahashi M. Subcellular location of superoxide dismutase in spinach leaves and preparation and properties of crystalline spinach superoxide dismutase. European Journal of Biochemistry. 1973;36:257–266. doi: 10.1111/j.1432-1033.1973.tb02908.x. [DOI] [PubMed] [Google Scholar]
- Bates LS, Waldren RP, Teare ID. Rapid determination of proline for water-stress studies. Plant and Soil. 1973;39:205–207. [Google Scholar]
- Bohnert HJ, Jensen P. Strategies for engineering water-stress tolerance in plants. Trends in Biotechnology. 1996;14:89–97. [Google Scholar]
- Bhumbla DR, Abrol IP. Saline and sodic soils. Soils and Rice; Proceedings of the IRRI Symposium on Soils and Rice; International Rice Research Institute; 1978. pp. 719–738. International Rice Research Institute, Manila, Philippines. [Google Scholar]
- Chen Z, Gallie DR. The ascorbic acid redox state controls guard cell signaling and stomata movement. The Plant Cell. 2004;16:1143–1162. doi: 10.1105/tpc.021584. [DOI] [PMC free article] [PubMed] [Google Scholar]
- Colmer TD, Epstein E, Dvorak J. Differential solute regulation in leaf blades of various ages in salt-sensitive wheat and salt tolerant wheat × Lophopyrum elongatum (Host) A. Löve amphiploid. Plant Physiology. 1995;108:1715–1724. doi: 10.1104/pp.108.4.1715. [DOI] [PMC free article] [PubMed] [Google Scholar]
- Cuin TA, Shabala S. Exogenously supplied compatible solutes rapidly ameliorate NaCl-induced potassium efflux from barley roots. Plant and Cell Physiology. 2005;46:1924–1933. doi: 10.1093/pcp/pci205. [DOI] [PubMed] [Google Scholar]
- Davenport R, James RA, Zakrisson-Plogander A, Tester M, Munns R. Control of sodium transport in durum wheat. Plant Physiology. 2005;137:807–818. doi: 10.1104/pp.104.057307. [DOI] [PMC free article] [PubMed] [Google Scholar]
- Dionisio-Sese ML, Tobita S. Antioxidant responses of rice seedlings to salinity stress. Plant Science. 1998;135:1–9. [Google Scholar]
- Dionisio-Sese ML, Tobita S. Effects of salinity on sodium content and photosynthetic responses of rice seedlings differing in salt tolerance. Journal of Plant Physiology. 2000;157:54–58. [Google Scholar]
- Fedoroff N. Redox regulatory mechanisms in cellular stress responses. Annals of Botany. 2006;98:289–300. doi: 10.1093/aob/mcl128. [DOI] [PMC free article] [PubMed] [Google Scholar]
- Flowers TJ, Yeo AR. Variability in the resistance of sodium chloride salinity within rice (Oryza sativa L.) varieties. New Phytologist. 1981;88:363–373. [Google Scholar]
- Foyer CH, Halliwell B. The presence of glutathione and glutathione reductase in chloroplasts: a proposed role in ascorbic acid metabolism. Planta. 1986;133:21–25. doi: 10.1007/BF00386001. [DOI] [PubMed] [Google Scholar]
- Gregorio GB, Senadhira D, Mendoza RD. Screening rice for salinity tolerance. International Rice Research Institute discussion paper series No. 22; 1997. [Google Scholar]
- Hasegawa PM, Bressan R, Zhu J-K, Bohnert H. Plant cellular and molecular responses to high salinity. Annual Review of Plant Physiology and Plant Molecular Biology. 2000;51:463–499. doi: 10.1146/annurev.arplant.51.1.463. [DOI] [PubMed] [Google Scholar]
- Hideg E. Free radical production in photosynthesis under stress conditions. In: Pessarakli M, editor. Handbook of plant and crop stress. New York: Marcel Dekker; 1999. pp. 911–930. [Google Scholar]
- James RA, Rivelli AR, Munns R, von Caemmerer S. Factors affecting CO2 assimilation, leaf injury and growth in salt-stressed durum wheat. Functional Plant Biology. 2002;29:1393–1403. doi: 10.1071/FP02069. [DOI] [PubMed] [Google Scholar]
- Kato T, Takeda K. Associations among characters related to yield sink capacity in spaced-planted rice. Crop Science. 1996;36:1135–1139. [Google Scholar]
- Lin CC, Kao CH. Effect of NaCl stress on H2O2 metabolism in rice leaves. Plant Growth Regulators. 2000;30:151–155. [Google Scholar]
- Longstreth DJ, Nobel PS. Salinity effects on leaf anatomy. Plant Physiology. 1979;63:700–703. doi: 10.1104/pp.63.4.700. [DOI] [PMC free article] [PubMed] [Google Scholar]
- Maxwell K, Johnson GN. Chlorophyll fluorescence: a practical guide. Journal of Experimental Botany. 2000;51:659–668. doi: 10.1093/jxb/51.345.659. [DOI] [PubMed] [Google Scholar]
- Moradi F, Ismail AM, Gregorio GB, Egdane JA. Salinity tolerance of rice during reproductive development and association with tolerance at the seedling stage. Indian Journal of Plant Physiology. 2003;8:276–287. [Google Scholar]
- Munns R, James RA, Läuchli A. Approaches to increasing the salt tolerance of wheat and other cereals. Journal of Experimental Botany. 2006;57:1025–1043. doi: 10.1093/jxb/erj100. [DOI] [PubMed] [Google Scholar]
- Nakano Y, Asada K. Hydrogen peroxide is scavenged by ascorbate specific peroxidase in spinach chloroplasts. Plant and Cell Physiology. 1981;22:867–880. [Google Scholar]
- Netondo GW, Onyango JC, Beck E. Sorghum and salinity: II. Gas exchange and chlorophyll fluorescence of sorghum under salt stress. Crop Science. 2004;44:806–811. [Google Scholar]
- Noctor G, Foyer CH. Ascorbate and glutathione: keeping active oxygen under control. Annual Review of Plant Physiology and Plant Molecular Biology. 1998;49:249–279. doi: 10.1146/annurev.arplant.49.1.249. [DOI] [PubMed] [Google Scholar]
- Orcutt DM, Nilsen ET. Physiology of plants under stress, soil and biotic factors. John Wiley & Sons; 2000. Salinity; pp. 177–237. [Google Scholar]
- Pearson GA, Bernstein L. Salinity effects at several growth stages of rice. Agronomy Journal. 1959;51:654–657. [Google Scholar]
- Peltier WR, Tushingham AM. Global sea level rise and the greenhouse effect: might they be connected? Science. 1989;244:806–810. doi: 10.1126/science.244.4906.806. [DOI] [PubMed] [Google Scholar]
- Peng S, Ismail AM. Physiological basis of yield and environmental adaptation in rice. In: Nguyen HT, Blum A, editors. Physiology and biochemistry integration for plant breeding. New York: Marcel Dekker, Inc; 2004. pp. 83–140. [Google Scholar]
- Pessarakli M, Szabolcs I. Soil salinity and sodicity as particular plant/crop stress factors. In: Pessarakli M, editor. Handbook of plant and crop stress. New York: Dekker; 1999. pp. 1–16. [Google Scholar]
- Pignocchi C, Fletcher JM, Wilkinson JE, Barnes JD, Foyer CH. The function of ascorbate oxidase in tobacco. Plant Physiology. 2003;132:1631–1641. doi: 10.1104/pp.103.022798. [DOI] [PMC free article] [PubMed] [Google Scholar]
- Robinson JM. Does O2 photoreduction occur within chloroplast in vivo? Physiologia Plantarum. 1988;72:666–680. [Google Scholar]
- Shalata A, Neumann PM. Exogenous ascorbic acid (vitamin C) increases resistance to salt stress and reduces lipid peroxidation. Journal of Experimental Botany. 2001;52:2207–2211. doi: 10.1093/jexbot/52.364.2207. [DOI] [PubMed] [Google Scholar]
- Shani U, Ben-Gal A. Long-term response of grapevines to salinity: osmotic effects and ion toxicity. American Journal of Enology and Viticulture. 2005;56:148–154. [Google Scholar]
- Shigeoka AS, Yokota A, Nakano Y, Kitaoka S. The effect of illumination on the l-ascorbic acid content in Euglena gracilis. Z. Agricultural and Biological Chemistry. 1979;43:2053–2058. [Google Scholar]
- Tirol-Padre A, Ladha JK. Assessing the reliability of permanganate-oxidizable carbon as an index of soil labile carbon. Soil Science Society of America Journal. 2004;68:969–978. [Google Scholar]
- Wassmann R, Hien NX, Hoan CT, Tuong TP. Sea level rise affecting the Vietnamese Mekong Delta: water elevation in the flood season and implications for rice production. Climate Change. 2004;66:89–107. [Google Scholar]
- Wolucka BA, Goossens A, Inze D. Methyl jasmonate stimulates the de novo biosynthesis of vitamin C in plant cell suspensions. Journal of Experimental Botany. 2005;56:2527–2538. doi: 10.1093/jxb/eri246. [DOI] [PubMed] [Google Scholar]
- Yeo AR, Flowers T. Salinity resistance in rice (Oryza sativa L.) and a pyramiding approach to breeding varieties for saline soils. Australian Journal of Plant Physiology. 1986;13:161–173. [Google Scholar]
- Yeo AR, Capon SJM, Flowers TJ. The effect of salinity upon photosynthesis in rice (Oryza sativa L.): gas exchange by individual leaves in relation to their salt content. Journal of Experimental Botany. 1985;36:1240–1248. [Google Scholar]
- Yeo AR, Yeo ME, Flowers SA, Flowers TJ. Screening of rice (Oryza sativa L.) genotypes for physiological characters contributing to salinity resistance, and their relationship to overall performance. Theoretical and Applied Genetics. 1990;79:377–384. doi: 10.1007/BF01186082. [DOI] [PubMed] [Google Scholar]
- Yoshida S, Forno DA, Cock JK, Gomez KA. Laboratory manual for physiological studies of rice. Manila, Philippines: International Rice Research Institute; 1976. [Google Scholar]
- Zhang J, Jia W, Yang J, Ismail AM. Role of ABA in integrating plant responses to drought and salt stresses. Field Crops Research. 2006;97:111–119. [Google Scholar]
- Zheng L, Shannon MC, Lesch SM. Timing of salinity stress affecting rice growth and yield components. Agriculture and Water Management. 2001;48:191–206. [Google Scholar]


