Abstract
Temporal organization of tissue metabolism is important for maintaining nutrient and energy homeostasis in mammals. Autophagy is a conserved cellular pathway that is activated in response to nutrient limitation, resulting in the degradation of cytoplasmic components and the release of amino acids and other nutrients. Here, we show that autophagy exhibits robust circadian rhythm in mouse liver, which is accompanied by cyclic induction of genes involved in various steps of autophagy. Functional analyses of transcription factors and cofactors identified C/EBPβ as a potent activator of autophagy. C/EBPβ is rhythmically expressed in the liver and is regulated by both circadian and nutritional signals. In cultured primary hepatocytes, C/EBPβ stimulates the program of autophagy gene expression and is sufficient to activate autophagic protein degradation. Adenoviral-mediated RNAi knockdown of C/EBPβ in vivo abolishes diurnal autophagy rhythm in the liver. Further, circadian regulation of C/EBPβ and autophagy is disrupted in mice lacking a functional liver clock. We have thus identified C/EBPβ as a key factor that links autophagy to biological clock and maintains nutrient homeostasis throughout light/dark cycles.
Keywords: autophagy, C/EBPβ, circadian rhythm, clock, metabolism
Introduction
Organisms evolve diverse strategies to adapt their nutrient and energy metabolisms to the light/dark cycles on the earth. In mammals, the circadian clocks coordinate diurnal rhythms of behaviour and physiology, including major pathways of nutrient and energy metabolism (Rutter et al, 2002; Wijnen and Young, 2006; Green et al, 2008). These pacemakers are self-sustained oscillators in the brain and peripheral tissues, which synchronize their downstream transcriptional output (Panda et al, 2002; Storch et al, 2002; Ueda et al, 2002). Clocks in different tissues can be entrained by distinct external cues, such as light, temperature and nutritional signals. Genetic disruption of components in mammalian clock results in metabolic disorders, including perturbations in lipid and glucose homeostasis (Rudic et al, 2004; Turek et al, 2005; Lamia et al, 2008). In humans, disruption of circadian rhythm has been associated with increased risk for obesity and cardiovascular disease (Leproult and Van Cauter, 2010).
Autophagy is a cellular process that delivers cytosolic components to lysosomes for degradation (Levine and Kroemer, 2008; Mizushima et al, 2008; Yang and Klionsky, 2010). In response to metabolic stress, such as starvation, autophagy is highly induced to degrade glycogen, lipid droplets, and cytosolic components to provide a source of nutrients and metabolic fuel (Rabinowitz and White, 2010). The essential role of autophagy is underscored by neonatal lethality in pups lacking ATG5, an essential factor in the autophagy pathway (Kuma et al, 2004). In addition, autophagy plays an important role in removing protein aggregates and damaged organelles (Komatsu et al, 2005, 2006, 2007; Ebato et al, 2008; Klionsky et al, 2008). Genetic disruption of autophagy genes results in the accumulation of ubiquitinated protein aggregates and abnormal organelles in hepatocytes, neurons, and pancreatic β-cells. Recent studies have also implicated autophagy in the control of hepatic lipid metabolism and the development of insulin resistance (Singh et al, 2009a; Yang et al, 2010). Electron microscopy studies conducted in 1970s have demonstrated that the abundance of autophagic vacuoles varies according to the time of day in several rat tissues (Pfeifer and Scheller, 1975; Reme and Sulser, 1977; Sachdeva and Thompson, 2008). However, whether autophagy is regulated by clock and the molecular mechanisms underlying circadian autophagy rhythm have not been defined. In this study, we show that autophagy displays robust circadian rhythm in mouse liver, which is accompanied by rhythmic induction of autophagy genes. We further identified C/EBPβ as a key transcription factor that links autophagy to circadian pacemaker and maintain nutrient homeostasis throughout light/dark cycles.
Results
Autophagy undergoes diurnal rhythm during the day
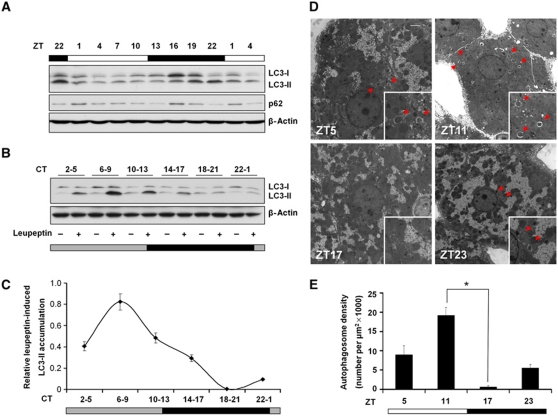
To determine whether autophagy is rhythmically activated during light/dark cycle, we examined molecular markers of autophagy, performed electron microscopy and expression profiling of autophagy-related genes. Microtubule-associated protein 1 light chain 3 (LC3) is the mammalian homologue of yeast Atg8 that undergoes conjugation to phosphatidylethanolamine upon autophagy induction (Mizushima, 2004; Klionsky et al, 2008). The unconjugated LC3 (LC3-I) is localized to cytosol whereas lipid-conjugated form (LC3-II) resides on autophagosome membrane. Immunoblotting analyses of mouse liver lysates harvested at different time points indicate that relative amounts of LC3-I and LC3-II exhibit a strong circadian rhythm in the liver (Figure 1A). We further examined the expression of sequestosome 1 (p62), a protein that interacts with LC3 and delivers autophagy cargos for lysosomal degradation (Komatsu et al, 2007). We found that p62 protein levels also undergo cyclic regulation through light/dark cycle (Figure 1A). Circadian regulation of LC3-I/II and p62 was also observed in other tissues, including skeletal muscle, heart, and kidney (Supplementary Figure S1).
Figure 1.
Rhythmic induction of autophagy in the liver. (A) Immunoblotting of liver lysates using indicated antibodies. Pooled samples from four mice were used for each time point. ZT0 and 12 represent the onset of light and dark cycles, respectively. The figure represents one of three independent sets of circadian samples. (B) Immunoblots showing LC3-II levels in the livers from mice injected with PBS (−) or leupeptin (+) 3 h before tissue harvest. Pooled samples from three mice were used for each lane. (C) Quantitation of in vivo autophagy flux. Following normalization to β-actin in (B), relative leupeptin-induced LC3-II accumulation was calculated by subtracting LC3-II levels in PBS-treated from leupeptin-treated mice for each time point. Data represent mean±s.d. of one representative experiment. (D) Transmission electron micrograph of liver sections at ZT5, 11, 17, and 23. The scale bar in the upper right corner of ZT5 figure represents two microns. The right lower corner shows the higher magnification highlighting a cytosolic region. Note the presence of double-membraned autophagosomes (arrow head). (E) Quantitation of autophagosome abundance in (D). Data represent mean±s.e. *P<0.000001 (ZT11 versus 17, n=10–16 cells). Student's t-test was applied.
While the relative abundance of LC3-I and LC3-II is a useful marker for autophagy under certain conditions, their steady-state levels do not provide an accurate assessment of autophagy flux. A new method using leupeptin, a lysosomal protease inhibitor, was recently developed to measure autophagy flux in mouse liver (Haspel et al, 2011). To further clarify whether autophagy activity is circadianly regulated, we injected a single dose of PBS or leupeptin into mice kept under constant darkness and harvested tissues 3 h following injection. A total of six time points spanning one light/dark cycle was examined. As shown in Figure 1B and C, the rate of LC3-I to LC3-II conversion peaks at CT6-9 and remains elevated at CT10-13 following leupeptin injection. In contrast, the rate of LC3 conversion was modest in the dark phase. We next performed transmission electron microscopy on liver samples to assess autophagosome formation at different time points. Consistent with the flux studies, we found that autophagosome is most abundant in the afternoon (ZT11), rapidly decreases at night (ZT17), and rise again throughout the light phase (ZT5) (Figure 1D and E). Cyclic appearance of autophagic vacuoles was also observed in previous electron microscopy studies in rat tissues (Pfeifer and Scheller, 1975; Reme and Sulser, 1977; Sachdeva and Thompson, 2008). Together, our results indicate that autophagy activity, as revealed by the rate of LC3-I to LC3-II conversion and autophagosome formation, is highly rhythmic in the liver.
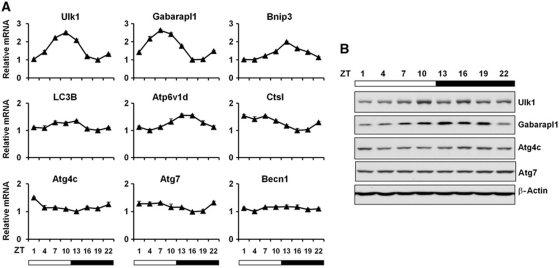
We next examined whether the expression of autophagy genes is regulated by circadian signals. Quantitative PCR (qPCR) analyses indicate that several genes involved in autophagy display robust oscillation throughout the light/dark cycle, including genes involved in the autophagosome formation (Unc-51 like kinase 1 (Ulk1), GABA(A) receptor-associated protein like 1 (Gabarapl1), LC3B), mitophagy (BCL2/adenovirus E1B interacting protein 3 (Bnip3)), and lysosomal degradation (lysosomal protease Cathepsin L (Ctsl) and lysosomal ATPase subunit (Atp6v1d)) (Figure 2A). Cyclic mRNA expression of these genes was also observed in microarray data set of high-resolution temporal transcriptional profiling of livers from mice kept under constant darkness (Hughes et al, 2009; Supplementary Figure S2). Similarly, protein levels of Ulk1 and Gabarapl1 are rhythmically regulated (Figure 2B). In contrast, the expression of Atg7 and beclin 1 (Becn1) remains similar at different time points. Pronounced rhythmic autophagy gene expression was also observed in heart, and to a lesser extent, in the skeletal muscle (Supplementary Figures S3 and S4). Recent studies demonstrate that only a small fraction of rhythmic genes is truly clock regulated (Vollmers et al, 2009). We next analysed temporal regulation of autophagy genes under starvation conditions to assess the relative contribution of circadian and nutritional signals. While the mRNA levels of several autophagy genes (LC3B, Gabarapl1, Ulk1, Bnip3, and Ctsl) remain elevated at all time points in the fasted state, they appear to retain circadian regulation, albeit with altered phase characteristics (Supplementary Figure S5).
Figure 2.
Rhythmic induction of autophagy gene expression in the liver. (A) qPCR analysis of autophagy genes at different time points of mouse livers. Pooled samples from four mice were used for each time point. Data represent mean±s.d. of one of three independent studies. Becn1 serves as an example gene with modest diurnal oscillation at mRNA level. (B) Immunoblots of autophagy proteins in mouse livers at indicated time points. Pooled samples from four mice were used for each time point.
C/EBPβ induces autophagy gene expression and protein degradation
In the liver, ∼10% of all transcribed genes are rhythmically expressed (Panda et al, 2002; Storch et al, 2002; Ueda et al, 2002). Cyclic induction of autophagy genes suggests that transcriptional regulation may play an important role in driving the circadian autophagy rhythm. While the molecular components that execute various steps of autophagy have been extensively studied, the regulatory network that governs the program of autophagy gene transcription remains poorly understood. Forkhead box O3 (Foxo3) has been recently implicated in the nutritional regulation of skeletal muscle autophagy (Mammucari et al, 2007; Zhao et al, 2007). However, we failed to observe robust induction of autophagy genes by Foxo3 in cultured primary hepatocytes, suggesting that tissue-specific regulatory mechanisms are likely involved.
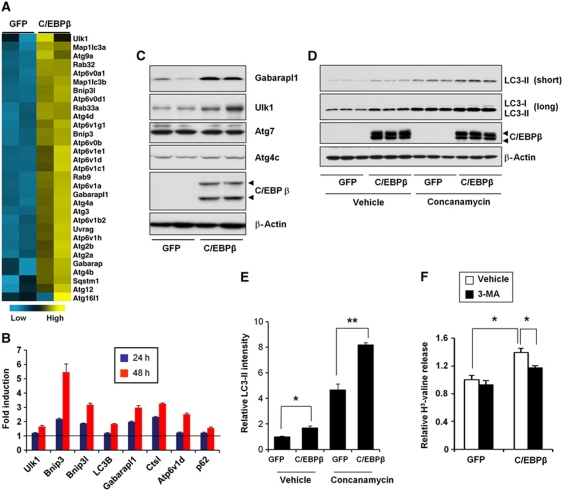
To identify factors that control the program of autophagy gene expression, we examined a set of transcription factors and cofactors known to regulate mammalian clock and/or hepatic starvation response, including Bmal1, RORα, RORγ, Crtc2, C/EBPα, C/EBPβ, BAF60a, BAF60c, and PPARα. We transduced primary hepatocytes with adenovirus expressing individual factors and analysed autophagy gene expression and activation by qPCR and immunoblotting, respectively. These analyses revealed that C/EBPβ strongly stimulates the expression of autophagy genes and the appearance of LC3-II in transduced hepatocytes. In contrast, other factors have modest effects on this pathway. Microarray profiling of primary hepatocytes transduced with control (GFP) or C/EBPβ adenoviruses indicates that C/EBPβ stimulates the expression of many genes involved in different steps of the autophagy pathway, such as Ulk1, Gabarapl1, LC3B, and Bnip3 (Figure 3A–C). Notably, C/EBPβ also induces the expression of a number of lysosomal genes, particularly subunits of the vacuolar-type H+-ATPase that is responsible for lysosomal acidification. The expression of Atg4c and Atg7 appears largely unaffected by C/EBPβ, suggesting that not all autophagy genes are subjected to transcriptional regulation.
Figure 3.
Induction of autophagy gene expression and autophagy process by C/EBPβ. (A) Clustering analysis of autophagy-related genes in primary hepatocytes transduced with GFP or C/EBPβ adenoviruses for 48 h. Blue and yellow represent low and high mRNA expression, respectively. (B) qPCR analysis of autophagy gene expression. Fold induction by C/EBPβ in primary hepatocytes 24 h (blue) or 48 h (red) following adenoviral transduction is shown. Data represent mean±s.d. of one representative experiment. (C) Protein expression of autophagy genes in hepatocytes transduced with GFP or C/EBPβ adenoviruses. Arrowheads point to two C/EBPβ isoforms generated from alternative translation start sites. (D) Immunoblots of total lysates from transduced primary hepatocytes treated with vehicle or concanamycin in triplicates. Blots with different exposure time were shown to illustrate LC3-I and LC3-II signals. (E) Quantitation of LC3-II protein levels following normalization to β-actin. Data represent mean±s.e. Student's t-test was applied. *P<0.01; **P<0.001. (F) Protein degradation assay in transduced hepatocytes in the absence (open) or presence of 3-MA (filled). Note that C/EBPβ-inducible proteolysis is sensitive to 3-MA treatment. Student's t-test was applied. *P<0.05.
We next examined the effects of C/EBPβ on autophagic protein degradation in cultured hepatocytes. Compared with control, adenoviral-mediated expression of C/EBPβ significantly increased LC3-II levels in transduced hepatocytes (Figure 3D and E). The induction of LC3-II is further augmented in the presence of concanamycin, a valuolar ATPase inhibitor. The induction of LC3-II by C/EBPβ is abolished by 3-methyladenine (3-MA), an autophagy inhibitor, but not by proteasome inhibitor PS341 (Supplementary Figure S6). We do not observe changes in p62 protein levels, likely as a result of concomitant increase in its mRNA expression and turnover when autophagy is stimulated by C/EBPβ. Interestingly, C/EBPβ increases LC3-II levels without affecting mTOR activity (Supplementary Figure S7). Further, inhibition of mTOR by Torin1 leads to autophagy induction but has modest effects on C/EBPβ expression, suggesting that mTOR and C/EBPβ may regulate autophagy through distinct mechanisms. To determine whether C/EBPβ is sufficient to stimulate autophagic protein degradation, we transduced hepatocytes with GFP or C/EBPβ adenoviruses, labelled the cells with [3H]-valine for 24 h, and measured the release of radiolabelled amino acid in culture medium to estimate protein. Compared with GFP, protein degradation rate is significantly enhanced in primary hepatocytes transduced with C/EBPβ adenovirus. Further, this augmentation of protein degradation is sensitive to 3-MA treatments (Figure 3F). Together, we conclude that C/EBPβ stimulates the program of autophagy gene expression and is sufficient to enhance autophagic protein degradation.
C/EBPβ stimulates the transcription of autophagy genes through direct promoter occupancy
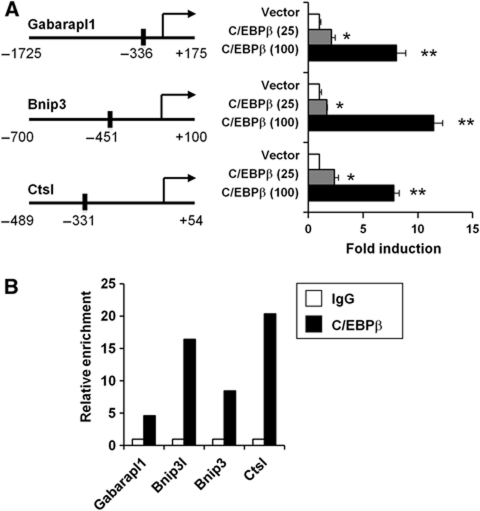
To determine whether C/EBPβ directly regulates autophagy gene transcription, we constructed luciferase reporter constructs for the proximal promoters of Gabarapl1, Bnip3, and Ctsl, most highly induced genes by C/EBPβ, and examined the effects of C/EBPβ on their transcriptional activity. Transient co-transfection of C/EBPβ strongly induces luciferase activity in reporter gene assays (Figure 4A). Motif analyses revealed several putative C/EBPβ binding sites on these promoter sequences. We next performed chromatin immunoprecipitation (ChIP) analyses to assess direct occupancy of C/EBPβ in the native chromatin environment using chromatin extracts prepared from mouse livers. Compared with IgG control, we observed robust enrichment of C/EBPβ in the proximity of predicted binding sites on Bnip3, Ctsl, and Gabarapl1 promoters. In addition, we also found that C/EBPβ is recruited to a C/EBPβ binding site residing in the first intron of Bnip3l (Figure 4B).
Figure 4.
C/EBPβ stimulates the transcription of autophagy genes through direct promoter occupancy. (A) Transcriptional assays using indicated promoter luciferase constructs in the presence of vector (open), 25 ng (grey), or 100 ng (filled) of C/EBPβ expression plasmid. Predicted C/EBPβ binding sites are indicated with solid bars. Data represent mean±s.e. Student's t-test was applied. *P<0.01 (vector versus 25 ng C/EBPβ); **P<0.001 (vector versus 100 ng C/EBPβ). (B) ChIP assay using control IgG (open) or C/EBPβ (filled) antibodies. Relative enrichment was determined by qPCR.
C/EBPβ is regulated by both circadian and nutritional signals
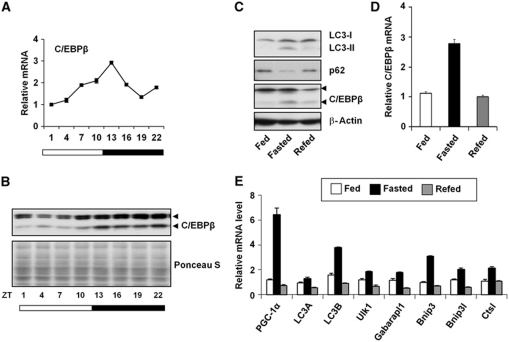
We next explored whether C/EBPβ itself is under the control of biological clock and nutritional status in mice. qPCR analysis of liver RNA isolated at different time points revealed that C/EBPβ mRNA expression exhibits a robust diurnal rhythm and peaks at ZT13 (Figure 5A). Accordingly, C/EBPβ protein expression is also cyclic and reaches its highest levels during the dark phase (Figure 5B). We note that the induction of several autophagy genes tends to lag C/EBPβ protein expression, likely reflecting the time needed for the accumulation of these target mRNA. In response to starvation, hepatic C/EBPβ mRNA and protein expression is significantly elevated (Figure 5C and D), accompanied by increased LC3-II and reduced p62 protein levels. In addition, mRNA expression of autophagy genes, such as Ulk1, Gabarapl1, LC3B, Bnip3, Bnip3l, and Ctsl, is also induced following starvation (Figure 5E).
Figure 5.
C/EBPβ expression is regulated by circadian and nutritional signals. (A, B) Hepatic C/EBPβ mRNA and protein expression at different time points. (C) Immunoblotting of liver lysates from fed, 24 h-fasted or 24 h-refed mice (after 24 h fast). Samples were collected at ZT4. (D, E) qPCR analysis of hepatic gene expression from fed, 24 h-fasted or 24 h-refed mice, the same group as in (C). Pooled samples from 3 to 5 mice were used for each data point. Data in (A), (D), and (E) represent mean±s.d.
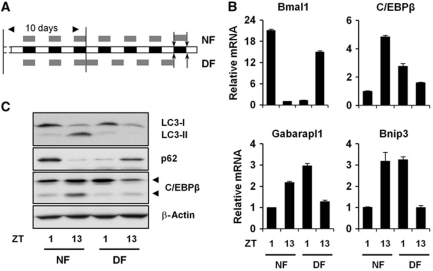
Unlike the central pacemaker residing in the suprachiasmatic nucleus, peripheral clocks are highly sensitive to feeding (Damiola et al, 2000). Altered meal timing, or restricted feeding, in mice results in phase resetting of peripheral clocks within several days. To examine whether the phase of C/EBPβ expression and autophagy is tightly aligned with the phase of liver clock, we subjected C/57Bl6J male mice to night feeding from ZT13 to ZT1 for a period of 10 days and switch half of the group to day feeding (DF) from ZT1 to ZT13 for an additional 4 days (Figure 6A). We harvested the livers at the end of the feeding switch and examined autophagy gene expression and autophagy markers. As shown in Figure 6B, we found that, as expected, feeding switch leads to phase resetting of the expression of Bmal1, a core clock gene that is indispensable for oscillator function. The expression of other clock genes also undergoes phase resetting following restricted feeding (Supplementary Figure S8). C/EBPβ expression is higher at ZT13 before food addition in the night-feeding group and this temporal pattern is completely reversed following the switch to DF (Figure 6B and C). Phase resetting of C/EBPβ expression is accompanied by a switch of autophagy genes, such as Gabarapl1 and Bnip3, as well as a phase reversal of p62 protein levels. These results suggest that C/EBPβ is downstream of circadian and nutritional signalling pathways.
Figure 6.
Regulation of C/EBPβ and autophagy by restricted feeding. (A) The diagram indicates restricted feeding schedule and food availability (grey box, arrows indicate tissue harvest times). (B) qPCR analysis of hepatic gene expression in mice fed during dark (NF) or light (DF) phase. (C) Immunoblotting of liver lysates from mice undergoing restricted feeding. Pooled samples from 3 to 5 mice were used for each data point. Data in (B) represent mean±s.d.
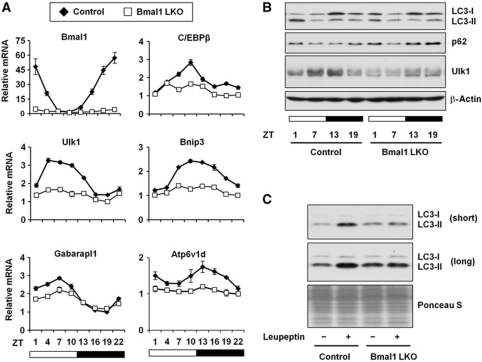
To test whether diurnal regulation of C/EBPβ is dependent on a functional tissue clock, we examined hepatic gene expression in liver-specific Bmal1 knockout mice. Hepatic Bmal1 deficiency disrupts clock in the liver without affecting the central pacemaker (Storch et al, 2007; Lamia et al, 2008), allowing us to dissect tissue-autonomous role of the clock oscillator on C/EBPβ and autophagy gene expression. Similar to previous studies, rhythmic expression of core clock genes is defective in liver-specific Bmal1 knockout mice (Figure 7A; Supplementary Figure S9). Interestingly, the amplitude of C/EBPβ mRNA oscillation is greatly diminished in the Bmal1-deficient mouse livers. In addition, diurnal regulation of Bnip3 and Ulk1 mRNA expression is nearly completely abolished, whereas the amplitude of Gabarapl1 mRNA expression is significantly reduced in the absence of Bmal1. Autophagy marker and flux assays indicate that while the steady-state levels of LC3 isoforms and p62 are modestly affected, peak autophagy flux (ZT6-9) is significantly diminished in clock-deficient mouse livers (Figure 7B and C). These results strongly suggest that cyclic expression of C/EBPβ and autophagy genes is under the control of biological clock in a tissue-autonomous manner.
Figure 7.
Liver autonomous clock is required for normal autophagy rhythm. (A) qPCR analysis of hepatic genes in control (filled diamond) and liver-specific Bmal1 knockout mice (open square, Bmal1 LKO). (B) Immunoblots of total liver lysates in control and Bmal1 LKO mice using indicated antibodies. (C) In vivo autophagy flux assay was performed at ZT6-9. Pooled samples from 3 to 4 mice were used for each group. Data in (A) represent mean±s.d.
C/EBPβ is essential for physiological regulation of autophagy in the liver
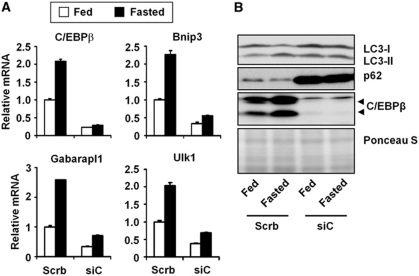
To critically assess whether C/EBPβ is required for physiological regulation of autophagy, we performed in vivo RNAi knockdown of C/EBPβ in the liver. We transduced mice with adenoviruses that express control shRNA or shRNA directed against C/EBPβ through tail vein injection (Cui et al, 2005). Recombinant adenoviruses efficiently and selectively transduce hepatocytes and have been widely used to knock down endogenous genes in the liver. We first examined whether C/EBPβ is required for the induction of autophagy in response to starvation. Compared with control, C/EBPβ mRNA and protein levels are significantly reduced in livers transduced with siC/EBPβ adenovirus (Figure 8). Basal and starvation-induced expression of autophagy genes, such as Gabarapl1, Bnip3, and Ulk1, is severely diminished when endogenous C/EBPβ is depleted. Further, p62 protein levels are drastically elevated in the knockdown liver, consistent with a blockade of autophagy in the liver of C/EBPβ knockdown mice.
Figure 8.
C/EBPβ is essential for physiological regulation of autophagy in the liver. (A) qPCR analysis of hepatic genes in mice transduced with control (Scrb) or siC/EBPβ (siC) adenoviruses under fed (open) and 16 h-fasted (filled) conditions. Samples were harvested at ZT19. (B) Immunoblots of liver lysates in mice from (A) under fed and fasted conditions. Pooled samples from 3 to 5 mice were used for each data point. Data in (A) represent mean±s.d.
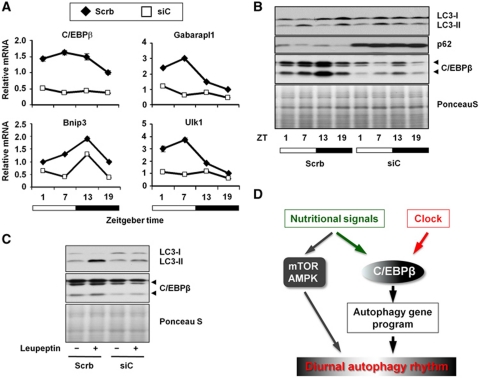
We next examined whether C/EBPβ is responsible for driving the daily cycles of autophagy gene expression and autophagy process in the liver. We harvested liver from mice transduced with control or siC/EBPβ adenoviruses at four time points. As expected, rhythmic expression of C/EBPβ mRNA and protein is significantly diminished in livers transduced with siC/EBPβ adenovirus (Figure 9A and B). Gene expression analysis revealed that C/EBPβ knockdown significantly perturbs circadian regulation of autophagy genes, such as Ulk1 and Gabarapl1 (Figure 9A). Immunoblotting analyses indicate that while p62 protein is cyclic in control livers, its levels are constitutively elevated in the knockdown livers (Figure 9B). In addition, diurnal regulation of LC3-I and LC3-II protein levels is also altered when hepatic C/EBPβ is reduced. To ascertain whether autophagy flux is reduced in response to C/EBPβ knockdown, we examined leupeptin-induced LC3-II accumulation during peak hours of autophagy (ZT6-9) and found that autophagy flux was nearly abolished in mouse livers transduced with siC/EBPβ (Figure 9C). Together, we proposed that C/EBPβ serves as a link between nutritional and circadian signals and the autophagy gene program to coordinate rhythmic activation of autophagy (Figure 9D).
Figure 9.
C/EBPβ is essential for circadian autophagy regulation in the liver. (A) qPCR analysis of hepatic genes in mice transduced with control (Scrb, filled diamond) or siC/EBPβ (siC, open square) adenoviruses harvested at indicated time points. Data represent mean±s.d. (B) Immunoblots of liver lysates in mice from (A) at indicated time points. (C) In vivo autophagy flux assay was performed in mice transduced with control (Scrb) or siC/EBPβ (siC) adenoviruses at ZT6-9. Pooled samples from 3 to 5 mice per group were analysed. (D) Model depicting circadian autophagy regulation through C/EBPβ. Note that C/EBPβ receives both circadian and nutritional input and coordinately regulates the program of autophagy gene expression.
Discussion
In this study, we characterized the temporal organization of autophagy in mouse tissues and identified C/EBPβ as a key factor that orchestrates circadian autophagy rhythm in the liver. Circadian induction of autophagy was observed in mouse liver, skeletal muscle, heart, and kidney (Figure 1; Supplementary Figure S1). In the liver, autophagy flux is highest in the afternoon, rapidly decreases at night, and rises again throughout the light phase. Interestingly, the periods with low autophagy activity appear to correlate with feeding that occurs after the onset of dark phase in rodents. This correlation is consistent with the fact that autophagy activity is highly sensitive to nutritional status. In mice fasted for 24 h, hepatic expression of several autophagy genes still appears to be cyclic, suggesting that circadian timing cues also impinge on the autophagy gene program. Furthermore, liver-specific Bmal1 deficiency results in altered rhythmic expression of autophagy genes and significantly reduced autophagy flux at peak hours, indicating that the core molecular clock is required for normal circadian regulation of autophagy.
Interestingly, robust rhythmic autophagy gene expression was only observed in the liver and heart, suggesting that autophagy is likely regulated by distinct mechanisms in peripheral tissues (Supplementary Figures S3 and S4). Previous studies have demonstrated that FoxO3 is nutritionally regulated and induces autophagy in skeletal muscle (Mammucari et al, 2007; Zhao et al, 2007). However, it only modestly increases autophagy gene expression in hepatocytes, suggesting that distinct transcriptional networks may be responsible for the regulation of autophagy in different tissues. In support of this notion, we identified bZIP transcription factor C/EBPβ as a potent activator of the autophagy gene program and autophagic protein degradation. C/EBPβ stimulates the expression of a set of core autophagy genes as well as lysosomal genes and is required for the induction of autophagy in response to starvation. Recently, transcription factor EB (TFEB) was found to regulate lysosomal biogenesis and play an important role in autophagy (Sardiello et al, 2009; Settembre et al, 2011). While the significance of TFEB in circadian autophagy remains unknown, together these studies underscore an important role of transcriptional control in physiological regulation of autophagy.
C/EBPβ appears to serve as a target of both nutritional and circadian signals in the liver. Rhythmic expression of C/EBPβ requires a functional tissue clock, suggesting that the circadian pacemaker may exert direct effects on C/EBPβ expression. Consistently, we found that rhythmic autophagy gene expression persists in constant darkness and during starvation. As such, nutritional and circadian signals likely provide distinct cues that are integrated by C/EBPβ in physiological regulation of autophagy. The molecular mechanism underlying clock regulation of C/EBPβ remains unknown. The significance of C/EBPβ in autophagy is supported by the observations that starvation-induced autophagy gene expression and autophagy flux are impaired in response to RNAi knockdown. In addition, knockdown of C/EBPβ severely impairs autophagy gene expression and disrupts physiological regulation of autophagy throughout light/dark cycles. These studies strongly implicate C/EBPβ as a key integrator of nutritional and circadian signals that orchestrates cyclic autophagy activation in the liver.
Rhythmic activation of autophagy in mammalian tissues likely provides a steady supply of nutrients throughout the light/dark cycles. The bulk degradation of cellular components provides amino acids and lipids that serve as a critical source of fuel and substrates for biosynthetic pathways in the tissue. In addition, these nutrients also enter systemic circulation and supply metabolites for organismal energy homeostasis, such as blood glucose control. Recent studies have implicated autophagy in the regulation of hepatic lipid metabolism, adipocyte function, and the pathogenesis of insulin resistance (Singh et al, 2009a, 2009b; Yang et al, 2010). Impaired autophagy reduces triglyceride hydrolysis in lipid droplets and may participate in the pathogenesis of hepatic steatosis. Whether C/EBPβ is involved in this context remains presently unknown. Given that disruption of circadian clock increases the risk for metabolic disorders (Copinschi et al, 2000), it is possible that aberrant temporal regulation of autophagy may contribute to altered hepatic lipid metabolism in obesity.
Materials and methods
Animals
All animal experiments were performed according to procedures approved by the University Committee on Use and Care of Animals. C57BL/6J male mice were fed ad lib and maintained in 12/12 h light/dark cycles. For circadian studies, four mice were dissected every 3 h for a period of 24 h. Tissues were immediately frozen for the preparation of protein lysates and total RNA. Bmal1 flox/flox mice were purchased from Jackson Laboratory (Stock #007668) and crossed with Albumin-Cre transgenic mice (Stock #003574) to obtain the liver-specific Bmal1 knockout mouse. In restricted feeding experiment, C57BL/6J male mice were fed exclusively at night (night feeding from ZT13 to ZT1, NF) for a total of 10 days. On day 11, the animals were divided into two groups that were kept on NF or switched to DF from ZT1 to ZT13. Animals were sacrificed at two time points (ZT1 and 13) 4 days following the feeding switch. For in vivo autophagy flux measurements, mice were injected intraperitoneally a single dose of PBS or leupeptin (40 mg/kg). Tissues were harvested 3 h following the injection during which food was restricted. All the procedures were performed in a red dim light for constant darkness condition. Pooled liver lysates from 3 to 5 mice were used for LC3 immunoblotting. Quantitation of LC3-II protein was performed using ImageJ (http://rsbweb.nih.gov/ij/). The autophagy flux rate was determined by leupeptin-induced LC3-II accumulation normalized to β-actin.
In vitro and in vivo adenoviral transduction
Primary hepatocytes were transduced with recombinant adenoviruses expressing GFP or C/EBPβ with moiety of infection from ∼2 to 10. For in vivo adenoviral transduction, C57BL/6J male mice (3–5 per group) were transduced with purified adenoviruses through tail vein injection (0.2 OD per mouse), as previously described (Li et al, 2008). The titres of all adenoviruses were determined based on the expression of GFP and adenoviral gene AdE4 before use to ensure similar doses were administered in the studies.
Protein and RNA analysis
Immunoblotting studies were performed using specific antibodies for LC3 (LC3-5F10, Nanotools), p62 (PW9860, Enzo Life Sciences), Gabarapl1 (11010-1-AP, ProteinTech Group, Inc), Ulk1 (A7481, Sigma), Atg4c (AP1810c, Abgent), Atg7 (AP1813b, Abgent), C/EBPβ (sc-150, Santa Cruz), and β-actin (A4700, Sigma). For inhibitor treatments, transduced hepatocytes were incubated in the presence of vehicle, 100 nM concanamycin A, 10 mM 3-MA, or 500 nM PS341 for 60 or 90 min before harvest. Hepatic gene expression was analysed by qPCR using specific primers as previously described (Liu et al, 2007) or in Supplementary Table S1. Data represent mean±s.d. Microarray was carried out using total RNA from primary hepatocytes transduced with GFP or C/EBPβ adenoviruses for 48 h using Affymetrix mouse 430 2.0 chips and analysed using dChip software.
ChIP assay
ChIP assay was performed essentially as described (Li et al, 2008). To obtain chromatin lysates from mouse livers, liver nuclei were isolated and then crosslinked in 1% formaldehyde for 15 min followed by sonication. After being precleared with protein G agarose beads, chromatin lysates were immunoprecipitated using antibodies against C/EBPβ (sc-150X, Santa Cruz) or control mouse IgG in the presence of BSA and salmon sperm DNA. Beads were extensively washed before reverse crosslinking. DNA was purified using a purification kit (QIAGEN) and subsequently analysed by qPCR using primers flanking the predicted binding sites on promoter or intron regions (Supplementary Table S1).
Reporter gene assays
AD293 cells were transiently transfected with indicated plasmids using polyethylenimine (Polysciences, Inc) in triplicates. Equal amounts of DNA were used for all transfection combinations by adding appropriate vector DNA. Relative luciferase activities were determined 24 h following transfection.
Transmission electron microscopy
Mice were first perfused with Sorensen's buffer (0.1 M, pH 7.4) and then Karnovsky's fixative buffer. The liver is post-fixed in Karnovsky's fixative buffer for 24–48 h before embedding. The sample preparation for EM was performed by Microscopy and Image Analysis Laboratory at University of Michigan. The images were taken by Philips CM-100 transmission electron microscope. The quantitation of autophagosome density was carried out on 10–16 hepatocytes per time point. The autophagosome number was counted manually, and the cytoplasmic area is measured using software ImageJ.
Protein degradation assay
Primary hepatocytes transduced with GFP or C/EBPβ adenovirus were first labelled in valine-free DMEM containing 0.1%. BSA plus 1.16 μM [3H] L-valine (863.0 mCi/mmol, Moravek Biochemicals, Inc) for 24 h, washed, and then chased in DMEM containing additional 10 mM unlabelled valine for 4 h. Following chase, the hepatocytes were washed and incubated in the same chase media in the presence of DMSO or 10 mM 3-MA. The culture media were collected 12 h after the treatments. Radioactive amino-acid content in culture media and total radioactivity in hepatocytes lysates were determined (Mizushima, 2004). Protein degradation rate is calculated by normalization of released [3H] L-valine to total radioactivity in the cell.
Supplementary Material
Acknowledgments
We are grateful to Shengjuan Gu and Layla Yu for technical assistance and laboratory members for discussions. We thank Drs Daniel Klionsky for comments on the manuscript, Jessica Schwartz, and Marco Sandri for plasmids; and David Sabatini for sharing Torin1. We thank Danming Tang, Dr Yanzhuang Wang, Dotty Sorenson and the Microscopy and Image Analysis Laboratory of University of Michigan for technical support on EM study. This work was supported by the National Institutes of Health (HL097738 and DK077086, JDL). DM is supported by Predoctoral Fellowship from the American Heart Association.
Author contributions: DM and JDL formulated the concept, designed and performed the studies, and wrote the manuscript. SP provides experimental materials.
Footnotes
The authors declare that they have no conflict of interest.
References
- Copinschi G, Spiegel K, Leproult R, Van Cauter E (2000) Pathophysiology of human circadian rhythms. Novartis Found Symp 227: 143–157; discussion 157–162 [DOI] [PubMed] [Google Scholar]
- Cui TX, Piwien-Pilipuk G, Huo JS, Kaplani J, Kwok R, Schwartz J (2005) Endogenous CCAAT/enhancer binding protein beta and p300 are both regulated by growth hormone to mediate transcriptional activation. Mol Endocrinol 19: 2175–2186 [DOI] [PubMed] [Google Scholar]
- Damiola F, Le Minh N, Preitner N, Kornmann B, Fleury-Olela F, Schibler U (2000) Restricted feeding uncouples circadian oscillators in peripheral tissues from the central pacemaker in the suprachiasmatic nucleus. Genes Dev 14: 2950–2961 [DOI] [PMC free article] [PubMed] [Google Scholar]
- Ebato C, Uchida T, Arakawa M, Komatsu M, Ueno T, Komiya K, Azuma K, Hirose T, Tanaka K, Kominami E, Kawamori R, Fujitani Y, Watada H (2008) Autophagy is important in islet homeostasis and compensatory increase of beta cell mass in response to high-fat diet. Cell Metab 8: 325–332 [DOI] [PubMed] [Google Scholar]
- Green CB, Takahashi JS, Bass J (2008) The meter of metabolism. Cell 134: 728–742 [DOI] [PMC free article] [PubMed] [Google Scholar]
- Haspel J, Shaik RS, Ifedigbo E, Nakahira K, Dolinay T, Englert JA, Choi AM (2011) Characterization of macroautophagic flux in vivo using a leupeptin-based assay. Autophagy 7: 629–642 [DOI] [PMC free article] [PubMed] [Google Scholar]
- Hughes ME, DiTacchio L, Hayes KR, Vollmers C, Pulivarthy S, Baggs JE, Panda S, Hogenesch JB (2009) Harmonics of circadian gene transcription in mammals. PLoS Genet 5: e1000442. [DOI] [PMC free article] [PubMed] [Google Scholar]
- Klionsky DJ, Abeliovich H, Agostinis P, Agrawal DK, Aliev G, Askew DS, Baba M, Baehrecke EH, Bahr BA, Ballabio A, Bamber BA, Bassham DC, Bergamini E, Bi X, Biard-Piechaczyk M, Blum JS, Bredesen DE, Brodsky JL, Brumell JH, Brunk UT et al. (2008) Guidelines for the use and interpretation of assays for monitoring autophagy in higher eukaryotes. Autophagy 4: 151–175 [DOI] [PMC free article] [PubMed] [Google Scholar]
- Komatsu M, Waguri S, Chiba T, Murata S, Iwata J, Tanida I, Ueno T, Koike M, Uchiyama Y, Kominami E, Tanaka K (2006) Loss of autophagy in the central nervous system causes neurodegeneration in mice. Nature 441: 880–884 [DOI] [PubMed] [Google Scholar]
- Komatsu M, Waguri S, Koike M, Sou YS, Ueno T, Hara T, Mizushima N, Iwata J, Ezaki J, Murata S, Hamazaki J, Nishito Y, Iemura S, Natsume T, Yanagawa T, Uwayama J, Warabi E, Yoshida H, Ishii T, Kobayashi A et al. (2007) Homeostatic levels of p62 control cytoplasmic inclusion body formation in autophagy-deficient mice. Cell 131: 1149–1163 [DOI] [PubMed] [Google Scholar]
- Komatsu M, Waguri S, Ueno T, Iwata J, Murata S, Tanida I, Ezaki J, Mizushima N, Ohsumi Y, Uchiyama Y, Kominami E, Tanaka K, Chiba T (2005) Impairment of starvation-induced and constitutive autophagy in Atg7-deficient mice. J Cell Biol 169: 425–434 [DOI] [PMC free article] [PubMed] [Google Scholar]
- Kuma A, Hatano M, Matsui M, Yamamoto A, Nakaya H, Yoshimori T, Ohsumi Y, Tokuhisa T, Mizushima N (2004) The role of autophagy during the early neonatal starvation period. Nature 432: 1032–1036 [DOI] [PubMed] [Google Scholar]
- Lamia KA, Storch KF, Weitz CJ (2008) Physiological significance of a peripheral tissue circadian clock. Proc Natl Acad Sci USA 105: 15172–15177 [DOI] [PMC free article] [PubMed] [Google Scholar]
- Leproult R, Van Cauter E (2010) Role of sleep and sleep loss in hormonal release and metabolism. Endocr Dev 17: 11–21 [DOI] [PMC free article] [PubMed] [Google Scholar]
- Levine B, Kroemer G (2008) Autophagy in the pathogenesis of disease. Cell 132: 27–42 [DOI] [PMC free article] [PubMed] [Google Scholar]
- Li S, Liu C, Li N, Hao T, Han T, Hill DE, Vidal M, Lin JD (2008) Genome-wide coactivation analysis of PGC-1alpha identifies BAF60a as a regulator of hepatic lipid metabolism. Cell Metab 8: 105–117 [DOI] [PMC free article] [PubMed] [Google Scholar]
- Liu C, Li S, Liu T, Borjigin J, Lin JD (2007) Transcriptional coactivator PGC-1alpha integrates the mammalian clock and energy metabolism. Nature 447: 477–481 [DOI] [PubMed] [Google Scholar]
- Mammucari C, Milan G, Romanello V, Masiero E, Rudolf R, Del PP, Burden SJ, Di LR, Sandri C, Zhao J, Goldberg AL, Schiaffino S, Sandri M (2007) FoxO3 controls autophagy in skeletal muscle in vivo. Cell Metab 6: 458–471 [DOI] [PubMed] [Google Scholar]
- Mizushima N (2004) Methods for monitoring autophagy. Int J Biochem Cell Biol 36: 2491–2502 [DOI] [PubMed] [Google Scholar]
- Mizushima N, Levine B, Cuervo AM, Klionsky DJ (2008) Autophagy fights disease through cellular self-digestion. Nature 451: 1069–1075 [DOI] [PMC free article] [PubMed] [Google Scholar]
- Panda S, Antoch MP, Miller BH, Su AI, Schook AB, Straume M, Schultz PG, Kay SA, Takahashi JS, Hogenesch JB (2002) Coordinated transcription of key pathways in the mouse by the circadian clock. Cell 109: 307–320 [DOI] [PubMed] [Google Scholar]
- Pfeifer U, Scheller H (1975) A morphometric study of cellular autophagy including diurnal variations in kidney tubules of normal rats. J Cell Biol 64: 608–621 [DOI] [PMC free article] [PubMed] [Google Scholar]
- Rabinowitz JD, White E (2010) Autophagy and metabolism. Science 330: 1344–1348 [DOI] [PMC free article] [PubMed] [Google Scholar]
- Reme CE, Sulser M (1977) Diurnal variation of autophagy in rod visual cells in the rat. Albrecht Von Graefes Arch Klin Exp Ophthalmol 203: 261–270 [DOI] [PubMed] [Google Scholar]
- Rudic RD, McNamara P, Curtis AM, Boston RC, Panda S, Hogenesch JB, Fitzgerald GA (2004) BMAL1 and CLOCK, two essential components of the circadian clock, are involved in glucose homeostasis. PLoS Biol 2: e377. [DOI] [PMC free article] [PubMed] [Google Scholar]
- Rutter J, Reick M, McKnight SL (2002) Metabolism and the control of circadian rhythms. Annu Rev Biochem 71: 307–331 [DOI] [PubMed] [Google Scholar]
- Sachdeva UM, Thompson CB (2008) Diurnal rhythms of autophagy: implications for cell biology and human disease. Autophagy 4: 581–589 [DOI] [PubMed] [Google Scholar]
- Sardiello M, Palmieri M, di Ronza A, Medina DL, Valenza M, Gennarino VA, Di Malta C, Donaudy F, Embrione V, Polishchuk RS, Banfi S, Parenti G, Cattaneo E, Ballabio A (2009) A gene network regulating lysosomal biogenesis and function. Science 325: 473–477 [DOI] [PubMed] [Google Scholar]
- Settembre C, Di Malta C, Polito VA, Garcia Arencibia M, Vetrini F, Erdin S, Erdin SU, Huynh T, Medina D, Colella P, Sardiello M, Rubinsztein DC, Ballabio A (2011) TFEB links autophagy to lysosomal biogenesis. Science 332: 1429–1433 [DOI] [PMC free article] [PubMed] [Google Scholar]
- Singh R, Kaushik S, Wang Y, Xiang Y, Novak I, Komatsu M, Tanaka K, Cuervo AM, Czaja MJ (2009a) Autophagy regulates lipid metabolism. Nature 458: 1131–1135 [DOI] [PMC free article] [PubMed] [Google Scholar]
- Singh R, Xiang Y, Wang Y, Baikati K, Cuervo AM, Luu YK, Tang Y, Pessin JE, Schwartz GJ, Czaja MJ (2009b) Autophagy regulates adipose mass and differentiation in mice. J Clin Invest 119: 3329–3339 [DOI] [PMC free article] [PubMed] [Google Scholar]
- Storch KF, Lipan O, Leykin I, Viswanathan N, Davis FC, Wong WH, Weitz CJ (2002) Extensive and divergent circadian gene expression in liver and heart. Nature 417: 78–83 [DOI] [PubMed] [Google Scholar]
- Storch KF, Paz C, Signorovitch J, Raviola E, Pawlyk B, Li T, Weitz CJ (2007) Intrinsic circadian clock of the mammalian retina: importance for retinal processing of visual information. Cell 130: 730–741 [DOI] [PMC free article] [PubMed] [Google Scholar]
- Turek FW, Joshu C, Kohsaka A, Lin E, Ivanova G, McDearmon E, Laposky A, Losee-Olson S, Easton A, Jensen DR, Eckel RH, Takahashi JS, Bass J (2005) Obesity and metabolic syndrome in circadian Clock mutant mice. Science 308: 1043–1045 [DOI] [PMC free article] [PubMed] [Google Scholar]
- Ueda HR, Chen W, Adachi A, Wakamatsu H, Hayashi S, Takasugi T, Nagano M, Nakahama K, Suzuki Y, Sugano S, Iino M, Shigeyoshi Y, Hashimoto S (2002) A transcription factor response element for gene expression during circadian night. Nature 418: 534–539 [DOI] [PubMed] [Google Scholar]
- Vollmers C, Gill S, DiTacchio L, Pulivarthy SR, Le HD, Panda S (2009) Time of feeding and the intrinsic circadian clock drive rhythms in hepatic gene expression. Proc Natl Acad Sci USA 106: 21453–21458 [DOI] [PMC free article] [PubMed] [Google Scholar]
- Wijnen H, Young MW (2006) Interplay of circadian clocks and metabolic rhythms. Annu Rev Genet 40: 409–448 [DOI] [PubMed] [Google Scholar]
- Yang L, Li P, Fu S, Calay ES, Hotamisligil GS (2010) Defective hepatic autophagy in obesity promotes ER stress and causes insulin resistance. Cell Metab 11: 467–478 [DOI] [PMC free article] [PubMed] [Google Scholar]
- Yang Z, Klionsky DJ (2010) Eaten alive: a history of macroautophagy. Nat Cell Biol 12: 814–822 [DOI] [PMC free article] [PubMed] [Google Scholar]
- Zhao J, Brault JJ, Schild A, Cao P, Sandri M, Schiaffino S, Lecker SH, Goldberg AL (2007) FoxO3 coordinately activates protein degradation by the autophagic/lysosomal and proteasomal pathways in atrophying muscle cells. Cell Metab 6: 472–483 [DOI] [PubMed] [Google Scholar]
Associated Data
This section collects any data citations, data availability statements, or supplementary materials included in this article.


