Abstract
During transcription initiation by RNA polymerase (Pol) II, a transient open promoter complex (OC) is converted to an initially transcribing complex (ITC) containing short RNAs, and to a stable elongation complex (EC). We report structures of a Pol II–DNA complex mimicking part of the OC, and of complexes representing minimal ITCs with 2, 4, 5, 6, and 7 nucleotide (nt) RNAs, with and without a non-hydrolyzable nucleoside triphosphate (NTP) in the insertion site +1. The partial OC structure reveals that Pol II positions the melted template strand opposite the active site. The ITC-mimicking structures show that two invariant lysine residues anchor the 3′-proximal phosphate of short RNAs. Short DNA–RNA hybrids adopt a tilted conformation that excludes the +1 template nt from the active site. NTP binding induces complete DNA translocation and the standard hybrid conformation. Conserved NTP contacts indicate a universal mechanism of NTP selection. The essential residue Q1078 in the closed trigger loop binds the NTP 2′-OH group, explaining how the trigger loop couples catalysis to NTP selection, suppressing dNTP binding and DNA synthesis.
Keywords: gene transcription, NTP binding, RNA polymerase, transcription initiation
Introduction
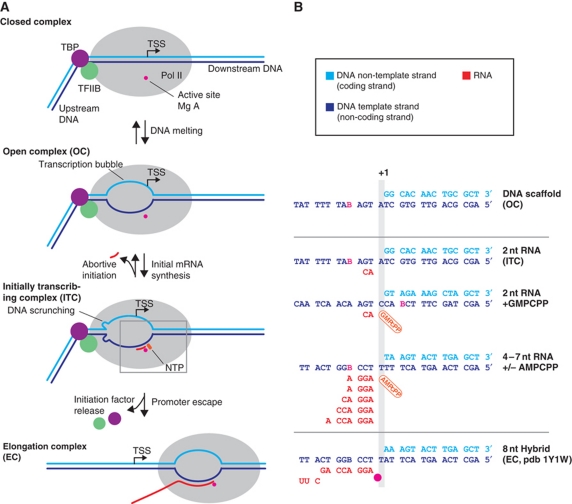
During transcription initiation, RNA polymerase (Pol) II first assembles with initiation factors at promoter DNA to form the closed promoter complex (Figure 1A). Subsequent DNA melting results in an open complex (OC), which contains a DNA bubble with the template single strand at the active site. The polymerase then scans the template downstream until it reaches an initiator sequence (Zhang and Dietrich, 2005). In the presence of nucleoside triphosphate (NTP) substrates, template-directed RNA synthesis is initiated, leading to the initially transcribing complex (ITC). RNA growth beyond a critical length releases initiation factors and converts the unstable ITC to a stable elongation complex (EC) that contains an 8–9 basepair (bp) DNA–RNA hybrid. Conversion of the ITC to the EC is often unsuccessful, resulting in abortive initiation and release of short RNAs.
Figure 1.
Initiation–elongation transition during Pol II transcription. (A) Schematic of transitions in nucleic acid structure. Closed complex, OC, ITC, EC. (B) Nucleic acid scaffold sequences used in this study. The DNA template strand is in blue, the DNA non-template strand is in cyan, and the RNA is in red.
Transcription initiation requires the general transcription factors TFIIB, –D, E, –F, and –H (Roeder, 1996). However, initial RNA synthesis does not require additional protein factors, since Pol II alone can initiate RNA synthesis from a DNA duplex with a single-stranded 3′-extension (Kadesch and Chamberlin, 1982). Such a ‘tailed template’ apparently mimics the downstream duplex and the template single strand in the OC (Figure 1B), as it can direct RNA synthesis from the single-strand extension, starting near the duplex junction. Thus, the Pol II active centre has primase-like activity that can catalyse de novo RNA synthesis during the formation of the first few phosphodiester bonds.
Structural studies provided models for the closed complex and the OC of bacterial and eukaryotic RNA polymerases (Murakami et al, 2002; Kostrewa et al, 2009; Liu et al, 2010). The structure of the EC is known (Gnatt et al, 2001; Kettenberger et al, 2004; Westover et al, 2004; Wang et al, 2006; Vassylyev et al, 2007; Andrecka et al, 2009), and revealed the location of downstream DNA in the active centre cleft, the DNA–RNA hybrid at the active site, and non-template DNA and upstream DNA above the cleft. However, there is currently no structural data on the OC and the ITC and thus it remains unclear how DNA is positioned on Pol II after promoter opening, and which structural rearrangements occur during formation of ITC intermediates containing short RNAs. Here, we present Pol II–nucleic acid complex crystal structures that describe structures that resemble intermediates during the transition from a transient OC to a stable EC. After this work was completed, an independent study reported similar structures of ITC-like complexes (Liu et al, 2011) and is compared in the discussion.
Results
Pol II–DNA complex and template positioning
In previous work, we modelled the Pol II OC assuming that melted downstream promoter DNA binds to the Pol II cleft as in the EC (Kostrewa et al, 2009). This model assumed that there are binding sites for the downstream duplex in the cleft and for the template single strand opposite the active site. To provide evidence for this, we solved the crystal structure of a binary Pol II–DNA complex that mimics the OC (see Materials and methods). We incubated purified Pol II with tailed-template DNA scaffolds of different sequence, crystallized the resulting complexes, or soaked Pol II crystals with DNA scaffolds. Then, we examined DNA binding by phasing the crystals with the free Pol II structure (Armache et al, 2005), to avoid any nucleic acid model bias. One DNA scaffold (Figure 1B) resulted in strong difference density for DNA in the cleft, and enabled structure determination at 3.8 Å resolution (Tables I and II).
Table 1. Pol II–nucleic acid complex structures elucidating initial transcription.
| Complex | Tailed-template DNAa | RNA (−1 and upstream) | NTP (+1) | Resolution (Å) | Rfree (%) | Hybrid conformationb | Trigger loopc | PDB code |
|---|---|---|---|---|---|---|---|---|
| 1 | DNA-1 | — | — | 3.8 | 19.1 | – (Open complex) | Open | 4A3I |
| 2 | DNA-1 | 2 nt | — | 3.5 | 20.2 | Standard | Open | 4A3G |
| 3 | DNA-2 | 2 nt | GMPCPP | 3.7 | 19.6 | Standard | Closed | 4A3J |
| 4 | 4 nt | — | 3.5 | 20.1 | Tilted | Open | 4A3B | |
| 5 | 4 nt | AMPCPP | 3.9 | 20.7 | Standard | Closed | 4A3M | |
| 6 | 5 nt | — | 3.5 | 20.1 | Tilted | Open | 4A3C | |
| 7 | 5 nt | AMPCPP | 3.4 | 20.6 | Standard | Closed | 4A3E | |
| 8 | 6 nt | — | 3.4 | 18.7 | Tilted | Open | 4A3D | |
| 9 | 6 nt | AMPCPP | 3.5 | 20.7 | Standard | Closed | 4A3F | |
| 10 | 7 nt | — | 3.5 | 19.0 | Tilted | Open | 4A3K | |
| 11 | 7 nt | AMPCPP | 3.5 | 21.1 | Standard | Closed | 4A3L | |
| aSequences for nucleic acids are in Figure 1B. | ||||||||
| bHybrid conformation (standard, tilted). | ||||||||
| cTrigger loop conformation (mainly closed or entirely open). | ||||||||
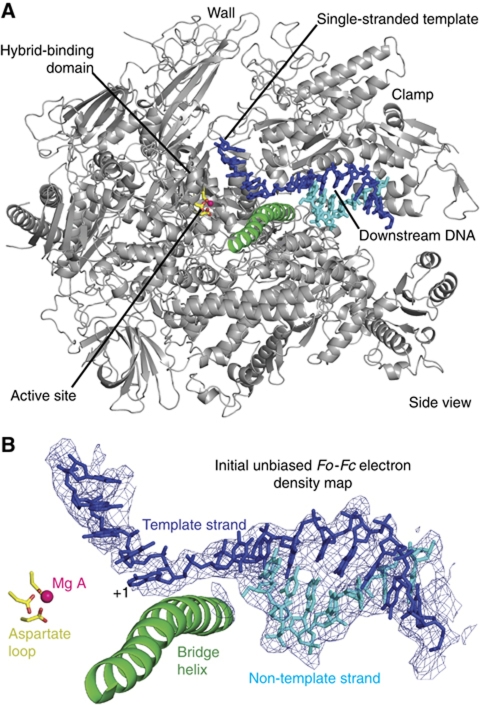
The structure revealed that the downstream DNA duplex resides in the cleft as in the EC (1Y1W) (Kettenberger et al, 2004) (Figure 2A). The template strand extends over the bridge helix into the active centre (Figure 2B) generally along the path it takes in the EC. Five DNA nts were observed in the single-stranded template, from position +1 opposite the NTP-binding site to the upstream position −4. The location of the backbone phosphate groups in the single-stranded region deviates from those in the EC by up to 1.7 Å. These results show that Pol II contains a binding site for the downstream DNA duplex and its 3′-template strand extension opposite the active site, explaining how the DNA is stabilized in the active centre cleft upon conversion of the closed complex to the OC.
Figure 2.
Structure of a Pol II–DNA complex mimicking part of the OC. (A) Overview. A ribbon model of Pol II is shown in silver, and nucleic acids are shown as stick models. The bridge helix is highlighted in green, the active site metal ion A is in pink, and aspartate side chains holding the metal are in yellow. The view is from the side. (B) Unbiased Fo−Fc difference electron density for DNA contoured at 3σ.
Pol II–DNA–RNA dinucleotide complex and initiating events
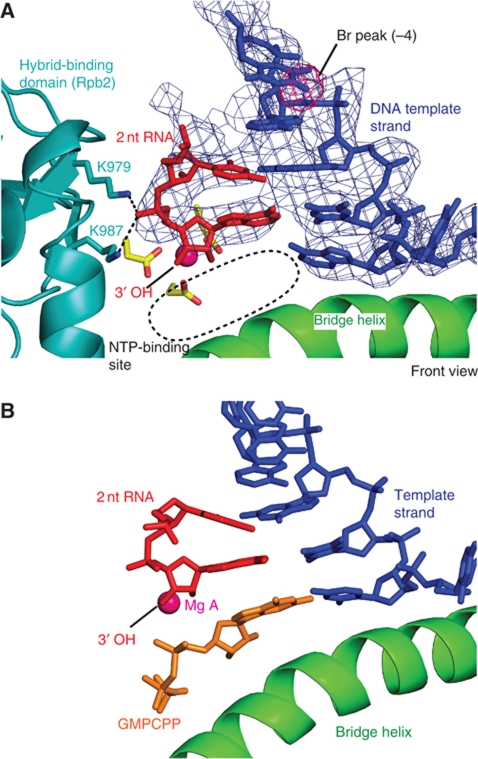
To initiate RNA synthesis, the Pol II OC apparently binds two NTPs opposite the template strand in positions −1 and +1, and orients them to catalyse formation of the first phosphodiester bond. In this ‘initiating complex’, the +1 NTP may bind the insertion site as during elongation, whereas the triphosphate of the −1 NTP may bind the invariant basic residues R497, K775, H1096, and R1097 of the second largest Pol II subunit Rpb2. Unfortunately, we could not trap the initiating complex in crystals, despite extensive trials, likely because of its transient nature. We could, however, trap the next intermediate, a complex of Pol II with DNA template and RNA dinucleotide (Figure 3). We soaked binary Pol II–DNA crystals with a 2-nucleotide (nt) RNA, and refined this structure at 3.5 Å resolution (Figure 3; Table I). A bromine label on the DNA nt −4 defined the register of the nucleic acids (Figure 3A; Table II).
Figure 3.
Structures of a Pol II–DNA–RNA dinucleotide complex. (A) Unbiased Fo−Fc difference electron density for RNA dinucleotide and DNA template strand contoured at 3σ (blue mesh). The anomalous difference density peak for a bromine atom is contoured at 5σ (pink mesh). The view is from the front, rotated by 90° with respect to the view in Figure 2. (B) Structure with RNA dinucleotide (red) and bound NTP analogue GMPCPP (orange).
Table 2. Data collection, refinement, and stereochemistry statistics.
| Complexa | Unit cell (Å) | Resolution (Å) | Unique reflections | I/σ(I) | R sym | Non-H atoms | Rcryst/ Rfree | Ramachandran plotb | RMSD bond lengths/angles (Å/deg) | Bromine anomalous peak height (σ)c |
|---|---|---|---|---|---|---|---|---|---|---|
| 1 | 221.1, 393.2, 282.5 | 50–3.8 (3.90–3.80) | 120 259 | 10.9 (1.7) | 12.5 (89.3) | 31 358 | 15.9/19.1 | 84.9/9.1/6.0 | 0.011/1.38 | — |
| 2 | 220.7, 394.1, 282.7 | 50–3.5 (3.59–3.50) | 153 185 | 10.1 (1.9) | 11.8 (96.2) | 31 395 | 16.8/20.2 | 87.5/7.5/5.0 | 0.010/1.34 | 6.7 |
| 3 | 223.3, 392.8 282.7 | 80–3.7 (3.90–3.70) | 128 404 | 6.8 (1.8) | 11.6 (65.2) | 31 446 | 16.7/20.3 | 86.7/8.4/4.9 | 0.009/1.25 | 4.4 |
| 4 | 222.1, 393.0, 281.8 | 50–3.5 (3.69–3.50) | 152 991 | 6.3 (1.9) | 17.7 (85.0) | 31 462 | 17.8/20.1 | 87.1/7.9/5.0 | 0.010/1.31 | 4.0 |
| 5 | 222.3, 393.0, 282.1 | 59–3.9 (4.11–3.90) | 111 231 | 6.1 (1.9) | 17.1 (86.9) | 31 909 | 17.3/20.7 | 87.5/7.9/4.6 | 0.009/1.20 | 3.0 |
| 6 | 221.4, 393.1, 282.5 | 50–3.5 (3.69–3.50) | 154 318 | 8.1 (2.2) | 18.0 (88.6) | 31 360 | 18.2/21.0 | 86.7/7.9/5.4 | 0.010/1.33 | 8.0 |
| 7 | 223.7, 394.2, 283.3 | 55–3.4 (3.58–3.40) | 167 046 | 8.6 (2.0) | 10.0 (63.2) | 31 543 | 17.6/20.6 | 86.1/8.9/5.0 | 0.011/1.40 | 4.6 |
| 8 | 221.9, 391.3, 283.9 | 50–3.4 (3.58–3.40) | 168 619 | 9.4 (2.2) | 16.1 (93.2) | 31 703 | 16.0/18.3 | 87.5/7.5/5.0 | 0.010/1.36 | 10.7 |
| 9 | 221.6, 391.3, 283.2 | 50–3.5 (3.59–3.50) | 151 373 | 8.0 (2.1) | 12.3 (67.9) | 31 856 | 16.9/19.0 | 85.3/8.9/5.8 | 0.011/1.44 | 13.9 |
| 10 | 222.4, 392.5, 282.4 | 50–3.5 (3.54–3.45) | 161 513 | 18.7 (2.5) | 11.6 (109.4) | 31 706 | 16.5/19.0 | 88.7/7.0/4.3 | 0.010/1.34 | 7.4 |
| 11 | 222.8, 392.4, 279.8 | 48–3.5 (3.69–3.50) | 146 482 | 6.8 (1.7) | 10.3 (76.9) | 31 668 | 17.3/21.2 | 86.7/8.0/5.3 | 0.010/1.35 | 5.1 |
| Values in parenthesis are for the highest resolution shell. All data were collected with a radiation wavelength of 0.9188 Å. | ||||||||||
| aSee Table I for details. | ||||||||||
| bRamachandran plot percent of residues in preferred/allowed/disallowed regions. | ||||||||||
| cThe sigma level of the Br peak from the anomalous difference Fourier map of the 5-bromouracil marker in the DNA template strand. | ||||||||||
The structure revealed that the 2-nt RNA occupies positions −2 and −1, and forms base pairs with the DNA template (Figure 3A). The complex is thus post-translocated with respect to the initiating complex. The RNA 3′-end is located at the active site metal ion A and the NTP site is free. The phosphate group connecting the two RNA nts interacts with the invariant Rpb2 residues K979 and K987 (Figure 3A). These contacts likely stabilize short RNAs in the ITC. Binding of the 2-nt RNA apparently stabilized the DNA template single strand, as judged from the well-defined unbiased electron density. These results indicate that the initiating complex containing the two first NTPs is transient and that formation of the first phosphodiester bond leads to a complex that is stabilized by binding of the RNA dinucleotide opposite the template strand, to facilitate RNA extension.
ITCs and tilted hybrid
We next aimed at trapping in crystals all intermediates during initial transcription until a mature EC with an 8-bp hybrid is formed. We could obtain ITC-mimicking complexes with 4, 5, 6, and 7 nt RNAs (Figures 1B and 4). We used different DNA template sequences in the structure determinations since attempts to generate all structures with a single sequence were unsuccessful for unknown reasons. The structures were refined at resolutions between 3.4 and 3.8 Å and show very good R-factors and stereochemistry (Tables I and II). The register of the nucleic acids could be defined by bromine labelling of the template except for the structure containing 4 nt RNA. The nucleic acid density was well defined, except that the complexes with 4 and 5 nt RNAs lacked density for the 5′-terminal nt.
Figure 4.
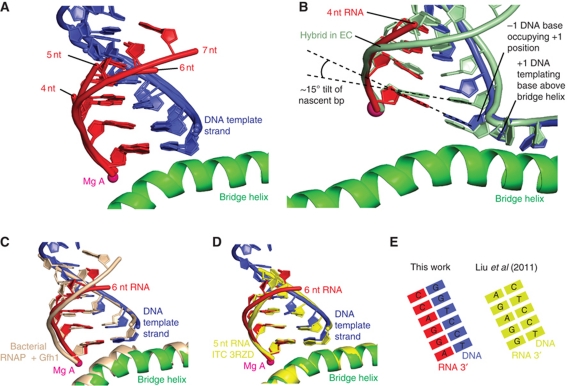
Structures mimicking ITCs. (A) Superposition of DNA–RNA hybrids in ITC-mimicking structures with 4, 5, 6, and 7 nt RNA. (B) Comparison of DNA–RNA hybrids in the 4-nt RNA structure and EC structure (light green, PDB 1Y1W) reveals a tilted hybrid conformation. (C) The hybrid conformation in the 6-nt RNA structure resembles that of the bacterial RNA polymerase EC bound by Gfh1 (beige, PDB 3AOH). (D) The hybrid conformation in the 6-nt RNA structure resembles that of the recently published corresponding structures of the Pol II core enzyme with short hybrids (Liu et al, 2011) (shown in yellow with a 5-nt RNA, PDB 3RZD). (E) Schematic representation of DNA–RNA hybrids and their base pairing arrangements.
The structures containing 4–7 nt RNA show similar hybrid conformations, except for minor differences at the upstream end (Figure 4A). The RNA product always occupies the position of the RNA in the post-translocated EC, whereas the position of the DNA template strand was shifted downstream (Figure 4B). This shift results in a tilting of the DNA–RNA hybrid, with a tilt of around 15 degrees at the −1 bp, similar as in the recent backtracked EC (Cheung and Cramer, 2011), and in a structure of a bacterial EC bound by the inhibitor Gfh1 (Tagami et al, 2010) (Figure 4C). In the tilted conformation, DNA is shifted by one position downstream with respect to the EC. Thus, the DNA −1 nt is located in the position normally occupied by the +1 nt, which instead resides above the bridge helix. The downstream DNA is in the standard position of the EC (PDB code 1Y1W) (Kettenberger et al, 2004) (6 nt) or in an alternative position previously observed for a DNA lesion-containing complex (PDB code 2JA6) (Brueckner et al, 2007) (4 nt), or as a mixture of these two states (5 nt). Thus, in these ITC structures, RNA binds the position it occupies in the EC, whereas the DNA template strand is shifted, resulting in a tilted hybrid, which excludes the templating DNA +1 nt from the active site, but leaves the NTP site free.
NTP binding and DNA translocation
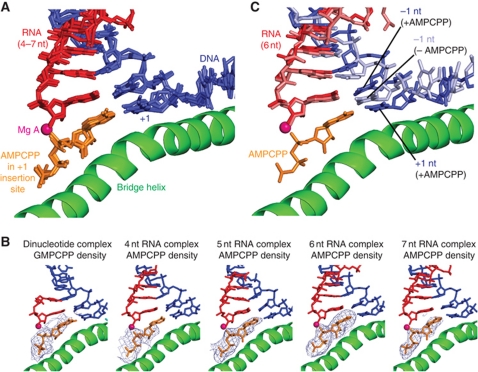
To investigate whether the ITC structures can bind NTP and whether this changes the DNA position, we soaked ITCs with the non-reactive NTP analogue α, β-methyleneadenosine 5′-triphosphate (AMPCPP, or GMPCPP in case of the 2-nt RNA), and solved the structures at resolutions between 3.4 and 3.9 Å (Table I; Figures 1B, 3B, and 5). The AMPCPP bound in the insertion site as revealed by strong difference density (Figure 5B). Whereas the RNA position was essentially unchanged by NTP binding, the DNA translocated upstream, such that the tilted hybrid was converted to the standard conformation of the EC (Figure 5C). The DNA +1 template base was now in its templating position and base paired with the NTP, as expected for nt insertion. The downstream DNA was either in the standard position (6 nt-AMPCPP) or in both known states (4/5 nt-AMPCPP, see above). These results reveal plasticity in the DNA template register and positioning during initial transcription. They also show that NTP binding can stabilize the post-translocated state of the nucleic acids, and that the NTP position is independent of RNA length.
Figure 5.
NTP binding to ITC-mimicking structures. (A) Superposition of AMPCPP-containing complexes with 4, 5, 6, and 7 nt RNA. Shown are the DNA–RNA hybrids and the AMPCPP (orange) from the front. (B) Unbiased Fo−Fc difference electron density (blue mesh) for AMPCPP in different structures. Maps are contoured at 2.5σ for the 2-nt complex, at 2.2σ for the 4-nt complex, and at 3σ for the 5-, 6-, and 7-nt complexes. (C) Superposition of structures with 6-nt RNA in the absence (DNA and RNA in light blue and light red, respectively) and in the presence of AMPCPP (DNA and RNA in blue and red) reveals a change from the tilted to the standard hybrid conformation upon AMPCPP binding.
Conserved mechanism of NTP selection
Upon AMPCPP binding, the mobile trigger loop moved from the open to the closed conformation observed previously (Wang et al, 2006; Vassylyev et al, 2007), and the central bridge helix moved away from the trigger loop by up to 1.5 Å. In the 6-nt structure with AMPCPP, the closed trigger loop was best ordered (Figure 6), although in all structures densities for the alternative open conformation were also observed, consistent with two defined, rapidly inter-converting states of the trigger loop. Whereas the part of the trigger loop that interacts with the NTP was well defined (residues 1078–1083), the part of the trigger loop facing away from the NTP remained mobile (residues 1084–1092).
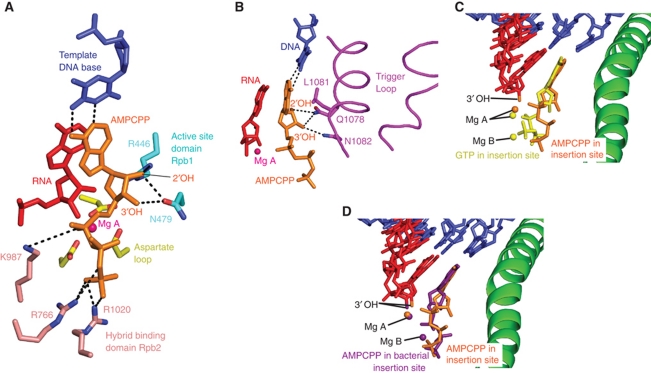
Figure 6.
NTP positions and contacts. (A) Contacts of AMPCPP with active site residues of Pol II in the 6-nt RNA structure. (B) Contacts of the AMPCPP in (A) with the closed trigger loop (magenta). (C) Comparison of AMPCPP substrates in the Pol II 6-nt RNA structure (orange) and in the bacterial RNA polymerase EC (violet) (Vassylyev et al, 2007). (D) Comparison of AMPCPP in the 6-nt RNA Pol II structure (orange) and a GTP in the Pol II EC with a non-reactive RNA lacking the 3′-OH group (yellow) (Wang et al, 2006).
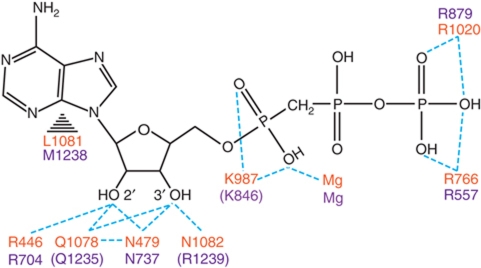
We used this structure to analyse NTP interactions with Pol II and nucleic acids, and for comparisons with previous NTP-containing structures (Figures 6 and 7). As described (Wang et al, 2006; Vassylyev et al, 2007), the NTP base stacked between the −1 RNA base and L1081 of the trigger loop (corresponding to M1238 in Thermus thermophilus RNA polymerase). The NTP triphosphate interacts with the conserved Rpb2 residues R766 and R1020 (Figure 6A). The NTP position and interactions are essentially identical in the previous structure of a bacterial RNA polymerase EC with AMPCPP (Vassylyev et al, 2007) (Figures 6C and 7), indicating a universally conserved mechanism of nt selection and incorporation fidelity in all cellular RNA polymerases.
Figure 7.
Schematic representation of NTP contacts. Pol II residues are in orange, bacterial RNAP residues in purple (Vassylyev et al, 2007). Dotted lines indicate contacts between protein residues and AMPCPP atoms. Residues are grouped according to their conservation of structural position. Brackets indicate bacterial residues that do not contact AMPCPP.
NTP/dNTP discrimination
Contacts of the 2′-OH group of the NTP ribose moiety with Pol II explain how NTPs are discriminated from dNTPs. The NTP 2′-OH contacts the side chains of Rpb1 residues R446, N479, and Q1078, the latter being part of the trigger loop (Figure 6A and B). The counterpart residues of Rpb1 residues R446 and N479, β′-subunit residues R704 and N737 in T. thermophilus RNA polymerase, were proposed to select NTPs over dNTPs (Vassylyev et al, 2007), and the invariant asparagine was shown to function in NTP over dNTP selection (Svetlov et al, 2004). Contacts of N479 with the 2′-OH were, however, not observed in a previous Pol II structure with bound NTP (Wang et al, 2006), likely because a non-reactive RNA that lacked the 3′-OH group was used that may have stabilized a slightly different conformation.
In our structure, the NTP is positioned slightly closer to the active site (Figure 6D), and the contact between N479 and the 2′-OH is observed. In addition to N479 and R446, NTP/dNTP discrimination may involve the trigger loop residue Q1078, which could couple the presence of an NTP with a 2′-OH group to closing of the trigger loop, thereby restricting catalysis to NTPs and explaining the role of the trigger loop in NTP selection and transcription fidelity (Wang et al, 2006). Deletion of the trigger loop in Escherichia coli resulted in a 100-fold decrease in selectivity of ATP over dATP (Zhang et al, 2010) and mutation of Q1078 to either asparagine or serine is lethal in yeast (Kaplan et al, 2008), consistent with a key role of this residue in NTP/dNTP discrimination.
Discussion
Here, we report 11 crystallographic snapshots that elucidate initial Pol II transcription. A structure of a Pol II–DNA complex that mimics the OC reveals that Pol II can bind free DNA that resembles a melted promoter, with the downstream duplex in the active centre cleft and the template single strand opposite the active site. This DNA-binding site apparently corresponds to a downstream DNA site that was inferred from biochemical studies of bacterial RNA polymerase (Nudler et al, 1998), and likely traps downstream DNA in the cleft during extension of the DNA bubble downstream to the transcription start site (Mekler et al, 2011). The site for the template single strand apparently serves to position the first two NTPs, directing RNA chain initiation. We could not trap this initiating complex, but a related intermediate was structurally resolved for RNA polymerases of bacteriophages T7 (Kennedy et al, 2007) and N4 (Gleghorn et al, 2011). After formation of the first phosphodiester bond, the 2-nt RNA product is translocated, to free the NTP site and stabilize the template strand. We could trap the corresponding structure, and observed that two invariant lysine residues bind the 2-nt RNA.
We further resolved complexes with 4, 5, 6, and 7 nt RNAs, which mimic ITCs on the pathway from the OC to the EC. In these complexes, a tilted DNA–RNA hybrid occludes the site for the templating +1 DNA nt, but leaves the NTP site free. Binding of the NTP substrate to the tilted complexes induces the standard conformation of the hybrid and stabilizes the fully post-translocated state. By soaking ITC crystals with an NTP analogue, we observed that NTP binding can complete DNA translocation. NTP binding leads to translocation of the template strand by one position and insertion of the templating +1 nt into the active centre, where it basepairs with the NTP. Comparison of these minimal ITC structures reveals that the RNA transcript always occupies a similar position with its 3′-end at the active site metal ion A, whereas the DNA template strand and downstream DNA can adopt different positions. This keeps the RNA 3′-end aligned with the active site, as required for catalysis, whereas DNA plasticity may help to stabilize the transient ITCs by optimizing polymerase–nucleic acid contacts. The tilted hybrid conformation may compensate for the reduced binding affinity of a shorter hybrid, thus assisting in the formation of early transcripts. Whether the tilted conformation is part of the translocation pathway (Tagami et al, 2010) or rather an off-line state that is suppressed by NTP binding remains unclear, although we favour the latter.
Whereas the 4–7 nt RNA-containing complexes show similar structures and behave similarly upon NTP binding, we observed an exceptional behaviour of 2 and 3 nt RNA-containing complexes that may be related to abortive transcription. In the ITC structure with the 2-nt RNA, the hybrid is not in the tilted conformation, and we were unable to trap an ITC with a 3-nt RNA. Although it cannot be excluded that these observations result from the use of a different DNA sequence, we suggest that they are related to the phenomenon of abortive transcription. It has been observed in initiation assays with human Pol II that a dinucleotide primer can be extended accurately by 1 nt and that the resulting trimers are released as abortive transcripts (Luse and Jacob, 1987). We suggest that it is the intrinsic unstable nature of the 3-nt RNA-containing ITC that has prevented us from trapping this state and is responsible to a large extent for abortive transcription.
Analysis of the NTP contacts with Pol II indicates a universally conserved mechanism of NTP selection in all cellular RNA polymerases. Whereas contacts of the NTP base with the DNA template ensure that the cognate NTP is selected, contacts of the ribose 2′-OH group with invariant polymerase residue N479, and likely the trigger loop residue Q1078, ensure selection of NTPs over dNTPs. The contact of the 2′-OH group with trigger loop residue Q1078 was not observed before, whereas the contact with N479 was observed in the bacterial but not in the eukaryotic system. Comparisons with previous structures of ECs with bound NTP (Kettenberger et al, 2004; Wang et al, 2006; Vassylyev et al, 2007) indicate that the exact positioning of the NTP depends on the experimental design. To prevent catalysis in the crystal, one must either use a non-reactive NTP analogue or remove the RNA 3′-OH group. In the latter case, the triphosphate and ribose are closer to the active site metal A, and the NTP/dNTP discriminating contact with N479 is not observed. These observations are consistent with a two-step mechanism for nt incorporation. NTPs are first sampled in the pre-insertion state in an open active centre conformation. Only the cognate, 2′-OH-containing NTP induces trigger loop closing, resulting in a catalytically competent conformation and phosphodiester bond formation.
After this work was completed, a publication by the Kornberg laboratory described Pol II–nucleic acid structures that correspond to our structures with 4, 5, 6, 7 nt RNAs with and without NTP substrate. A comparison of our results with those obtained by Liu et al (2011) reveals four general differences. First, we used the complete 12-subunit Pol II, whereas Liu et al used the 10-subunit Pol II core enzyme. Second, the downstream duplex was visible in our structures, but is disordered in the structures by Liu and coworkers. Third, TFIIB was not required in our experiments to generate ITCs, whereas Liu et al used TFIIB for crystallization, although they did not observe TFIIB binding in crystals. Forth, we have additionally resolved structures with DNA alone and with 2 nt RNA, both with and without NTP, providing evidence that Pol II is able to bind free DNA and a very short hybrid with some stability, in contrast to a conclusion reached by Liu and coworkers.
A detailed comparison of our ITC-mimetic structures with the structures by Liu et al reveals generally good agreement, and a similar change induced by NTP binding. However, the corresponding structures with 4 and 5 nt RNA differ in the modelling of the nucleic acids. After superposition of the Rpb1 subunits, the hybrid backbones and base positions are virtually identical (Figure 4D). However, our structures show tilted Watson-Crick basepairs throughout the hybrid, whereas the structures by Liu et al contain mismatches (Figure 4E) that were described as distorted basepairs. Since the DNA and RNA sequences used by Liu et al are complementary, matched basepairs could be obtained if the DNA template strand would be shifted by one register. Since Liu et al labelled the RNA, rather than the DNA, as done here, it is possible that the DNA template strand register may be shifted in the published 4 and 5 nt structures (PDB codes 3RZO, 3RZD). If so, the results obtained by Liu and coworkers and us would essentially be the same, with one difference. The transition from a tilted hybrid to the normal hybrid conformation occurs for the 8-nt RNA in our work, whereas it occurs already for the 6-nt RNA in the study by Liu and coworkers, but this is likely due to differences in the nucleic acid sequences.
Materials and methods
Saccharomyces cerevisiae 12-subunit Pol II was prepared as described (Sydow et al, 2009). Purified Pol II (∼3.5 mg ml−1) was mixed with a two-fold molar excess of nucleic acid scaffold prepared as described (Kettenberger et al, 2004) and incubated for 1 h at 20°C before crystallization by hanging drop vapour diffusion with 4–7% PEG 6000, 200 mM ammonium acetate, 300 mM sodium acetate, 50 mM HEPES pH 7.0 and 5 mM TCEP as reservoir solution. Crystals were grown for 5–10 days, cryo-protected in mother solution supplemented with 22% glycerol, followed by overnight incubation at 8°C before harvesting and freezing in liquid nitrogen. For the Pol II complex with dinucleotide RNA, crystals of the binary complex were soaked for 10 min in cryo protectant supplemented with 35 mM 5′-CA-3′ dinucleotide before freezing. For complexes containing AMPCPP/GMPCPP, Pol II was co-crystallized with nucleic acids in the presence of 8 mM magnesium chloride and were soaked with NTP ligand by including 2 mM AMPCPP/GMPCPP in all cryo protectant solutions. Diffraction data were collected at 100 K at beamline X06SA of the Swiss Light Source or beamline ID29 of the European Synchrotron Radiation Facility, and structures were solved with molecular replacement using the 12-subunit Pol II structure (1WCM) in program PHASER (McCoy et al, 2007). Data were collected at 13.494 keV, the K-absorption peak of bromine. Diffraction images were processed with XDS (Kabsch, 2010) and MOSFLM/SCALA (CCP4, 1994), and models built with COOT (Emsley and Cowtan, 2004). Refinement was carried out with autoBUSTER (Bricogne et al, 2011) and phenix.refine (Adams et al, 2010).
Accession codes
Coordinates and structure factors for the described Pol II–nucleic acid complexes have been deposited with the protein data bank under the accession codes provided in Table I.
Supplementary Material
Acknowledgments
We thank Kerstin Kinkelin for assistance with crystallization and data collection. S Sainsbury was supported by a postdoctoral fellowship from the Alexander-von-Humboldt Foundation. We acknowledge support of the crystallization facility at the Max-Planck-Institute of Biochemistry in Martinsried. Part of this work was conducted at the protein crystallography beamlines of the Swiss Light Source in Villingen, Switzerland. PC was supported by the Deutsche Forschungsgemeinschaft, SFB646, TR5, FOR1068, SFB960, NIM, the European Molecular Biology Organization (EMBO), an Advanced Investigator Grant of the European Research Council, LMUexcellent research professorship ‘Molecular systems biology of gene regulation’, the LMUinnovativ project Bioimaging Network (BIN), and the Jung-Stiftung.
Author contributions: ACMC and SS carried out the experiments. PC supervised the project. ACMC, SS, and PC prepared the manuscript.
Footnotes
The authors declare that they have no conflict of interest.
References
- Adams PD, Afonine PV, Bunkoczi G, Chen VB, Davis IW, Echols N, Headd JJ, Hung LW, Kapral GJ, Grosse-Kunstleve RW, McCoy AJ, Moriarty NW, Oeffner R, Read RJ, Richardson DC, Richardson JS, Terwilliger TC, Zwart PH (2010) PHENIX: a comprehensive Python-based system for macromolecular structure solution. Acta Crystallogr D Biol Crystallogr 66: 213–221 [DOI] [PMC free article] [PubMed] [Google Scholar]
- Andrecka J, Treutlein B, Arcusa MA, Muschielok A, Lewis R, Cheung AC, Cramer P, Michaelis J (2009) Nano positioning system reveals the course of upstream and nontemplate DNA within the RNA polymerase II elongation complex. Nucleic Acids Res 37: 5803–5809 [DOI] [PMC free article] [PubMed] [Google Scholar]
- Armache KJ, Mitterweger S, Meinhart A, Cramer P (2005) Structures of complete RNA polymerase II and its subcomplex, Rpb4/7. J Biol Chem 280: 7131–7134 [DOI] [PubMed] [Google Scholar]
- Bricogne G, Blanc E, Brandl M, Flensburg C, Keller P, Paciorek W, Roversi P, Sharff A, Smart OS, Vonrhein C, Womack TO (2011) autoBUSTER. Global Phasing Limited [Google Scholar]
- Brueckner F, Hennecke U, Carell T, Cramer P (2007) CPD damage recognition by transcribing RNA polymerase II. Science 315: 859–862 [DOI] [PubMed] [Google Scholar]
- CCP4 (1994) The CCP4 suite: programs for protein crystallography. Acta Crystallogr D Biol Crystallogr 50: 760–763 [DOI] [PubMed] [Google Scholar]
- Cheung AC, Cramer P (2011) Structural basis of RNA polymerase II backtracking, arrest and reactivation. Nature 471: 249–253 [DOI] [PubMed] [Google Scholar]
- Emsley P, Cowtan K (2004) Coot: model-building tools for molecular graphics. Acta Crystallogr D Biol Crystallogr 60: 2126–2132 [DOI] [PubMed] [Google Scholar]
- Gleghorn ML, Davydova EK, Basu R, Rothman-Denes LB, Murakami KS (2011) X-ray crystal structures elucidate the nucleotidyl transfer reaction of transcript initiation using two nucleotides. Proc Natl Acad Sci USA 108: 3566–3571 [DOI] [PMC free article] [PubMed] [Google Scholar]
- Gnatt AL, Cramer P, Fu J, Bushnell DA, Kornberg RD (2001) Structural basis of transcription: an RNA polymerase II elongation complex at 3.3 A resolution. Science 292: 1876–1882 [DOI] [PubMed] [Google Scholar]
- Kabsch W (2010) Xds. Acta Crystallogr D Biol Crystallogr 66: 125–132 [DOI] [PMC free article] [PubMed] [Google Scholar]
- Kadesch TR, Chamberlin MJ (1982) Studies of in vitro transcription by calf thymus RNA polymerase II using a novel duplex DNA template. J Biol Chem 257: 5286–5295 [PubMed] [Google Scholar]
- Kaplan CD, Larsson KM, Kornberg RD (2008) The RNA polymerase II trigger loop functions in substrate selection and is directly targeted by alpha-amanitin. Mol Cell 30: 547–556 [DOI] [PMC free article] [PubMed] [Google Scholar]
- Kennedy WP, Momand JR, Yin YW (2007) Mechanism for de novo RNA synthesis and initiating nucleotide specificity by t7 RNA polymerase. J Mol Biol 370: 256–268 [DOI] [PubMed] [Google Scholar]
- Kettenberger H, Armache KJ, Cramer P (2004) Complete RNA polymerase II elongation complex structure and its interactions with NTP and TFIIS. Mol Cell 16: 955–965 [DOI] [PubMed] [Google Scholar]
- Kostrewa D, Zeller ME, Armache KJ, Seizl M, Leike K, Thomm M, Cramer P (2009) RNA polymerase II-TFIIB structure and mechanism of transcription initiation. Nature 462: 323–330 [DOI] [PubMed] [Google Scholar]
- Liu X, Bushnell DA, Silva DA, Huang X, Kornberg RD (2011) Initiation complex structure and promoter proofreading. Science 333: 633–637 [DOI] [PMC free article] [PubMed] [Google Scholar]
- Liu X, Bushnell DA, Wang D, Calero G, Kornberg RD (2010) Structure of an RNA polymerase II-TFIIB complex and the transcription initiation mechanism. Science 327: 206–209 [DOI] [PMC free article] [PubMed] [Google Scholar]
- Luse DS, Jacob GA (1987) Abortive initiation by RNA polymerase II in vitro at the adenovirus 2 major late promoter. J Biol Chem 262: 14990–14997 [PubMed] [Google Scholar]
- McCoy AJ, Grosse-Kunstleve RW, Adams PD, Winn MD, Storoni LC, Read RJ (2007) Phaser crystallographic software. J Appl Crystallogr 40: 658–674 [DOI] [PMC free article] [PubMed] [Google Scholar]
- Mekler V, Minakhin L, Severinov K (2011) A critical role of downstream RNA polymerase-promoter interactions in the formation of initiation complex. J Biol Chem 286: 22600–22608 [DOI] [PMC free article] [PubMed] [Google Scholar]
- Murakami KS, Masuda S, Campbell EA, Muzzin O, Darst SA (2002) Structural basis of transcription initiation: an RNA polymerase holoenzyme-DNA complex. Science 296: 1285–1290 [DOI] [PubMed] [Google Scholar]
- Nudler E, Gusarov I, Avetissova E, Kozlov M, Goldfarb A (1998) Spatial organization of transcription elongation complex in Escherichia coli. Science 281: 424–428 [DOI] [PubMed] [Google Scholar]
- Roeder RG (1996) The role of general initiation factors in transcription by RNA polymerase II. Trends Biochem Sci 21: 327–335 [PubMed] [Google Scholar]
- Svetlov V, Vassylyev DG, Artsimovitch I (2004) Discrimination against deoxyribonucleotide substrates by bacterial RNA polymerase. J Biol Chem 279: 38087–38090 [DOI] [PMC free article] [PubMed] [Google Scholar]
- Sydow JF, Brueckner F, Cheung AC, Damsma GE, Dengl S, Lehmann E, Vassylyev D, Cramer P (2009) Structural basis of transcription: mismatch-specific fidelity mechanisms and paused RNA polymerase II with frayed RNA. Mol Cell 34: 710–721 [DOI] [PubMed] [Google Scholar]
- Tagami S, Sekine S, Kumarevel T, Hino N, Murayama Y, Kamegamori S, Yamamoto M, Sakamoto K, Yokoyama S (2010) Crystal structure of bacterial RNA polymerase bound with a transcription inhibitor protein. Nature 468: 978–982 [DOI] [PubMed] [Google Scholar]
- Vassylyev DG, Vassylyeva MN, Zhang J, Palangat M, Artsimovitch I, Landick R (2007) Structural basis for substrate loading in bacterial RNA polymerase. Nature 448: 163–168 [DOI] [PubMed] [Google Scholar]
- Wang D, Bushnell DA, Westover KD, Kaplan CD, Kornberg RD (2006) Structural basis of transcription: role of the trigger loop in substrate specificity and catalysis. Cell 127: 941–954 [DOI] [PMC free article] [PubMed] [Google Scholar]
- Westover KD, Bushnell DA, Kornberg RD (2004) Structural basis of transcription: separation of RNA from DNA by RNA polymerase II. Science 303: 1014–1016 [DOI] [PubMed] [Google Scholar]
- Zhang J, Palangat M, Landick R (2010) Role of the RNA polymerase trigger loop in catalysis and pausing. Nat Struct Mol Biol 17: 99–104 [DOI] [PMC free article] [PubMed] [Google Scholar]
- Zhang Z, Dietrich FS (2005) Mapping of transcription start sites in Saccharomyces cerevisiae using 5′ SAGE. Nucleic Acids Res 33: 2838–2851 [DOI] [PMC free article] [PubMed] [Google Scholar]
Associated Data
This section collects any data citations, data availability statements, or supplementary materials included in this article.


