Abstract
1,3-Butadiene (BD) is an important industrial chemical that is classified as a human carcinogen. BD carcinogenicity has been attributed to its metabolism to several reactive epoxide metabolites and formation of the highly mutagenic 1,2:3,4-diepoxybutane (DEB) has been hypothesized to drive mutagenesis and carcinogenesis at exposures experienced in humans. We report herein the formation of DEB-specific N,N-(2,3-dihydroxy-1,4-butadiyl)valine (pyr-Val) in BD-exposed workers as a biomarker of DEB formation. pyr-Val was determined in BD monomer and polymer plant workers that had been previously analyzed for several other biomarkers of exposure and effect. pyr-Val was detected in 68 of 81 (84%) samples ranging from 0.08 to 0.86 pmol/g globin. Surprisingly, pyr-Val was observed in 19 of 23 administrative control subjects not known to be exposed to BD, suggesting exposure from environmental sources of BD. The mean ± SD amounts of pyr-Val were 0.11 ± 0.07, 0.16 ± 0.12, and 0.29 ± 0.20 pmol/g globin in the controls, monomer, and polymer workers, respectively, clearly demonstrating formation of DEB in humans. The amounts of pyr-Val found in this study suggest that humans are much less efficient in the formation of DEB than mice or rats at similar exposures. Formation of pyr-Val was more than 50-fold lower than has been associated with increased mutagenesis in rodents. The results further suggest that formation of DEB relative to other epoxides is significantly different in the highest exposed polymer workers compared with controls and BD monomer workers. Whether this is due to saturation of metabolic formation or increased GST-mediated detoxification could not be determined.
Keywords: biomonitoring, exposure response, risk assessment, exposure assessment, 1,3-butadiene; globin adducts
1,3-Butadiene (BD) is an important industrial chemical heavily used in the production of synthetic rubber and resins (Himmelstein et al., 1997), and a byproduct of incomplete combustion found in cigarette smoke, auto exhaust, and fossil fuels (Agency for Toxic Substances and Disease Registry [ATSDR], 1992). BD has been recently rated the cigarette constituent with the highest cancer risk index (Fowles and Dybing, 2003). Most agencies have classified BD as a human carcinogen based on evidence from epidemiology and animal studies (ATSDR, 1992; International Agency for Research on Cancer [IARC], 2008; National Toxicology Program, 2005; U.S. EPA Office for Research and Development, and National Center for Environmental Assessment, 2002). The 2008 IARC Working Group categorized BD as “carcinogenic to humans” (group 1), on the basis of “sufficient evidence” in humans of an increased risk for leukemia (IARC, 2008).
BD requires metabolic activation to several epoxide metabolites that are known to bind to DNA and proteins. Subsequently, the mode of action is assumed to be that of a DNA-reactive compound, and the corresponding key events have been outlined by Preston (2007), based on the U.S. EPA guidelines for cancer risk assessment. Formation of promutagenic DNA adducts leading to mutations represents the causal link between exposure and tumor development (Kirman et al., 2010; Preston, 2007). In rodent cancer studies, BD has been shown to be a multisite carcinogen in both rats and mice, with vastly different cancer potencies in the two species. In mice, tumors arise at exposure concentrations as low as 13.8 mg/m3 (6.25 ppm), whereas in rats, the tumor inducing concentrations have been at 1000 ppm and higher, although lower exposures have not been evaluated. This species difference in tumorigenesis has been attributed to differences in BD metabolism.
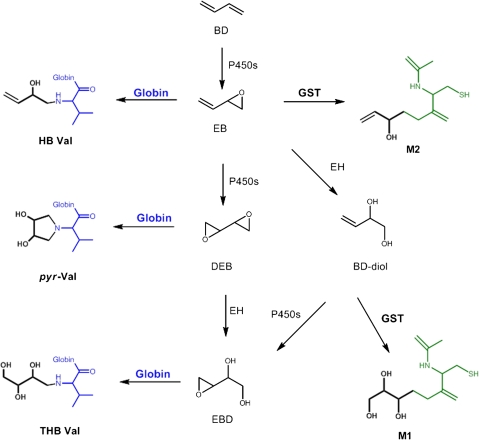
BD is metabolized primarily by P450 2E1 to 1,2-epoxybutene (EB), 1,2:3,4-diepoxybutane (DEB), and 3,4-epoxy-1,2-butanediol (EB-diol) that produce various hemoglobin adducts shown in Figure 1 (Himmelstein et al., 1997). EB produces N-(2-hydroxy-3-buten-1-yl)-valine (HB-Val) and DEB forms N,N-(2,3-dihydroxy-1,4-butadiyl)-valine (pyr-Val) and 2,3,4-trihydroxybutyl-valine (THB-Val). The later adduct is primarily formed from EB-diol and is present in unexposed animals and humans from endogenous sources (Koc et al., 1999). BD-derived epoxides differ in their mutagenic potency up to 200-fold, with DEB being the most mutagenic metabolite (Meng et al., 2007; Walker et al., 2009). Therefore, to improve the scientific basis of BD risk assessment, it is important to have detailed knowledge of the internal formation of each potentially mutagenic metabolite and its dependence on species, gender, and exposure concentrations.
FIG. 1.
Overview of BD metabolism and formation of N-terminal valine adducts and urine metabolites.
THB-Val and HB-Val adducts can be readily measured using the modified Edman degradation followed by liquid-liquid extraction and analysis by gas chromatography-mass spectrometry (GC-MS) or GC-MS/MS (Booth et al., 2004; Powley et al., 2005; Törnqvist et al., 1986). Unfortunately, the presence of a tertiary amine makes pyr-Val unsuitable for analysis by Edman degradation. Therefore, a proteomics approach using trypsin digestion was established for the analysis of pyr-Val in rodents (Boysen et al., 2004; Kautiainen et al., 2000). Utilizing this methodology, Georgieva et al. recently reported a comprehensive exposure-response on the formation of DEB-specific pyr-Val adducts in mice and rats (Georgieva et al., 2010). The formation of DEB was shown to be much less prominent in rats than mice, with only 10% of the murine DEB formed in similarly exposed rats (Georgieva et al., 2010). This is in agreement with greater formation of EB-derived HB-Val and EB-diol-derived THB-Val adducts in mice compared with rats exposed similarly (Boysen et al., 2007). The formation of DEB correlated well with BD-induced mutation frequencies in the hypoxanthine guanine phosphoribosyl transferase (HRPT) gene of rodents, suggesting that DEB is the ultimate carcinogenic metabolite at the exposures studied (Georgieva et al., 2010).
In parallel, studies in BD-exposed workers were conducted to correlate biomarkers of exposure with biomarkers of effect, utilizing HB-Val and THB-Val as biomarkers for BD exposure and metabolism (Albertini et al., 2003; Swenberg et al., 2008, 2011; Vacek et al., 2010 [recently reviewed by Albertini et al. (2010)]). Results have been fairly consistent regarding hemoglobin adducts and urinary metabolites, both of which have been found to be useful biomarkers of exposure and probes for identifying underlying metabolic pathways. However, results have been conflicting as to the induction of mutational events in reporter genes of lymphocytes of occupationally exposed workers or the importance of genotypes in conferring susceptibility to these events (Albertini et al., 2003). Noteworthily, at that time, there were no biomarkers available to measure production of the highly mutagenic DEB in humans. However, since then, an assay for quantitation of the DEB-specific pyr-Val has been developed, validated, and successfully applied to mice and rats exposed to various concentrations of BD (Boysen et al., 2004; Georgieva et al., 2010). We report herein the extension of this methodology to humans and demonstrate for the first time the presence of pyr-Val in BD-exposed workers.
Cryopreserved red blood cells were available from male workers in monomer production and polymerization facilities in the Czech Republic (Albertini et al., 2003). The study included extensive external exposure assessments, with individual worker measurements being made by personal monitors over 8-h work shifts on an average of 10 workdays over several months preceding biological sample acquisitions (Albertini et al., 2003). Specimens had previously been analyzed for protein adducts (HB-Val and THB-Val), urinary biomarkers, mutation in HPRT gene, and chromosome aberrations (Albertini et al., 2003). Urine metabolites and hemoglobin adducts (HB-Val and THB-Val) were both highly correlated with external exposure concentrations, with protein adducts being the best-correlated biomarkers of exposure. In addition to serving as internal dosimeters, these biomarkers also reflected BD metabolic pathways in these workers. In contrast, biomarkers of effect did not show increases in frequencies of gene mutations, measured at the HPRT locus in blood lymphocytes, or of chromosome aberrations, measured by a variety of methods. These biomarker studies were blinded as to BD exposures until data were final. Of the many genotypes evaluated, only that for GST showed an effect, which modulated the relative amounts of the two urinary metabolites.
MATERIALS AND METHODS
Trypsin (biotin-agarose, from bovine pancreas) was purchased from Sigma-Aldrich (St Louis, MO). All reagents and solvents were ACS grade or higher. Centricon 3 filters were obtained from Amicon Inc. (Beverly, MA) and Microspin filter tubes (regenerated cellulose, 0.2 μm) were from Alltech Associates Inc. (Deerfield, IL). Polyclonal antibodies against pyr-Val (1–11) were raised by AnaSpec (San Jose, CA) using a standard peptide synthesized as described previously (Jayaraj et al., 2003).
Human subjects.
Eighty-three subjects were studied for biomarkers of exposures and effect. Of these, 23 were controls (administrative workers), 24 were BD monomer production workers, and 34 were BD polymer production workers (Table 1). Details of the study population have been reported previously (Albertini et al., 2003). The experimental protocol was approved by the Institutional Review Boards at Regional Institute of Hygiene of Central Bohemia, the University of Vermont, and the University of North Carolina at Chapel Hill. Red blood cells were isolated, washed twice with 0.9% saline, diluted 2 × in distilled water, and stored at −80°C before extraction of globin.
TABLE 1.
Hemoglobin Adducts (pmol/g) by Group
| BD exposure | HB-Val | pyr-Val | THB-Val | Relative Adduct Amounts (%) |
|||
| mg/m3 (ppm) | Mean ± SD | Mean ± SD | Mean ± SD | HB-Val | pyr-Val | THB-Val | |
| Controls (n = 23) | 0.023 (0.01) | 0.22 ± 0.20 | 0.11 ± 0.07 | 95.0 ± 38.7 | 0.26 | 0.13 | 99.61 |
| Monomer (n = 24) | 0.64 (0.29) | 0.47 ± 0.45 | 0.16 ± 0.12 | 179 ± 101a | 0.26 | 0.11 | 99.63 |
| Polymerization (n = 34) | 1.79 (0.81) | 2.23 ± 1.40 | 0.29 ± 0.20a,b | 716 ± 426a,b | 0.33a | 0.05a,b | 99.62 |
Significantly different from controls; p < 0.05 by K-W test.
Significantly different from monomer production workers; p < 0.05 by K-W test.
Exposure assessment.
BD exposures were determined by personal monitoring tubes for 8-h work shifts on 10 separate occasions over a 4-month interval for each study subject. Ambient air samples were also analyzed for BD concentrations. Coexposures to toluene, styrene, and benzene were measured by personal monitoring in a subset of subjects on a single occasion and by ambient air sampling (Albertini et al., 2003).
Quantitation of pyr-Val.
Amounts of pyr-Val were measured based on a procedure described by Boysen et al. (2004) using peptide standards that had been quantified accurately as described by Bordeerat et al. (2009). In brief, globin isolation was performed according to Mowrer et al. (1986). Globin samples of 50 mg were dissolved in 1.5 ml of 0.1M NH4HCO3, and 2 pmol of internal standard [2H3]N,N-(2,3-dihydroxy-1,4-butadyil)-valine (1–11) peptide was added. Samples were digested for 24 h at 37°C with 100 μl of trypsin-biotin-agarose suspension (washed in advance twice with 0.1M NH4HCO3). After Centricon 3 filtration, samples were dried and redissolved in 600 μl PBS buffer, loaded on immunoaffinity (IA) columns, and left capped for 1 h. After extensive washing with distilled water (5 × 7 ml) and elution in 3 ml of 5% formic acid, followed by sample drying, filtration on Microspin filters, and final drying, samples were stored at −20°C until analysis by nano-ultra high pressure liquid chromatography tandem mass spectrometry (UPLC-MS/MS).
Liquid chromatography and mass spectrometry.
The quantitative analysis of the pyr-Val and [2H3]pyr-Val by nano-UPLC-MS/MS was performed with an nano-UPLC (Waters, Milford, MA) coupled to a TSQ-Quantum Ultra Triple Quad Mass Analyzer (ThermoFinnigan, San Jose, CA). The system utilized a 2.0 × 20 mm Symmetry C18, 5 μm column (Waters) as “trap column” for samples loading at 15 μl/min 15 mM ammonium formate-0.7% formic acid. After sample loading, the flow rate was reduced to 1.2 μl/min, and the column exit flow was directed to an “analytical column” consisting of a 100 μm × 100 mm BEH C18 UPLC column (Waters). pyr-Val and [2H3]-pyr-Val were eluted with a linear gradient of 5% 15mM ammonium formate-0.7% formic acid, for 2 min then to 70% acetonitrile-0.1% formic acid, in 10 min, at a flow rate of 1.2 μl/min. The retention times for the analyte and internal standard were determined with authentic standards. pyr-Val and [2H3]pyr-Val were detected in selected reaction monitoring mode, monitoring the transitions of the double charged ions to the a1-fragment (m/z 417.25 to 158.25 and m/z 418.75 to 158.75, for analyte and internal standard, respectively). The electrospray conditions were: spray voltage of 1800 V and capillary temperature of 240°C. Collision energy was 28 V.
Statistical analysis.
The three groups (control, monomer and polymer workers) were compared using the nonparametric Kruskal-Wallis (K-W) test. Pairwise differences were assessed by Mann-Whitney tests using a Bonferroni adjustment for multiple comparisons. Two-way Spearman’s rank correlation coefficients were computed to assess bivariate associations of pyr-Val with BD exposure measurements and biomarkers of exposure and effect. These nonparametric analyses are robust because they rely on fewer assumptions about the data distributions and are less influenced by outliers than parametric analyses. However, BD exposures, hemoglobin adducts, and urine metabolites appear to be log-normally distributed, so Pearson correlation coefficients were also computed to assess the linearity of their bivariate relationships after logarithmic transformation of the exposure measurements and biomarkers. Multiple regression was used to examine whether the linear relationships differed between metabolic genotypes. These regression analyses included an interaction term to test whether the rate of increase in the biomarker per unit of exposure was modified by genotype. Two-way ANOVA was used to test for interactions between the effects of genotype and exposure group.
RESULTS
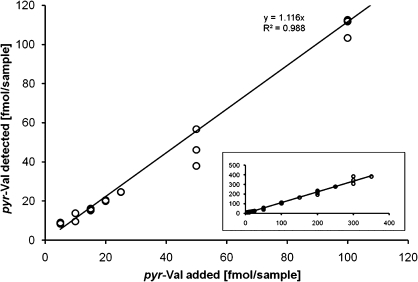
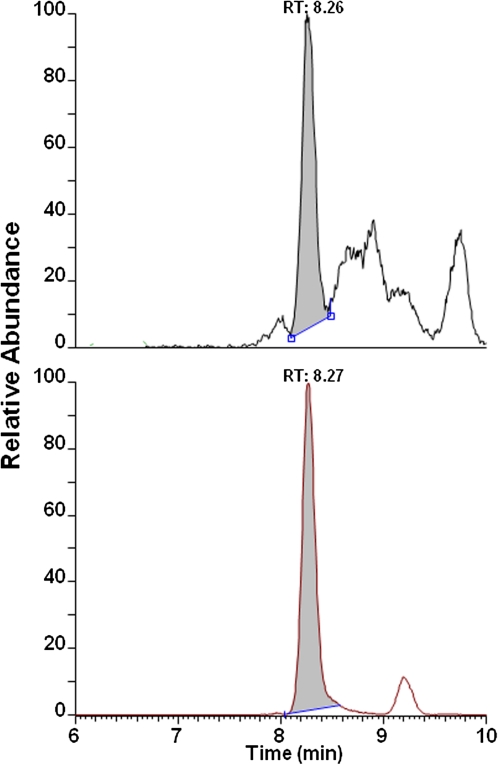
The previously established capillary liquid chromatography LC-MS/MS method for mice and rats was extended and validated for analyses of human globin. Therefore, globin from a volunteer with no detectable amounts of pyr-Val was spiked with various amounts of synthetic human pyr-Val (1–11) peptide standard. It was previously reported and herein confirmed that the anti-pyr-Val antibody used for preparation of the IA columns retains pyr-Val from mice, rats, and humans with equal affinity because of the sequence similarity at the N-terminus (Boysen et al., 2004, 2007). The final quantitative analysis was performed with nano-UPLC-MS/MS instead of the reported capillary LC-MS/MS to increase sensitivity by 10-fold. Analysis of control globin spiked with synthetic pyr-Val (1-11) peptide standards before and in parallel with the human globin samples confirmed recoveries of > 97% and precision of > 90% (Fig. 2). Of the 83 subjects, 68 (84%) had quantifiable amounts of pyr-Val ranging from 0.02 to 0.86 pmol/g. A representative ion chromatogram is shown in Figure 3, demonstrating the presence of pyr-Val in humans.
FIG. 2.
Validation curve for detection of pyr-Val in human globin. Human globin from a volunteer that had no detectable amounts of pyr-Val was spiked with various amounts of synthetic pyr-Val standard peptide (1–11) and analyzed as describe in “Materials and Methods.” Shown are the positive controls containing 5–100 fmol/samples representing 0.1–2 fmol pyr-Val/g globin. The insert shows extended positive controls containing up to 350 fmol pyr-Val/sample.
FIG. 3.
Representative ion-chromatogram of pyr-Val from BD-exposed subject. Globin was isolated and analyzed for presence of pyr-Val by immunoaffinity nano-UPLC-MS/MS as described in “Materials and Methods.” The sample shown is from a monomer worker exposed to 3.7 mg/m3 (1.6 ppm) BD TWA and had 0.23 pmol pyr-Val per g globin.
pyr-Val Concentrations Versus BD Exposures
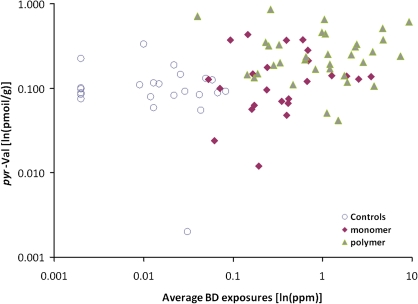
BD exposures in the three worker groups studied, summarized as group mean 8-h TWA concentrations in air measured by personal monitors, were 0.023 mg/m3 (0.01 ppm), 0.64 mg/m3 (0.29 ppm), and 1.79 mg/m3 (0.81 ppm) for the controls, monomer production workers, and polymerization workers, respectively. The corresponding mean pyr-Val adduct concentrations were 0.11 ± 0.07, 0.16 ± 0.12, and 0.29 ± 0.20 pmol/g globin for the 23 controls, 24 monomer production workers, and 35 polymerization workers, respectively (Table 1). The value of 0.29 pmol/g globin for the polymerization workers was significantly greater than the values for the controls or monomer workers (p < 0.05; K-W test). The adduct concentrations for the latter two groups did not differ significantly from each other. There was a significant correlation between pyr-Val concentrations and average BD exposures of individual workers, measured as the mean of each worker’s 10 separate semi-random determinations, when all groups were combined (rho = 0.40, p < 0.001, Fig. 4). There were no significant correlations within either the monomer (rho = 0.24, p = 0.253) or polymerization worker group (rho = 0.05, p < 0.779) when these workers were analyzed separately, even though BD exposures within these groups varied widely (Fig. 4).
FIG. 4.
Associations between individual pyr-Val hemoglobin adduct concentrations (ln[pmol/g]) and 4-month average BD exposure (ln[mg/m3]).
pyr-Val Concentrations Versus HB-Val and THB-Val Concentrations
The pyr-Val concentrations were compared with the previously determined concentrations of HB-Val, reflecting EB levels, and THB-Val, reflecting EB-diol levels, in these workers at the time of study. Group mean ± SD HB-Val concentrations were 0.22 ± 0.21, 0.47 ± 0.45, and 2.23 ± 1.40 pmol/g globin for the controls, monomer production workers, and polymerization workers, respectively, whereas the corresponding THB-Val concentrations were 94.77 ± 38.71, 178.73 ± 101.31, and 716.70 ± 425.72, respectively (Table 1). As reported earlier, the mean concentrations of both HB-Val and THB-Val were significantly higher in the monomer production workers than the controls and in the polymerization workers than in either the controls or monomer production workers (p < 0.05; K-W test). Similarly, both the HB-Val and THB-Val concentrations were significantly correlated with worker average BD exposure levels, measured as the mean of each worker’s multiple separate measurements, when all groups were combined (rho = 0.676, p < 0.001 for HB-Val and rho = 0.737, p < 0.001 for THB-Val). These correlations remained significant within the monomer production and polymerization worker groups for both adducts. The reported values for HB-Val and THB-Val represent the total of both α- and β-chains, whereas pyr-Val is the amount on the α-chain.
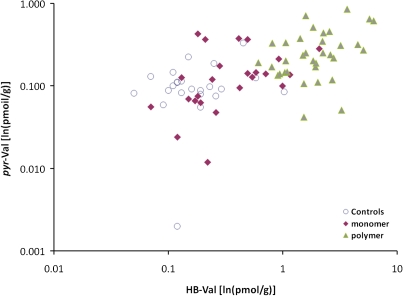
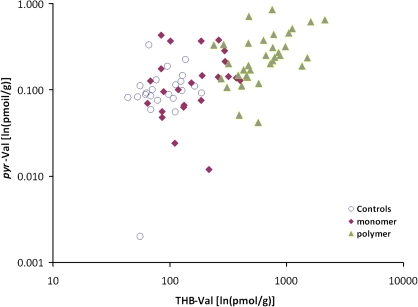
The percentages of the three adducts were computed for each worker and the means for the controls, monomer workers, and polymerization workers are shown in Table 1. For all groups, the mean percent of THB-Val was 99.6%, indicating the dominance of EB-diol formation compared with formation of EB and DEB. The mean percent of HB-Val was 0.26% in both the controls and the monomer workers, about double that of pyr-Val (0.13% and 0.11%, respectively). In the polymerization workers, the mean percent of HB-Val increased to 0.33%, whereas the mean percent of pyr-Val decreased to 0.05%. The decrease in pyr-Val was significantly related to increasing BD exposure levels (rho = 0.404, p = 0.002), but there was no significant correlation between BD exposure and either the percent of HB-Val (rho = 0.106, p = 0.428) or THB-Val (rho = 0.101, p = 0.449). The pyr-Val concentrations in individual workers were significantly correlated with their HB-Val concentrations when the analysis included all subjects combined (rho = 0.59, p < 0.001) and for both the monomer production workers (rho = 0.48, p < 0.05) and the polymerization workers (rho = 0.30, p < 0.05) when workers in these two groups were analyzed separately (Table 2, Fig. 5). pyr-Val concentrations were also significantly correlated with the THB-Val concentrations of individual workers when all subjects were included (rho = 0.60, p < 0.001), but this significant correlation was seen only within the polymerization group (rho = 0.051, p < 0.001) when the groups were analyzed separately (Table 2, Fig. 6).
TABLE 2.
Czech 1 Study: Spearman Correlations Between Hemoglobin Adducts
| Correlation with pyr-Val |
||||
| Control | Monomer | Polymerization | All | |
| HB-Val | 0.10 | 0.48* | 0.36* | 0.59** |
| THB-Val | 0.36 | 0.25 | 0.51** | 0.60** |
*p < 0.05, **p < 0.01.
FIG. 5.
Associations between individual pyr-Val hemoglobin adduct concentrations (ln[pmol/g]) and HB-Val hemoglobin adducts (ln[pmol/g]).
FIG. 6.
Associations between individual pyr-Val hemoglobin adduct concentrations (ln[pmol/g]) and THB-Val hemoglobin adducts (ln[pmol/g]).
pyr-Val Concentrations Versus Urinary Metabolites
The amounts of pyr-Val were further compared with previously determined concentrations of urinary metabolites in these workers (Table 3) (Albertini et al., 2003). After work group mean ± SD concentrations of the M1 metabolite (1,2-dihydroxy-4[N-acetylcysteinyl]-butane), reflecting the EH-mediated hydrolysis detoxification pathway, were 353 ± 157, 764 ± 728, and 4647 ± 6630 μg/l for the controls, monomer production, and polymerization workers, respectively. For the M2 metabolite (isomeric mixture of 1-hydroxy-1-[N-acetylcysteinyl]-3-butene and 2-hydroxy-1-[N-acetylcysteinyl]-3-butene), reflecting the GST-mediated conjugation detoxification pathway, these group mean ± SD after work concentrations were 1.70 ± 1.54, 9.44 ± 12.97, and 120.17 ± 228.17 μg/l for the three worker groups, respectively. The mean urine concentrations of both metabolites were significantly higher in polymerization workers than in control and monomer production workers. In the monomer production workers, these concentrations were significantly higher than in the controls. As reflected in the ratio M1/(M1 + M2), the hydrolysis pathway dominated BD metabolism in these workers, similar to what was reflected by the hemoglobin adducts; the ratios being 0.995, 0.988, and 0.975 for the mean urine metabolite values in the three worker groups, respectively (Table 3). The inverse ratios (M2/[M1 + M2]), reflecting the minor conjugation detoxification pathway, were 0.005, 0.012, and 0.025 in the controls, monomer production workers, and polymerization workers, respectively, suggesting that this pathway was enhanced in the polymer workers (Table 3). Analysis of these ratios by genotype indicated that GST-mediated conjugation of BD metabolites was reduced by both the GST M1 and the GST T1 null genotypes compared with the respective positive genotypes, and this reduction was statistically significant for the GST M1 null workers (data not shown). Both the M1 and the M2 urinary metabolites were significantly correlated with BD exposures of the individual workers, determined as the mean of each worker’s multiple independent exposure measurements, and with both the HB-Val and THB-Val hemoglobin adduct concentrations, when the analysis included all subjects (data previously published and not shown here [Vacek et al., 2010]). These significant correlations persisted when the analysis was within the monomer production or polymerization exposure groups alone (data previously published and not shown (Vacek et al., 2010).
TABLE 3.
After-work Urine Metabolites
| Control | Monomer | Polymerization | |
| Metabolite | Mean ± SD | Mean ± SD | Mean ± SD |
| M1 | 353 ± 157 | 764 ± 728a | 4647 ± 6.63a,b |
| M2 | 1.70 ± 1.54 | 9.44 ± 12.97a | 120.2 ± 228.2a,b |
| M1/(M1 + M2) | 0.995 ± 0.004 | 0.988 ± 0.11a | 0.975 ± 0.967a |
| M2/(M1 + M2) | 0.005 ± 0.004 | 0.012 ± 0.11a | 0.025 ± 0.967a |
Significantly different from controls; p < 0.05 by K-W test.
Significantly different from monomer production workers; p < 0.05 by K-W test.
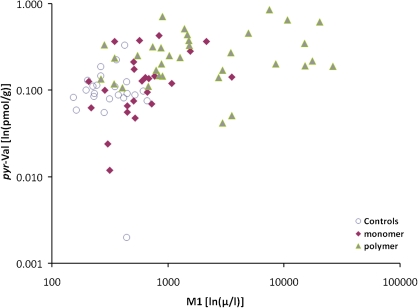
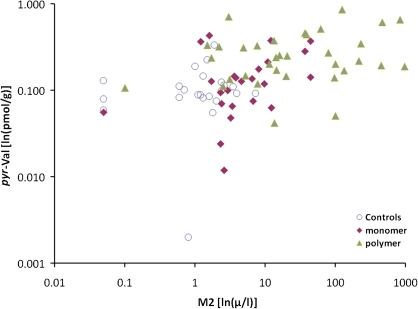
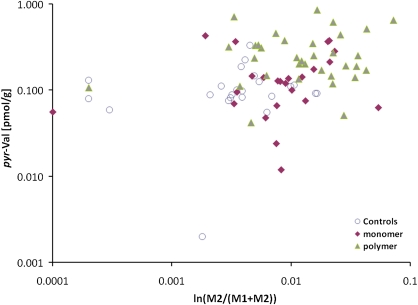
Table 4 and Figures 7–9 show that the pyr-Val concentrations for individual workers were significantly correlated with both the urine M1 and the M2 concentrations, and with the ratio M2/(M1 + M2), when the analysis included all workers in all three groups. However, when worker groups were analyzed separately, only the correlation between pyr-Val and urine M1 concentrations in monomer production workers remained significant (Table 4).
TABLE 4.
Czech 1 Study: Spearman Correlations Between pyr-Val and After-work Urinary Metabolites
| Correlation with pyr-Val |
||||
| Metabolite | Control | Monomer | Polymerization | All |
| M1 | −0.08 | 0.51* | 0.28 | 0.52** |
| M2 | 0.19 | 0.35 | 0.19 | 0.47** |
| M2/(M1 + M2) | 0.30 | 0.23 | 0.06 | 0.34** |
*p < 0.05, **p < 0.01.
FIG. 7.
Associations between individual pyr-Val hemoglobin adduct concentrations (ln[pmol/g]) and urine M1 concentrations (ln[μg/l]).
FIG. 8.
Associations between individual pyr-Val hemoglobin adduct concentrations (ln[pmol/g]) and urine M2 concentrations (ln[μg/l]).
FIG. 9.
Associations between individual pyr-Val hemoglobin adduct concentrations (ln[pmol/g]) and urine M2/(M1 + M2) concentrations (ln[μg/l]).
pyr-Val Concentrations and HPRT Mutations
HPRT mutations were measured previously by both cloning assays and autoradiography (Albertini et al., 2003). There were no significant differences in group mean mutant frequencies (MF determined by cloning) or variant frequencies (VF determined by autoradiography) between the worker groups. Similarly, there were no significant correlations between MFs or VFs and urine metabolites or hemoglobin adducts. For neither of the HPRT mutation assays were the values influenced by worker genotype.
Similar to the correlations with other biomarkers in this study, amounts of pyr-Val from individual workers were unrelated to either MFs (rho = 0.18, p = 0.117) or VFs (rho = −0.26, p = 0.67) when the analysis included all workers in the study. The correlations remained nonsignificant when analysis was limited to each worker group (data not shown).
pyr-Val Concentrations and Chromosome Aberrations
Chromosome aberrations were determined previously by conventional analysis and by fluorescent in situ hybridization (FISH) (Albertini et al., 2003). Two endpoints were measured using conventional techniques, and eight were determined by FISH. In addition, sister chromatid exchanges were measured. Table 5 shows that, when data from all workers were included in the analysis, a significant negative correlation was observed between the number of chromosome breaks per cell determined by conventional techniques and individual worker pyr-Val amounts (rho = 0.22, p < 0.05). This correlation was not seen, however, when the worker groups were analyzed separately. There were no significant correlations between pyr-Val and any of the multiple endpoints determined by FISH (Table 5). However, when analysis was limited to workers within the monomer production worker group, there were significant negative correlations between all FISH endpoints and pyr-Val (Table 5). These significant negative relationships were not seen for the controls or polymerization workers. It is difficult to ascribe these findings to real DEB effects, as evidenced by pyr-Val, on chromosomal changes, given the large number of comparisons made in these analyses.
TABLE 5.
Czech 1: Spearman Correlations Between pyr-Val and Cytogenetic Changes
| Correlation with pyr-Val |
||||
| Assay | Control | Monomer | Polymerization | All Groups |
| Conventional analysisa | ||||
| % Cells with aberrations | 0.22 | 0.03 | 0.22 | 0.17 |
| Breaks per cell | 0.29 | 0.12 | 0.27 | 0.22* |
| Sister chromatid exchangesb | −0.41 | 0.31 | 0.07 | 0.03 |
| FISHc | ||||
| Aberrant chromosomes | −0.22 | −0.47* | 0.11 | −0.04 |
| Translocations | −0.22 | −0.50* | 0.16 | −0.06 |
| Reciprocal translocations | −0.31 | −0.46* | 0.08 | −0.08 |
| Cojunctions | −0.20 | −0.45* | 0.19 | −0.04 |
| FGt/100 | −0.22 | −0.50* | 0.16 | −0.06 |
Samples from one monomer worker lost to analysis.
Samples from seven monomer workers and three polymerization workers lost to analysis.
Samples from one control, one monomer, and one polymerization worker lost to analysis.
*p < 0.05.
pyr-Val Concentrations and Worker Genotypes
Several metabolic genotypes were reported previously for the subjects in this first Czech study (Albertini et al., 2003). These included GST M1, GST T1, CYP2E1 (5′ promoter region), CYP2E1 (intron 6), EH113, EH139, ADH2, and ADH3. In addition, hydrolysis phenotypes were determined by combinations of EH genotypes. As noted above, only the GST genotypes appeared to influence metabolism in this study, that being in the ratio M2/(M1 + M2) and its rate of change with increasing BD exposure levels.
In the current study, none of the polymorphisms studied showed a consistent genotype effect and formation of pyr-Val across the three exposure groups (controls, monomer production workers, polymerization workers) as indicted by a nonsignificant main effect of genotype in two-way ANOVA. In addition, there were no significant interactions between exposure group and genotype. Regression of ln(pyr-Val) on ln(BD) and genotype revealed no significant effects of genotype on the relationship between pyr-Val and BD exposures (data not shown). Similarly, analyses using ln(THB-Val) instead of ln(BD) as the independent exposure variable did not reveal any significant effect of genotype on the relationship between pyr-Val and THB-Val. Hydrolysis phenotypes determined by combinations of EH genotypes had no effect on pyr-Val.
DISCUSSION
Protein adducts derived from BD have been widely used as biomarkers of exposure and metabolic activation applying the modified Edman degradation method (Törnqvist et al., 2002). The formation of N-terminal valine adducts, HB-Val and THB-Val, as biomarkers for EB and EB-diol formation, respectively, demonstrated that adduct formation correlates with BD exposure (Albertini et al., 2003; Boysen et al., 2007). Investigation of HB-Val and THB-Val in mice and rats showed clear species differences in BD metabolism, suggesting that metabolic differences parallel the observed species differences in carcinogenic susceptibility, with mice being most efficient in BD oxidation and more susceptible than rats to BD-induced carcinogenesis (Swenberg et al., 2001). In general, BD is mainly (> 96%) metabolized via the BD-diol pathway in both rodent species. Unfortunately, no in vivo data were available on the formation of pyr-Val in either species until we reported the presence of pyr-Val in mice and rats exposed to BD by inhalation (Boysen et al., 2004) and more recently reported a comprehensive exposure-response for pyr-Val in mice and rats (Georgieva et al., 2010). Interestingly, mice form about 10- to 60-fold more pyr-Val than rats, a difference mirroring the tumor-response data (IARC, 2008). Correlation of protein adducts with mutation frequencies in the HPRT gene was strongest for pyr-Val compared with correlations of MF with HB-Val or THB-Val (Georgieva et al., 2010). This correlation analysis implies that DEB is the ultimate mutagenic and carcinogenic metabolite in rodents. Consequently, it is very important for accurate risk assessment to determine whether humans form pyr-Val and at what rate compared with mice and rats, which were used for cancer bioassays. Therefore, globin samples from the previous molecular epidemiology study of BD-exposed workers in the Czech Republic were analyzed for the presence of pyr-Val. We report herein for the first time the formation of pyr-Val in occupationally exposed workers (Fig. 3). The same samples had already been analyzed for HB-Val and THB-Val and several other biomarkers of exposure and effect allowing multiple comparisons (Albertini et al., 2003).
Surprisingly, 68 of the 83 (84%) samples had quantifiable amounts of pyr-Val ranging from 0.02 to 0.86 pmol/g, and pyr-Val was found in a majority of globin samples from administration workers (control group), suggesting common environmental exposures to BD. This finding was not expected because pyr-Val had previously not been observed in control mice or rats, and DEB is not known to be an endogenous metabolite (Boysen et al., 2004; Georgieva et al., 2010). Current ongoing analyses of additional human globins have confirmed the presence of pyr-Val in subjects not known to be exposed to BD (Swenberg et al., unpublished data). The source of the background amounts of pyr-Val remains to be determined.
Smokers and subjects exposed to secondhand smoke exhale as much as 353 and 14.4 μg/m3 BD (0.16 and 0.0065 ppm BD, respectively) intermittently during a day. Therefore, smoking produces short-term exposures that are lower than the mean average concentration at the workplace (Gordon et al., 2002) or the maximum TWA BD concentration of 39.03 mg/m3 (17.7 ppm) observed in the present study. Environmental BD exposures in the range of 1–4 ppb have been attributed to auto exhaust, which in urban centers can contribute up to 68% of all BD emissions and can reach peak exposures up to 10 ppb (Dollard et al., 2001). Therefore, smoking (active or passive) and auto exhaust in high traffic areas are probably the main nonoccupational sources for BD exposure, followed by emissions from coal, wood, oil, or waste burning (IARC, 2008). In the present study, however, there was no association between smoking status and amounts of pyr-Val, suggesting that in our population, environmental BD exposures, including second hand smoke, may be more important than previously estimated. The mean BD exposure of 10 ppb in the control group was higher than reported for other regions, where exposures range from 0.01 to 1 ppb (IARC, 2008). Whether this high BD exposure in the control group is due to close proximity to the BD monomer and polymerization plant or due to regionally high environmental BD exposures because of traffic or coal heating is unknown. How environmental BD exposures, which were 30- or 3000-fold lower than the mean occupational or short-term smoking related exposures, produced the observed amounts of pyr-Val remains to be determined.
Overall, pyr-Val was significantly correlated with the average BD exposure of individual workers demonstrating that occupational BD exposure does lead to elevated formation of DEB in humans (Fig. 4). This is the first study to demonstrate elevated formation of DEB in occupationally exposed workers. Even though pyr-Val did demonstrate the formation of DEB in occupationally exposed workers, the human response is very different from that of rats and mice. Mice form ∼100-fold greater amounts of DEB when exposed to similar concentrations of BD and rats form ∼10-fold greater amounts than humans (Georgieva et al., 2010). These data demonstrate less efficient formation of DEB in humans compared with rodents exposed to similar BD concentrations and suggest that humans may be less susceptible to BD-induced mutagenesis and carcinogenesis than the test animals used in cancer bioassays. We recently reported a comparative analysis of all three adducts in mouse, rat, and human exposed to similar BD concentrations (Swenberg et al., 2011). Conversion of pyr-Val adducts into EB-equivalents in each species suggest that in humans, DEB contributes significantly less to mutagenic effects than in rodents. Rather, it appears that EB-diol is the major metabolite in humans that is responsible for most of the EB-equivalents in humans.
Biomarkers of effect, such as HPRT mutations and chromosomal damage, did not show an exposure related increase in BD workers. In contrast, mice exposed to BD have clear increases in HPRT mutations at exposures of ≥ 6.25 ppm BD, and rats show similar increases at exposures of ≥ 62.5 ppm (Georgieva et al., 2010). The amount of pyr-Val present following 10 days of 6.25-ppm BD exposure to mice was 75.8 pmol/g globin, whereas rats exposed to 62.5 ppm BD had 47 pmol/g globin. In comparison the highest pyr-Val measurement in this study was 0.86 pmol/g demonstrating that pyr-Val formation is over 50-fold lower in occupationally exposed humans than has been associated with mutagenesis in rodents. More recent exposure assessments in the same plant showed that current BD exposures are even lower (Albertini et al., 2007), suggesting that current risk to BD-induced mutations and cancers in the studied workers is low. As expected, pyr-Val formation did not correlate with MF or VF when analyzing all subjects or individual groups, although the number of chromosome breaks correlated with amounts of pyr-Val when all subjects were included. Thus the BD-exposure studied may produce DEB that form significant amounts of pyr-Val and chromosome breaks, but were insufficient to form permanent mutations.
The individual differences of pyr-Val amounts within each exposure group of 14-, 24-, and 25-fold for control, monomer, and polymerization, respectively, was greater than the mean difference between the groups of 1.8- and 2.4-fold between control and the monomer workers and monomer and polymerization workers, respectively. Such large variability within the groups might be the reason why the mean amounts of pyr-Val were only significantly different between the polymerization workers and the control. Large individual differences of biomarker measurements such as for pyr-Val and relatively small difference between groups have been common in biomarker research, driving the need for larger numbers of subjects per group to obtain significant findings. However, the application of pyr-Val as a predictive biomarker for human cancer risk remains questionable because humans form so little, compared with the other epoxide globin adducts.
On the other hand, analyses of multiple BD-derived protein adducts are expected to give important information about BD exposure and the rates of individual metabolic pathways. Such knowledge might be more predictive for risk phenotypes than individual biomarkers of exposure. Amounts of pyr-Val did correlate with the amounts of HB-Val in the monomer and polymerization workers. Controls and monomer workers formed about two and three times more HB-Val than pyr-Val. In contrast, polymerization workers formed much less (eightfold) pyr-Val than HB-Val, suggesting significantly different rates of conversion of EB to DEB in the polymerization workers compared with the other two groups. The reason for these relative differences in formation of the individual epoxides may relate to saturation of the formation of pyr-Val. In rats, the formation of pyr-Val reaches a plateau after exposures greater than 442 mg/m3 (200 ppm) BD for 10 days (Georgieva et al., 2010). In addition, the slope of pyr-Val formation is lower at exposures greater than 3.32 mg/m3 (1.5 ppm) and 13.8 mg/m3 (6.25 ppm) BD in mice and rats, respectively (Georgieva et al., 2010). Therefore, it is conceivable that formation of pyr-Val may also saturate in humans, but at much lower exposures. Unfortunately, the number of subjects in this study with exposures > 3 mg/m3 (1.4 ppm) was too small to establish a biphasic exposure-response in humans.
BD was mainly (99.6%) metabolized via the BD-diol pathway, as estimated from the percentage of THB-Val to total amounts of N-terminal valine adducts. HB-Val and pyr-Val represented 0.26 and 0.12% of the total amounts of adducts in the control and monomer workers, respectively. Interestingly, this distribution changes significantly for the polymerization workers, where the relative formation of pyr-Val is twofold lower, and formation of HB-Val is increased by 30% (Table 1), whereas the fraction of THB-Val remains unchanged. These changes in adduct distribution are consistent with reduced formation of pyr-Val and subsequent accumulation of HB-Val. Moreover, the ratios of HB-Val/pyr-Val (mean 10.85 ± 11.54 vs. 4.12 ± 3.9, p < 0.001) were significantly different in the polymer workers compared with monomer workers. The exposures in the polymerization plant contained several additional compounds known to alter metabolic rates due to inhibition, induction, or activation. For example, coexposures to compounds like benzene and styrene are likely to compete with BD for activation by P450 2e1 (Hartman et al., submitted). The mean styrene exposure was significantly higher (14-fold) in the polymerization workers (2.12 mg/m3) compared with controls (0.12 mg/m3) and monomer workers (0.15 mg/m3) (Albertini et al., 2003). Adjustment for styrene coexposures did not improve the correlation analyses (data not shown), suggesting that additional confounding factors (e.g., benzene, toluene, and 1-butanol) are present in the polymer exposure group. Conclusively, it appears that the metabolism of BD to epoxides leading to protein adducts is significantly different in polymerization workers, compared with the control group and monomer workers.
In addition to being further oxidized to DEB, EB is metabolized to the N-acetyl cysteine conjugates (NAC) and excreted in the urine. The main pathway is hydrolysis by EH to BD-diol and subsequent conjugation to NAC, a GST-catalyzed reaction-producing M1. EB itself is a substrate for GST and can be directly conjugated with NAC to form M2. Consequently, the M1/(M1 + M2) ratio is an indicator for the relative rate of EB hydrolysis by EH or direct conjugation of EB with NAC. In the current study, > 98% of EB is excreted as the M1 metabolite (Albertini et al., 2003), a finding that is in agreement with hemoglobin adducts (discussed above), suggesting that > 99.6% of BD is metabolized via the BD-diol pathway. Investigating the ratio of M2/(M1 + M2) demonstrates that the relative formation of M2 increases with BD exposures, suggesting activation of the GST mediated direct conjugation pathway. As would be expected, analysis of M2/(M1 + M2) ratio by genotypes revealed that the increased activation of the direct conjugation pathway is stronger in the GST positive compared with both GST M1 and GST T1 negative genotypes. This was significant for GST M1 confirming the importance of GST M1 in detoxification of BD metabolites. The relative increase in M2 metabolite in the polymerization workers is an indirect indication for accumulation of EB and consistent with higher percentages of HB-Val compared with pyr-Val in the polymerization workers compared with controls and monomer workers (Table 1). Together, hemoglobin adducts and urinary metabolites show the dominance of the BD-diol pathway for BD metabolism. Both sets of biomarkers provide evidence for a difference in BD metabolism between the polymerization workers and both the control subjects and the monomer workers. The individual differences for the urinary biomarkers were greater than the individual differences of the hemoglobin adducts. This demonstrates that hemoglobin adducts are less affected by daily exposures and dilution effects than urinary metabolites.
In summary, we report herein the presence of DEB, the most mutagenic and carcinogenic BD-derived metabolite, in BD-exposed workers. Formation of DEB in humans, as measured by pyr-Val, is much lower compared with mice and rats exposed similarly. Occupational exposures in a polymerization facility lead to significant increases in pyr-Val over controls and monomer plant workers. Correlation analyses with previously analyzed HB-Val, THB-Val, M1, and M2 further suggest that the metabolism of EB to DEB is significantly different in polymerization workers compared with monomer workers or control subjects. Whether pyr-Val formation saturates, GST activity increases with increased BD exposures or if coexposures to other compounds in the polymerization plant, such as benzene and styrene, alter BD metabolism could not be determined. The amounts of pyr-Val formed in this study were not associated with increases in MF or VF in the HPRT gene, although pyr-Val formation correlated with increased chromosome breaks. Low amounts of pyr-Val were also present in control subjects, suggesting formation from environmental exposures to BD.
FUNDING
This research was supported in part by grants from the National Institutes of Health (1 R01 ES012689, 5 P30-ES10126), the Health Effects Institute (agreements 99-5 and 05-12), the American Chemistry Council, and the Arkansas Bioscience Institute, the major research component of the Arkansas Tobacco Settlement Proceeds Act of 2000.
References
- Albertini RJ, Carson ML, Kirman CR, Gargas ML. 1,3-butadiene: II. Genotoxicity profile. Crit. Rev. Toxicol. 2010;40(Suppl. 1):12–73. doi: 10.3109/10408444.2010.507182. [DOI] [PubMed] [Google Scholar]
- Albertini RJ, Šram RJ, Vacek PM, Lynch J, Nicklas JA, van Sittert NJ, Boogaard PJ, Henderson RF, Swenberg JA, Tates AD, et al. Biomarkers in Czech Workers Exposed to 1,3-Butadiene: A Transitional Epidemiologic Study. 2003. pp. 1–141. Health Effects Institute, Cambridge, MA, Report (116), 1–141. [PubMed] [Google Scholar]
- Albertini RJ, Šram RJ, Vacek PM, Lynch J, Rossner P, Nicklas JA, McDonald JD, Boysen G, Georgieva N, Swenberg JA. Molecular epidemiological studies in 1,3-butadiene exposed Czech workers: Female-male comparisons. Chem. Biol. Interact. 2007;166:63–77. doi: 10.1016/j.cbi.2006.07.004. [DOI] [PubMed] [Google Scholar]
- Agency for Toxic Substances and Disease Registry (ATSDR) Toxicological Profile for 1,3-Butadiene. Benzene. Agency for Toxic Substances and Disease Registry, U.S. Department of Health and Human Services, Public Health Service, Atlanta, GA; 1992. [Google Scholar]
- Booth ED, Kilgour JD, Watson WP. Dose responses for the formation of hemoglobin adducts and urinary metabolites in rats and mice exposed by inhalation to low concentrations of 1,3-[2,3-14C]-butadiene. Chem. Biol. Interact. 2004;147:213–232. doi: 10.1016/j.cbi.2004.01.002. [DOI] [PubMed] [Google Scholar]
- Bordeerat NK, Georgieva NI, Klapper DG, Collins LB, Cross TJ, Borchers CH, Swenberg JA, Boysen G. Accurate quantitation of standard peptides used for quantitative proteomics. Proteomics. 2009;9:3939–3944. doi: 10.1002/pmic.200900043. [DOI] [PMC free article] [PubMed] [Google Scholar]
- Boysen G, Georgieva NI, Upton PB, Jayaraj K, Li Y, Walker VE, Swenberg JA. Analysis of diepoxide-specific cyclic N-terminal globin adducts in mice and rats after inhalation exposure to 1,3-butadiene. Cancer Res. 2004;64:8517–8520. doi: 10.1158/0008-5472.CAN-04-3184. [DOI] [PubMed] [Google Scholar]
- Boysen G, Georgieva NI, Upton PB, Walker VE, Swenberg JA. N-terminal globin adducts as biomarkers for formation of butadiene derived epoxides. Chem. Biol. Interact. 2007;166:84–92. doi: 10.1016/j.cbi.2006.10.005. [DOI] [PubMed] [Google Scholar]
- Dollard, G. J., Dore, C. J., and Jenkin, M. E. (2001). Ambient concentrations of 1,3-butadiene in the UK. Chem. Biol. Interact.135–136, 177–206. [DOI] [PubMed]
- Fowles J, Dybing E. Application of toxicological risk assessment principles to the chemical constituents of cigarette smoke. Tob. Control. 2003;12:424–430. doi: 10.1136/tc.12.4.424. [DOI] [PMC free article] [PubMed] [Google Scholar]
- Georgieva NI, Boysen G, Bordeerat N, Walker VE, Swenberg JA. Exposure-response of 1,2:3,4-diepoxybutane specific N-terminal valine adducts in mice and rats after inhalation exposure to 1,3-butadiene. Toxicol. Sci. 2010;15:322–329. doi: 10.1093/toxsci/kfq060. [DOI] [PMC free article] [PubMed] [Google Scholar]
- Gordon SM, Wallace LA, Brinkman MC, Callahan PJ, Kenny DV. Volatile organic compounds as breath biomarkers for active and passive smoking. Environ. Health Perspect. 2002;110:689–698. doi: 10.1289/ehp.02110689. [DOI] [PMC free article] [PubMed] [Google Scholar]
- Himmelstein MW, Acquavella JF, Recio L, Medinsky MA, Bond JA. Toxicology and epidemiology of 1,3-butadiene. Crit. Rev. Toxicol. 1997;27:1–108. doi: 10.3109/10408449709037482. [DOI] [PubMed] [Google Scholar]
- International Agency for Research on Cancer (IARC) 1,3-butadiene, ethylene oxide and vinyl halides (vinyl fluoride, vinyl chloride and vinyl bromide) IARC Monogr. Eval. Carcinog. Risks Hum. 2008;97:45–184. [PMC free article] [PubMed] [Google Scholar]
- Jayaraj K, Georgieva NI, Gold A, Sangaiah R, Koc H, Klapper DG, Ball LM, Reddy AP, Swenberg JA. Synthesis and characterization of peptides containing a cyclic Val adduct of diepoxybutane, a possible biomarker of human exposure to butadiene. Chem. Res. Toxicol. 2003;16:637–643. doi: 10.1021/tx020099i. [DOI] [PubMed] [Google Scholar]
- Kautiainen A, Fred C, Rydberg P, Törnqvist M. A liquid chromatography tandem mass spectrometric method for in vivo dose monitoring of diepoxybutane, a metabolite of butadiene. Rapid Commun. Mass Spectrom. 2000;14:1848–1853. doi: 10.1002/1097-0231(20001015)14:19<1848::AID-RCM106>3.0.CO;2-#. [DOI] [PubMed] [Google Scholar]
- Kirman CR, Albertini RA, Gargas ML. 1,3-Butadiene: III. Assessing carcinogenic modes of action. Crit. Rev. Toxicol. 2010;40(Suppl. 1):74–92. doi: 10.3109/10408444.2010.507183. [DOI] [PubMed] [Google Scholar]
- Koc, H., Tretyakova, N. Y., Walker, V. E., Henderson, R. F., and Swenberg, J. A. (1999). Molecular dosimetry of N-7 guanine adduct formation in mice and rats exposed to 1,3-butadiene. Chem. Res. Tox.12, 566–574. [DOI] [PubMed]
- Meng, Q., Walker, D. M., McDonald, J. D., Henderson, R. F., Carter, M. M., Cook, D. L., Jr., McCash, C. L., Torres, S. M., Bauer, M. J., Seilkop, S. K., et al. (2007). Age-, gender-, and species-dependent mutagenicity in T cells of mice and rats exposed by inhalation to 1,3-butadiene. Chem. Biol. Interact.166, 121–131. [DOI] [PubMed]
- Mowrer J, Törnqvist M, Jensen S, Ehrenberg L. Modified Edman degradation applied to hemoglobin for monitoring occupational exposure to alkylating-agents. Toxicol. Environ. Chem. 1986;11:215–231. [Google Scholar]
- National Toxicology Program. (2005). 11th Report on Carcinogens. III-42–III-44. Research Triangle Park, NC.
- Powley MW, Li Y, Upton PB, Walker VE, Swenberg JA. Quantification of DNA and hemoglobin adducts of 3,4-epoxy-1,2-butanediol in rodents exposed to 3-butene-1,2-diol. Carcinogenesis. 2005;26:1573–1580. doi: 10.1093/carcin/bgi119. [DOI] [PubMed] [Google Scholar]
- Preston RJ. Cancer risk assessment for 1,3-butadiene: Data integration opportunities. Chem. Biol. Interact. 2007;166:150–155. doi: 10.1016/j.cbi.2006.03.009. [DOI] [PubMed] [Google Scholar]
- Swenberg JA, Bordeerat NK, Boysen G, Carro S, Georgieva NI, Nakamura J, Troutman JM, Upton PB, Albertini RJ, Vacek PM, et al. 1,3-Butadiene: Biomarkers and application to risk assessment. Chem. Biol. Interact. 2011;192:150–154. doi: 10.1016/j.cbi.2010.10.010. [DOI] [PMC free article] [PubMed] [Google Scholar]
- Swenberg JA, Fryar-Tita E, Jeong YC, Boysen G, Starr T, Walker VE, Albertini RJ. Biomarkers in Toxicology and risk assessment: Informing critical dose-response relationships. Chem. Res. Toxicol. 2008;21:253–265. doi: 10.1021/tx700408t. [DOI] [PubMed] [Google Scholar]
- Swenberg JA, Koc H, Upton PB, Georgieva N, Ranasinghe A, Walker VE, Henderson R. Using DNA and hemoglobin adducts to improve the risk assessment of butadiene. Chem. Biol. Interact. 2001;135–136:387–403. doi: 10.1016/s0009-2797(01)00221-6. [DOI] [PubMed] [Google Scholar]
- Törnqvist M, Fred C, Haglund J, Helleberg H, Paulsson B, Rydberg P. Protein adducts: Quantitative and qualitative aspects of their formation, analysis and applications. J. Chromatogr. B. 2002;778:279–308. doi: 10.1016/s1570-0232(02)00172-1. [DOI] [PubMed] [Google Scholar]
- Törnqvist M, Mowrer J, Jensen S, Ehrenberg L. Monitoring of environmental cancer initiators through hemoglobin adducts by a modified Edman degradation method. Anal. Biochem. 1986;154:255–266. doi: 10.1016/0003-2697(86)90524-5. [DOI] [PubMed] [Google Scholar]
- U.S. EPA, Office for Research and Development, and National Center for Environmental Assessment. Health Assessment of 1,3-Butadiene. 2002. U.S. EPA, Washington, DC. [Google Scholar]
- Vacek PM, Albertini RJ, Šram RJ, Upton P, Swenberg JA. Hemoglobin adducts in 1,3-butadiene exposed Czech workers: Female-male comparisons. Chem. Biol. Interact. 2010;188:668–676. doi: 10.1016/j.cbi.2010.06.017. [DOI] [PubMed] [Google Scholar]
- Walker, V. E., Walker, D., Meng, Q., McDonald, J. D., Scott, B. R., Sielkop, S. K., Claffey, D. J., Upton, P. B., Swenberg, J. A., and Henderson, R. F. (2009). Genotoxicity of 1,3-butadiene and its epoxy intermediates. HEI Research Report, Health Effects Institute, Capital City Press, Montpelier, VT. [PubMed]


