

Abstract
In a recent series of experiments, we demonstrated that a visuomotor adaptation task, 12 hours of left arm immobilization, and rapid transcranial magnetic stimulation (rTMS) during waking can each induce local changes in the topography of electroencephalographic (EEG) slow wave activity (SWA) during subsequent non-rapid eye movement (NREM) sleep. However, the poor spatial resolution of EEG and the difficulty of relating scalp potentials to the activity of the underlying cortex limited the interpretation of these results. In order to better understand local cortical regulation of sleep, we used source modeling to show that plastic changes in specific cortical areas during waking produce correlated changes in SWA during sleep in those same areas. We found that implicit learning of a visuomotor adaptation task induced an increase in SWA in right premotor and sensorimotor cortices when compared to a motor control. These same areas have previously been shown to be selectively involved in the performance of this task. We also found that arm immobilization resulted in a decrease in SWA in sensorimotor cortex. Inducing cortical potentiation with repetitive transcranial magnetic stimulation (rTMS) caused an increase in SWA in the targeted area and a decrease in SWA in the contralateral cortex. Finally, we report the first evidence that these modulations in SWA may be related to the dynamics of individual slow waves. We conclude that there is a local, plasticity dependent component to sleep regulation and confirm previous inferences made from the scalp data.
Introduction
During non rapid eye movement (NREM) sleep, cortical pyramidal neurons oscillate about once a second between a hyperpolarized downstate and a depolarized upstate [1, 2]. The currents produced by these cellular oscillations sum to produce large (> 80 μV) slow waves that can be detected with scalp electroencephalography (EEG) [3]. These slow waves are the most significant electrophysiological events in the healthy human EEG. They are a major marker of deep sleep and increasing evidence suggests that slow waves may mediate some of the functional benefits of sleep, both at the cellular and systems level [4–6]. Slow waves can be quantified as slow wave activity (SWA, power between 0.5–4.0 Hz). SWA is the most widely accepted EEG marker of NREM sleep intensity [7, 8]. This is because several experiments have shown that SWA is highest early in the night, when arousal is most difficult, and decreases as a function of sleep duration [8]. Furthermore, the amount of SWA is positively correlated with the duration of prior waking [9, 10].
While the mechanisms responsible for this regulation are poorly understood, one hypothesis, the synaptic homeostasis hypothesis, is that slow waves renormalize synaptic strength [11]. According to this hypothesis, waking experience is accompanied by a net increase in synaptic strength. Left unchecked, progressive increases in synaptic strength would exhaust the reserves of the brain in terms of energy, space, cellular supplies, and capacity for further learning. Slow waves during sleep renormalize synaptic strength to a baseline level while increasing the signal-to-noise ratio of synaptic communication. This hypothesis is supported by animal studies suggesting that net synaptic potentiation occurs during waking and net synaptic depression occurs during sleep [12, 13]. Electrophysiological data from humans and animals indicate that early sleep is characterized by large single peak slow waves and high SWA [14, 15]. After several hours of sleep, these single peak waves are increasingly replaced by smaller multipeak waves and SWA decreases. Computer simulations have shown that these EEG changes can be explained by a model in which synaptic strength decreases over the course of the night. [16].
One prediction of this hypothesis is that sleep intensity is locally regulated in response to changes in synaptic strength during waking. Indeed, a growing body of evidence suggests that SWA, learning, and synaptic plasticity are interrelated [17, 18]. Learning is thought to induce local, use-dependent changes in synaptic strength. Animal studies have shown that unilateral sensory stimulation induces SWA asymmetry during subsequent sleep [19]. When rats were taught a reaching task, there were unilateral increases in gene expression, dendritic arborization, and synaptic efficiency (reviewed in Hanlon et al., this book) [20–22]. This same cortex showed an increase in SWA during subsequent sleep [21]. Furthermore, in a recent series of experiments, we induced regionally specific plastic changes with a rotation learning task, arm immobilization, and rapid transcranial magnetic stimulation (rTMS) [23–25]. The changes were verified by recording evoked responses both before and after the intervention. Next, high-density EEG (hd-EEG) was recorded from the subjects while they slept. Subjects showed changes in SWA that were correlated with and in the same electrodes as the changes in the amplitude of the evoked responses [23, 24].
Although these studies suggest that regional plasticity during waking induces regional changes in SWA during sleep, the relationship between the scalp EEG and the activity of the underlying neurons is complex. It is often assumed that EEG waveforms reflect the currents in the directly underlying cortex [26]. However, this assumption is not supported mathematically; infinitely many patterns of cortical current can give rise to a given scalp topography [27–29]. Furthermore, the skull, scalp, and pia spatially blur the potentials recorded at the electrodes [30]. Therefore, we must apply several constraints to the possible current distributions in order to select one. This process of constraining is called source modeling. Source modeling is a computationally intensive process the results of which can be difficult to interpret. However, one of the main benefits of source modeling is that it is a blind algorithm. Instead of assuming the cortical current distribution that best fits with our experimental hypothesis and EEG data, source modeling is a minimally biased method that relies only on the EEG data and a biophysical model of the geometry and conductivity of the head. By formalizing the implicit assumptions that are often made when interpreting scalp EEG data, source modeling results can provide insights into the most likely cortical correlates of EEG phenomena.
Previous authors have used source modeling to identify the cortical generators of EEG frequency bands [31, 32]. Here, we use this method to confirm a link between waking cortical plasticity and sleep cortical SWA. We also performed an analysis of the behavior of individual slow waves following learning. We have recently shown that each slow wave is a unique cortical event and each wave recruits a distinct portion of the cortex [33]. Therefore, we wanted to test the hypothesis that regional plastic changes during waking induce changes in how individual single peak slow waves manifest in the same regions. Finally, we describe a novel change in the scalp distribution of multipeak waves in response to learning.
Methods
Subjects and Recordings
All the EEG data we analyzed were recorded as part of previous studies. We selected NREM sleep (stages N2 and N3) from the first sleep cycle for source modeling analysis. The studies are briefly summarized below.
Rotation learning experiment (reported in [25])
In the first study, subjects performed a motor learning task (described in [34]). 256 channel high density EEG (hd-EEG) was obtained from 11 subjects as they performed the task and as they slept following the task. Subjects were presented with a screen showing a central circle surrounded by eight target circles. Once every second, one of the target circles flashed. The subjects then had to use their right arm to control a handheld mouse and move a cursor from the central circle to the target circle (Figure 1A). The subject’s arm and the mouse were hidden below a screen. On the rotation adaptation night, the cursor position was rotated by a fixed angle [34]. This created a mismatch between the movement of the mouse and the position of the cursor that subjects implicitly learned to account for. At first, subjects were unable to accurately reach the target [25]. The decrease in error as the task was learned is presumably due to plastic changes in the cortical areas that are used by the task. Each subject also had a control night (1 week removed from the experimental night) where they performed the same task with no mismatch applied. The order of the nights was randomized for each subject. Following completion of the task, subjects were allowed to sleep. In the morning, subjects performed the task again and any change in performance was noted. The sleep EEG was then scored with standard criteria and analyzed [35]. No significant changes were reported in sleep latency, amount, or sleep stages. When the topography of SWA from NREM sleep of the first sleep cycle was compared between the experimental and control night, a statistically significant increase was seen in a cluster of electrodes extending anteriorly and to the right from Cz (Figure 1A’, [25]).
Figure 1.

Changes in synaptic weight during waking induce changes in sleep SWA topography. A) Rotation learning task. The cursor movement is a rotated version of the true arm movement. Over the course of the experiment, subjects subconsciously adjust to this. A’) SWA topography from the first sleep cycle for rotation versus control nights. White electrodes showed significantly more SWA (p<0.05, SnPM cluster test) following rotation learning. B) Arm immobilization. Subjects wore a sling over their left arm for 12 hours. B’) SWA topography from the first sleep cycle for immobilization versus control nights. White electrodes showed significantly less SWA (p<0.05) following arm immobilization. C) Repetitive TMS was used to induce cortical LTP during waking. C’) SWA topography from the first sleep cycle for rTMS versus control nights. The white electrode showed significantly more SWA (p<0.05, SnPM cluster test) following rTMS.
Arm immobilization experiment (reported in [24]
In the second study, 14 subjects (right-handed males, mean age 25.4 ± 1.3 years) had their left arm immobilized in a sling for 12 hours during the day (Figure 1B). At night, the sling was removed and subjects were connected to a 256 hd-EEG net. A brief kinematic task (similar to the control task for the rotation learning experiment) was administered to test the performance of the previously immobilized arm. Subjects were then allowed to sleep undisturbed. For the control night, subjects simply came to the lab, applied the hd-EEG net, performed the task and slept. Again, the order of the nights was randomized for each subject. Comparisons between the two nights revealed no changes in sleep architecture. However, there was a statistically significant decrease in SWA from NREM sleep of the first sleep cycle in the immobilization night compared to the control night in three electrodes (Figure 1B’, [24]). Performance on the kinematic test was significantly worse following immobilization. In 7 subjects, sensory evoked potentials (SEPs) were evoked by stimulating the right and left median nerve. Following immobilization, left arm SEPs showed a significant decrease in amplitude (p<0.05, two-tailed paired t-test, [24]).
rTMS experiment (reported in [23]
In the third study, rTMS was used to induce potentiation in a targeted cortical area [23]. Subjects (n=10, right-handed males, mean age 26.5 ± 1.6 years) were connected to a 60 channel TMS-compatible EEG net (Figure 1C). An optical tracking system was used to target the TMS coil using an anatomical MRI from each subject. The rTMS protocol consisted of 1500 pulses at a frequency of 5 Hz delivered at an intensity of 90% of resting motor threshold. This had previously been shown to induce long-term potentiation in human subjects [36]. TMS pulses to the target area induced larger responses (measured as global mean field power) after rTMS, confirming the occurrence of potentiation. Subjects were then allowed to sleep undisturbed. For the control night, sham TMS was performed by placing a spacer between the coil and the scalp and rotating the coil so that it faced away from the head. The order of the nights was randomized for each subject. Again, no significant differences in sleep architecture were observed. When the topography of SWA from NREM sleep of the first sleep cycle was compared between the rTMS and sham night, a statistically significant increase was seen in a cluster of electrodes located around the target of rTMS (Figure 1C’, [23]).
Source Localization
Source localization was performed on 0.3–40 Hz bandpass filtered data using a four shell head model derived from a magnetic resonance image of an individual whose head closely approximates the Montreal Neurological Institute head. A standard, co-registered set of electrode positions was used for the construction of a four concentric shells forward model. The inverse matrix was calculated using the minimum norm least squares (L2) method, subject to depth weighting, orientation weighting, truncated singular value decomposition regularization at 10−3 in order to stabilize the solution, and the Local Autoregressive Average (LAURA) constraint [37]. The source space was restricted to 2447 cortical voxels (7mm3) which were each assigned to a gyrus and a Brodmann area based on the MNI probabilistic atlas. All inverse modeling was performed using GeoSource (Electrical Geodesics Incorporated, Eugene, OR). In a previous paper, we found this method to be the most effective for analyzing slow waves [33]. For further technical details on source modeling see [30, 38].
Slow Wave Activity Statistics
Following inverse modeling, power spectra were calculated by Welch’s method (Fast Fourier Transform of 20 second epochs with non-overlapping Hanning windows of 4 second length). Within each session, the topography was normalized by dividing by the mean across voxels. Statistical non-parametric mapping (SnPM) suprathreshold cluster tests were used to distinguish between the topography of the control and experimental conditions in the 1–4.5 Hz frequency range [39]. These calculations were performed using MATLAB (The Math Works, Inc, Natick, MA).
Slow Wave Analysis
We analyzed the origins, propagation, and cortical involvement of slow waves using methods developed in [14, 33, 40]. Briefly, we used an automatic detection algorithm to isolate individual slow waves in the mastoid-referenced EEG. The slow waves were source modeled as described above and compared to several seconds of source modeled baseline data from quiet waking or stage 1 sleep. For each slow wave, we set a threshold of 25% of the maximum relative current within a window of 100 ms centered on the negative EEG peak of the slow wave. For each source voxel, we recorded the timing of the local maxima during the time window. We defined the first 10% of source voxels to have a negative peak as the origin for each slow wave. We used the timing of the source voxel maxima to generate a spatiotemporal gradient. Streamlines down this gradient constituted the propagation of each slow wave. Finally, cortical involvement was defined as the average relative current in each voxel over the time window described above. For the analysis shown in Figure 5, we measured the origins (O), propagation (P), and involvement (I) in two regions-of-interest (ROIs).
Figure 5.
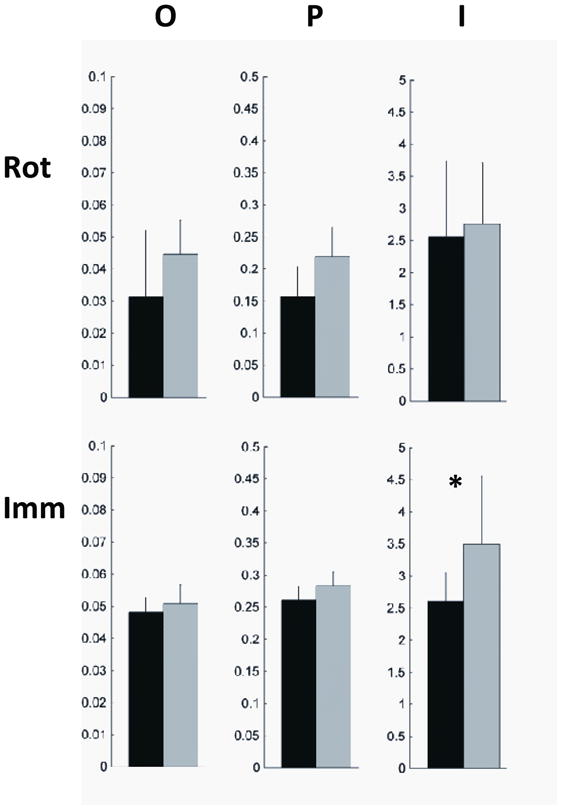
Comparison of cortical slow wave parameters between experimental and control nights for rotation learning (top row) and arm immobilization (bottom row) experiments. For each experiment, we measured the parameters for the ROIs identified in Figures 2 and 3 respectively. O = slow wave origins, P = slow wave propagation density, I = slow wave involvement (see Methods and [33]). Black bars are the experimental nights and gray bars are the control nights. * p<0.05, paired t-test.
Results
Rotation Learning Results in Increased SWA in Right Premotor and Sensorimotor Cortices
One of the first pieces of evidence that the human sleep EEG has a use-dependent, local component came from a study in which an implicit rotation learning task induced an increase in SWA in a cluster of electrodes just right of Cz during subsequent sleep (Figure 1) [25]. Here, we source modeled NREM sleep from the first sleep cycle for nine subjects who improved at the task following sleep and compared it to NREM sleep from the same subjects during the control night. We found that improvement in the task following sleep was associated with a large cortical SWA hotspot on the right side which spread from a focus just anterior to the central sulcus (Figure 2). Within this hotspot, statistically significant increases in SWA were observed in somatosensory cortex (Brodmann area 2), primary motor cortex (Brodmann area 4), premotor cortex (Brodmann area 6), and the inferior parietal lobule (Brodmann area 40) (Figure 2). Furthermore, the increase in this hotspot was correlated to performance improvement (r = 0.86, p<0.05). There were no statistically significant decreases in cortical SWA.
Figure 2.

Rotation learning induces a local increase in cortical SWA. A) Inflated cortical maps showing the ratio of cortical SWA during NREM sleep of the first sleep cycle following implicit rotation learning to cortical SWA during NREM sleep of the first sleep cycle following a motor control task. There is a hotspot over the right parietal cortex. The black outline delineates the statistically significant differences between the two conditions (statistical non-parametric permutation cluster test (SnPM), corrected for multiple comparisons, p<0.05). The statistically significant regions represent areas of increased cortical SWA following rotation learning. Note that the hashed markings for the thalamic area and the darkened sulci in Figures 2–4 are anatomical markings and not related to SWA.
Arm Immobilization during Waking Results in Decreased SWA in Contralateral Premotor and Sensorimotor Cortices
As mentioned above, Huber et al. described decreases in SEP amplitude and focal topographic decreases in SWA following immobilization of the left arm (Figure 1) [24]. They also reported that following immobilization, the amplitude of evoked potentials from the left median nerve decreased. Here, we source modeled these evoked potentials from both baseline and experimental conditions for 6 subjects. We found that prior arm immobilization resulted in a reduced response to stimulation (as measured by the sum of the current during the first 100 milliseconds after stimulation) of the left median nerve in the right parietal cortex (Figure 3). This reduction was statistically significant only for the stimuli delivered to the previously immobilized arm [24].
Figure 3.

Arm immobilization induces a local decrease in cortical SWA. Inflated cortical maps showing (left side) the ratio of the sum of currents during the first 100 milliseconds of the left arm SEPs before and after 12 hours of arm immobilization and (right side) subsequent NREM sleep of the first sleep cycle relative to cortical SWA of NREM sleep of the first sleep cycle following a normal day. The white outline circumscribes the statistically significant region (SnPM suprathreshold cluster test, corrected for multiple comparisons, p<0.05) of decreased cortical SWA in the frontal and parietal cortices following arm immobilization. Both the SEP and SWA ratios are on the same scale.
We analyzed the topographic distribution of hd-EEG SWA during NREM sleep of the first sleep cycle (Figure 3). In agreement with the prior study, we found a focal decrease in NREM SWA in the posterior central portion of the scalp. We then analyzed the source topography of SWA for both the control and experimental nights. We found decreases in cortical SWA in parietal cortex corresponding to motor cortex (Brodmann area 4), premotor cortex (Brodmann area 6), supplementary motor cortex (Brodmann area 6), the precuneus (Brodmann area 7), somatosensory cortex (Brodmann area 5), and the cingulate gyrus (Brodmann areas 24 and 31) (Figure 3). There were no statistically significant increases in cortical SWA. We found all of the areas showing statistically significant reductions in SWA after immobilization also showed reduced SEP currents after immobilization.
rTMS During Waking Induces Increases in SWA in the Targeted Areas and Decreases in the Contralateral Hemisphere
A more direct manipulation of cortical activity, rTMS, can induce long term potentiation (LTP) in the targeted area [36]. Induction of LTP has previously been associated with an increase in EEG SWA in electrodes superficial and adjacent to the targeted cortex during NREM sleep (Figure 1) [23]. Here, we source modeled the potentials evoked by each individual stimulus in the train of rTMS (Figure 4). As expected, we found that the TMS pulses evoked large currents in the left premotor cortex where the stimulation was targeted.
Figure 4.
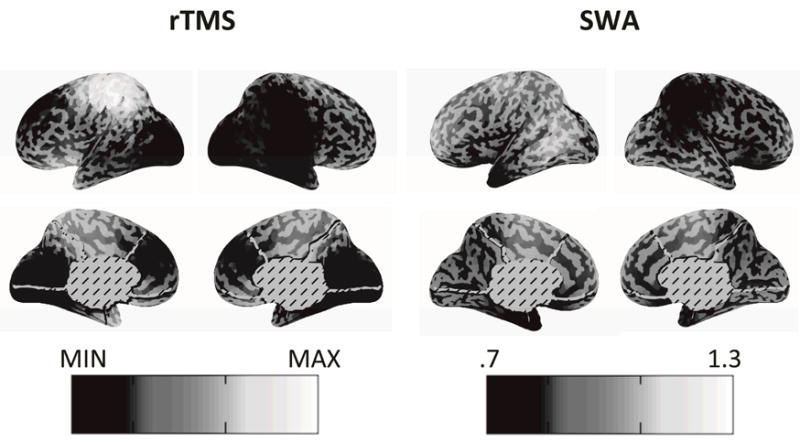
Cortical LTP induced by rTMS is associated with increase in cortical SWA in the targeted area during subsequent NREM sleep. On the left is a map of the mean cortical currents over a 130 milliseconds following a TMS pulse. The left side of the figure is scaled to the minimum and maximum of the currents across voxels. The right side of the figure shows the ratio of cortical SWA during NREM sleep following rTMS compared to NREM sleep following sham stimulation. There is an increase in cortical SWA in the targeted area.
We also found that NREM sleep following rTMS was associated with a large increase in cortical SWA in the left hemisphere compared to NREM sleep following a sham stimulation (Figure 4). The SWA hotspot extends from the targeted cortex (Brodmann area 6) to frontal cortex (Brodmann area 10), parietal cortex (including motor cortex and the precuneus) and occipital cortex (extrastriate cortex). This large hotspot may reflect the fact that TMS pulses can indirectly activate regions that are effectively connected to the targeted area [41]. In addition, we found a smaller cortical SWA cold spot contralateral to the targeted area. This may be due to increased transcallosal inhibition arriving from the targeted cortex [42].
Slow wave dynamics are altered by waking experience
While SWA represents the average power of all slow waves over a time interval, each slow wave is a unique cortical event [33]. We therefore wanted to know whether the observed changes in SWA could be linked to changes in the behavior of individual slow waves. We used an automated detection algorithm to identify single-peak slow waves occurring during the rotation learning and immobilization experiments [14, 40]. For each slow wave, we measured three parameters: origin, propagation, and involvement (see Methods and [33]). For the immobilization experiment, we found a statistically significant decrease in slow wave involvement in the area showing decreased SWA (Figure 5, p<0.05 paired t-test). This suggests that the decrease in SWA may be related to a decrease in wave size in these areas rather than fewer waves originating or propagating through the area. In contrast to the immobilization data, when origin, propagation, and involvement were examined in the SWA hotspot for the rotation learning data, we observed no statistically significant changes (Figure 5).
Since our single-peak slow wave parameters could not explain the SWA changes in the rotation learning experiment, we decided to analyze multipeak waves (Figure 6). These waves are more complicated to characterize in terms of their cortical origins and propagation [14]. Therefore, we restricted our analysis to broader, scalp level parameters. We found that rotation learning resulted in proportionally more multi peak waves (p<0.05). However, within the cluster of electrodes showing increased SWA there was little change in the number of multipeak waves (Figure 6B). Furthermore, within this cluster the number of multipeak waves was negatively correlated with post-sleep improvement (r =−0.78, p<0.05). The increase in multipeak waves was driven by a large portion of the scalp extending posteriorly from the SWA hotspot. This is interesting in light of the fact that slow waves preferentially originate in frontal electrodes and propagate in an anterior-to-posterior direction [33, 40]. This suggests that waves that remain restricted to the front of the scalp remain single peak waves, but once a wave expands past the rotation hotspot it is more likely to become a multipeak wave.
Figure 6.

Analysis of multipeak waves during the rotation learning experiment. A) Rotation learning induced a decrease in the proportion of single peak waves and a corresponding increase in multipeak waves across the scalp. The rotation learning data is in black and the control is in gray. * p<0.05, paired t-test. B) The scalp topography of the ratio of the proportion of multipeak waves in the rotation learning versus control conditions. The increase in multipeak waves is clearly driven by increased multipeak waves in posterior electrodes. There is little change in multipeak waves in the six electrodes from Figure 1A’.
Discussion
SWA is a well-established global marker of NREM sleep need and intensity. It is highest during recovery sleep following sleep deprivation and is gradually dissipated by sleep. Several hypotheses about the role of sleep have suggested that sleep intensity might be locally regulated [11, 43, 44]. These hypotheses are supported by results from invasive recordings in animals and EEG recordings in humans [19, 23–25, 45]. In this paper, we used source modeling to localize previously observed changes in EEG SWA during NREM sleep following waking plasticity. We found that implicit learning of a visuomotor adaptation task resulted in increased SWA in right sensorimotor and premotor cortex. Arm immobilization for 12 hours induced a decrease in cortical SWA in the contralateral premotor and sensorimotor cortices. These source modeling results confirmed and refined the overall picture in terms of cortical localization of SWA changes reported in prior hd-EEG studies. We also observed that rTMS-induced cortical potentiation during waking was followed by increased SWA in the targeted area and decreased SWA contralaterally during subsequent sleep although these changes were not statistically significant. Although we could not confirm the EEG results for the rTMS experiment, our source modeling results indicate that rTMS activates crosscallosal inhibitory neurons which could not be established from scalp data alone. Finally, we found evidence suggesting that the changes in SWA are correlated with changes in the dynamics of individual sleep slow waves. Taken together, our results confirm the previously hypothesized connections between local plastic changes during waking and slow waves during subsequent sleep.
Source modeling slow wave activity
Compared to other neuroimaging techniques, EEG has a variety of advantages that make it useful for studying sleep. It is relatively inexpensive and non-invasive and allows subjects to sleep in a more natural environment than PET, fMRI, or MEG. These advantages have made EEG an essential part of the sleep clinician’s diagnostic toolkit [46]. In spite of the ubiquity of the EEG in sleep medicine and research, there are only a limited number of studies that have applied source modeling to spontaneous sleep. Recently, we have shown that source modeling of EEG is a powerful tool to study the cortical generators of spontaneous sleep slow waves, which are the major component of SWA [33]. Here, we source modeled several minutes of data for each subject and then performed our power analysis. While previous studies have described the cortical distribution of SWA during sleep [31] and other studies have reported changes in the topography of scalp SWA in response to waking experience [45, 47], this paper is the first description with source modeling of topographic changes in cortical SWA following experimental manipulations.
As a note of caution, source modeling remains a probabilistic estimation of cortical currents due to the fundamental limitation that infinitely many cortical current distributions can give rise to a given scalp topography [28]. Furthermore, source modeling relies on the observation that the specific geometry of cortical pyramidal neurons makes them the most likely source of the EEG signal [48]. Therefore, plastic changes in subcortical structures are unlikely to be detectable by EEG.
Source modeling hd-EEG shows that SWA changes during sleep occur in cortical areas that undergo plastic changes during waking
In each of the three experiments we examined, a targeted manipulation during waking led to a correlated change in SWA in the targeted cortical area. PET and fMRI studies have shown that the rotation learning task selectively involves right premotor and supplementary motor cortex (right Brodmann areas 6, 7, and 40) compared to a motor control task [34, 49]. Using source modeling, we now could show that these same areas showed an increase in SWA during the subsequent night’s sleep. Arm immobilization resulted in a decrease in the amplitude of potentials evoked from stimulation of the median nerve of the immobilized arm. This suggests that immobilization causes a plastic change in contralateral sensorimotor cortex. This area showed a decrease in cortical SWA during the subsequent night’s sleep. Finally, we used an optical tracking system to deliver bouts of rTMS to the left motor cortex. In a previous paper, we showed that this regimen induces changes compatible with the occurrence of cortical LTP [36]. Here, we show that there are widespread changes in cortical SWA following rTMS. Each of these results provides overlapping but distinct evidence for a proposed local component of sleep regulation that is controlled by regional plastic changes during waking. The rotation learning and immobilization experiments suggest that SWA intensity can be tuned in either direction, while the rTMS experiment shows that direct manipulation of synaptic strength can produce changes in cortical SWA topography.
SWA is locally regulated
Recent work with fMRI and source modeling hd-EEG has shown that sleep slow waves are primarily associated with activity in a core set of cortical areas, including the medial frontal gyrus, the middle frontal gyrus, the inferior frontal gyrus, the anterior cingulate, the precuneus, the posterior cingulate, and the parahippocampal gyrus [33, 50]. In this report, we show that plasticity dependent regulation of SWA occurs in cortical areas that do not belong to this core set such as the sensory cortex, motor cortex and premotor cortex. This suggests that slow waves do not merely spread outward from a set of core structures in a passive manner, but rather are finely regulated in response to local plastic changes. Our results are consistent with the synaptic homeostasis hypothesis mentioned in the introduction.
Multipeak and local slow waves
Previous reports indicate that multipeak waves become more common during the course of the night [14]. It has been proposed that this increase in multipeak waves may be related to a decrease in synaptic strength following several hours of sleep, which would make it harder for large populations of neurons to synchronize into global, single peak waves. Indeed, computer modeling studies indicate that under conditions of reduced synaptic strength, competing populations synchronize into local slow waves [14, 16]. These local slow waves can interfere with each other and would manifest on the scalp as multipeak waves.
However, in our analysis of the sleep after rotation learning data, we see an increase in multipeak waves early in the night when synaptic strength would presumably be high. Why might this be? A tentative scenario is as follows. During early NREM sleep, the EEG is dominated by global slow waves which propagate posteriorly along the cingulate gyrus and synchronize large expanses of cortex [33]. Following local plastic changes during waking, a small patch of cortex may be more likely to spontaneously generate slow waves. While most of the time the activity in this area is dominated by global slow waves, occasionally this area will produce a local slow wave that is out of phase with the global activity. These local slow waves will not be visible as single peak waves against the background of the much larger global slow waves. However, the local slow waves will interfere with the global slow waves, resulting in a downstream increase in multipeak waves. Future work taking advantage of local field potential recordings and multiunit activity in both humans and animals will be necessary to validate the conclusions drawn from source modeling and hd-EEG and enhance our understanding of the local regulation of sleep slow waves [15, 51].
Footnotes
The authors declare no competing financial interests.
References
- 1.Chauvette S, Volgushev M, Timofeev I. Origin of Active States in Local Neocortical Networks during Slow Sleep Oscillation. Cereb Cortex. 2010 doi: 10.1093/cercor/bhq009. [DOI] [PMC free article] [PubMed] [Google Scholar]
- 2.Steriade M, Nunez A, Amzica F. A novel slow (< 1 Hz) oscillation of neocortical neurons in vivo: depolarizing and hyperpolarizing components. J Neurosci. 1993;13(8):3252–65. doi: 10.1523/JNEUROSCI.13-08-03252.1993. [DOI] [PMC free article] [PubMed] [Google Scholar]
- 3.Destexhe A, Contreras D, Steriade M. Spatiotemporal analysis of local field potentials and unit discharges in cat cerebral cortex during natural wake and sleep states. J Neurosci. 1999;19(11):4595–608. doi: 10.1523/JNEUROSCI.19-11-04595.1999. [DOI] [PMC free article] [PubMed] [Google Scholar]
- 4.Born J, Rasch B, Gais S. Sleep to remember. Neuroscientist. 2006;12(5):410–24. doi: 10.1177/1073858406292647. [DOI] [PubMed] [Google Scholar]
- 5.Maquet P. The role of sleep in learning and memory. Science. 2001;294(5544):1048–52. doi: 10.1126/science.1062856. [DOI] [PubMed] [Google Scholar]
- 6.Tononi G, Cirelli C. Sleep function and synaptic homeostasis. Sleep Med Rev. 2006;10(1):49–62. doi: 10.1016/j.smrv.2005.05.002. [DOI] [PubMed] [Google Scholar]
- 7.Borbely AA. A two process model of sleep regulation. Hum Neurobiol. 1982;1(3):195–204. [PubMed] [Google Scholar]
- 8.Borbely AA, Achermann P. Sleep homeostasis and models of sleep regulation. In: Kryger MH, Roth T, Dement WC, editors. Principles and practice of sleep medicine. Elsevier Saunders; Philadelphia: 2005. pp. 405–417. [Google Scholar]
- 9.Borbely AA, Baumann F, Brandeis D, Strauch I, Lehmann D. Sleep deprivation: effect on sleep stages and EEG power density in man. Electroencephalogr Clin Neurophysiol. 1981;51(5):483–95. doi: 10.1016/0013-4694(81)90225-x. [DOI] [PubMed] [Google Scholar]
- 10.Franken P, Dijk DJ, Tobler I, Borbely AA. Sleep deprivation in rats: effects on EEG power spectra, vigilance states, and cortical temperature. Am J Physiol. 1991;261(1 Pt 2):R198–208. doi: 10.1152/ajpregu.1991.261.1.R198. [DOI] [PubMed] [Google Scholar]
- 11.Tononi G, Cirelli C. Sleep and synaptic homeostasis: a hypothesis. Brain Res Bull. 2003;62(2):143–50. doi: 10.1016/j.brainresbull.2003.09.004. [DOI] [PubMed] [Google Scholar]
- 12.Gilestro GF, Tononi G, Cirelli C. Widespread changes in synaptic markers as a function of sleep and wakefulness in Drosophila. Science. 2009;324(5923):109–12. doi: 10.1126/science.1166673. [DOI] [PMC free article] [PubMed] [Google Scholar]
- 13.Vyazovskiy VV, Cirelli C, Pfister-Genskow M, Faraguna U, Tononi G. Molecular and electrophysiological evidence for net synaptic potentiation in wake and depression in sleep. Nat Neurosci. 2008;11(2):200–8. doi: 10.1038/nn2035. [DOI] [PubMed] [Google Scholar]
- 14.Riedner BA, Vyazovskiy VV, Huber R, Massimini M, Esser S, Murphy M, Tononi G. Sleep homeostasis and cortical synchronization: III. A high-density EEG study of sleep slow waves in humans. Sleep. 2007;30(12):1643–57. doi: 10.1093/sleep/30.12.1643. [DOI] [PMC free article] [PubMed] [Google Scholar]
- 15.Vyazovskiy VV, Riedner BA, Cirelli C, Tononi G. Sleep homeostasis and cortical synchronization: II. A local field potential study of sleep slow waves in the rat. Sleep. 2007;30(12):1631–42. doi: 10.1093/sleep/30.12.1631. [DOI] [PMC free article] [PubMed] [Google Scholar]
- 16.Esser SK, Hill SL, Tononi G. Sleep homeostasis and cortical synchronization: I. Modeling the effects of synaptic strength on sleep slow waves. Sleep. 2007;30(12):1617–30. doi: 10.1093/sleep/30.12.1617. [DOI] [PMC free article] [PubMed] [Google Scholar]
- 17.Landsness EC, Crupi D, Hulse BK, Peterson MJ, Huber R, Ansari H, Coen M, Cirelli C, Benca RM, Ghilardi MF, Tononi G. Sleep-dependent improvement in visuomotor learning: a causal role for slow waves. Sleep. 2009;32(10):1273–84. doi: 10.1093/sleep/32.10.1273. [DOI] [PMC free article] [PubMed] [Google Scholar]
- 18.Marshall L, Helgadottir H, Molle M, Born J. Boosting slow oscillations during sleep potentiates memory. Nature. 2006;444(7119):610–3. doi: 10.1038/nature05278. [DOI] [PubMed] [Google Scholar]
- 19.Vyazovskiy V, Borbely AA, Tobler I. Unilateral vibrissae stimulation during waking induces interhemispheric EEG asymmetry during subsequent sleep in the rat. J Sleep Res. 2000;9(4):367–71. doi: 10.1046/j.1365-2869.2000.00230.x. [DOI] [PubMed] [Google Scholar]
- 20.Greenough WT, Larson JR, Withers GS. Effects of unilateral and bilateral training in a reaching task on dendritic branching of neurons in the rat motor-sensory forelimb cortex. Behav Neural Biol. 1985;44(2):301–14. doi: 10.1016/s0163-1047(85)90310-3. [DOI] [PubMed] [Google Scholar]
- 21.Hanlon EC, Faraguna U, Vyazovskiy VV, Tononi G, Cirelli C. Effects of skilled training on sleep slow wave activity and cortical gene expression in the rat. Sleep. 2009;32(6):719–29. doi: 10.1093/sleep/32.6.719. [DOI] [PMC free article] [PubMed] [Google Scholar]
- 22.Monfils MH, Teskey GC. Skilled-learning-induced potentiation in rat sensorimotor cortex: a transient form of behavioural long-term potentiation. Neuroscience. 2004;125(2):329–36. doi: 10.1016/j.neuroscience.2004.01.048. [DOI] [PubMed] [Google Scholar]
- 23.Huber R, Esser SK, Ferrarelli F, Massimini M, Peterson MJ, Tononi G. TMS-induced cortical potentiation during wakefulness locally increases slow wave activity during sleep. PLoS ONE. 2007;2(3):e276. doi: 10.1371/journal.pone.0000276. [DOI] [PMC free article] [PubMed] [Google Scholar]
- 24.Huber R, Ghilardi MF, Massimini M, Ferrarelli F, Riedner BA, Peterson MJ, Tononi G. Arm immobilization causes cortical plastic changes and locally decreases sleep slow wave activity. Nat Neurosci. 2006;9(9):1169–76. doi: 10.1038/nn1758. [DOI] [PubMed] [Google Scholar]
- 25.Huber R, Ghilardi MF, Massimini M, Tononi G. Local sleep and learning. Nature. 2004;430(6995):78–81. doi: 10.1038/nature02663. [DOI] [PubMed] [Google Scholar]
- 26.Gotman J. Noninvasive methods for evaluating the localization and propagation of epileptic activity. Epilepsia. 2003;44 (Suppl 12):21–9. doi: 10.1111/j.0013-9580.2003.12003.x. [DOI] [PubMed] [Google Scholar]
- 27.Hämäläinen MS, Hari R, Ilmoniemi R, Knuutila J, Lounasmaa O. Magnetoencephalography - theory, instrumentation, and applications to noninvasive studies of the working human brain. Rev Modern Physics. 1993;65(2):413–4978. [Google Scholar]
- 28.Nunez PL, Srinivasan R. Electric fields of the brain: the neurophysics of EEG. Oxford University Press Oxford; England: 2006. [Google Scholar]
- 29.Pascual-Marqui R, Esslen M, Kochi K, Lehmann D. Functional imaging with low resolution brain electromagnetic topography (LORETA): a review. Methods & Findings in Experimental & Clinical Pharmacology. 2002;24C:91–95. [PubMed] [Google Scholar]
- 30.Hallez H, Vanrumste B, Grech R, Muscat J, De Clercq W, Vergult A, D'Asseler Y, Camilleri KP, Fabri SG, Van Huffel S, Lemahieu I. Review on solving the forward problem in EEG source analysis. J Neuroeng Rehabil. 2007;4:46. doi: 10.1186/1743-0003-4-46. [DOI] [PMC free article] [PubMed] [Google Scholar]
- 31.Coatanhay A, Soufflet L, Staner L, Boeijinga P. EEG source identification: frequency analysis during sleep. C R Biol. 2002;325(4):273–82. doi: 10.1016/s1631-0691(02)01438-5. [DOI] [PubMed] [Google Scholar]
- 32.Ferri R, Bruni O, Miano S, Terzano MG. Topographic mapping of the spectral components of the cyclic alternating pattern (CAP) Sleep Med. 2005;6(1):29–36. doi: 10.1016/j.sleep.2004.06.010. [DOI] [PubMed] [Google Scholar]
- 33.Murphy M, Riedner BA, Huber R, Massimini M, Ferrarelli F, Tononi G. Source modeling sleep slow waves. Proc Natl Acad Sci U S A. 2009;106(5):1608–13. doi: 10.1073/pnas.0807933106. [DOI] [PMC free article] [PubMed] [Google Scholar]
- 34.Ghilardi M, Ghez C, Dhawan V, Moeller J, Mentis M, Nakamura T, Antonini A, Eidelberg D. Patterns of regional brain activation associated with different forms of motor learning. Brain Res. 2000;871(1):127–45. doi: 10.1016/s0006-8993(00)02365-9. [DOI] [PubMed] [Google Scholar]
- 35.Rechtschafflen A, Kales A. A manual of standardized terminology, techniques, and scoring system for sleep stages of human subjects. National Institutes of Health; Washington, DC: 1968. [Google Scholar]
- 36.Esser SK, Huber R, Massimini M, Peterson MJ, Ferrarelli F, Tononi G. A direct demonstration of cortical LTP in humans: a combined TMS/EEG study. Brain Res Bull. 2006;69(1):86–94. doi: 10.1016/j.brainresbull.2005.11.003. [DOI] [PubMed] [Google Scholar]
- 37.Grave de Peralta Menendez R, Gonzalez Andino S, Lantz G, Michel CM, Landis T. Noninvasive localization of electromagnetic epileptic activity. I. Method descriptions and simulations. Brain Topogr. 2001;14(2):131–7. doi: 10.1023/a:1012944913650. [DOI] [PubMed] [Google Scholar]
- 38.Michel CM, Murray MM, Lantz G, Gonzalez S, Spinelli L, Grave de Peralta R. EEG source imaging. Clin Neurophysiol. 2004;115(10):2195–222. doi: 10.1016/j.clinph.2004.06.001. [DOI] [PubMed] [Google Scholar]
- 39.Nichols TE, Holmes AP. Nonparametric permutation tests for functional neuroimaging: a primer with examples. Hum Brain Mapp. 2002;15(1):1–25. doi: 10.1002/hbm.1058. [DOI] [PMC free article] [PubMed] [Google Scholar]
- 40.Massimini M, Huber R, Ferrarelli F, Hill S, Tononi G. The sleep slow oscillation as a traveling wave. J Neurosci. 2004;24(31):6862–70. doi: 10.1523/JNEUROSCI.1318-04.2004. [DOI] [PMC free article] [PubMed] [Google Scholar]
- 41.Lemon R. Basic physiology of transcranial magnetic stimulation. In: Pascual-Leone A, Davey N, Rothwell J, Wasserman E, Puri B, editors. Handbook of Transcranial Magnetic Stimulation. Arnold; London: 2002. pp. 61–77. [Google Scholar]
- 42.Avanzino L, Teo JT, Rothwell JC. Intracortical circuits modulate transcallosal inhibition in humans. J Physiol. 2007;583(Pt 1):99–114. doi: 10.1113/jphysiol.2007.134510. [DOI] [PMC free article] [PubMed] [Google Scholar]
- 43.Borbely AA, Achermann P. Sleep homeostasis and models of sleep regulation. J Biol Rhythms. 1999;14(6):557–68. doi: 10.1177/074873099129000894. [DOI] [PubMed] [Google Scholar]
- 44.Krueger JM, Obal F. A neuronal group theory of sleep function. J Sleep Res. 1993;2(2):63–69. doi: 10.1111/j.1365-2869.1993.tb00064.x. [DOI] [PubMed] [Google Scholar]
- 45.Achermann P, Finelli LA, Borbely AA. Unihemispheric enhancement of delta power in human frontal sleep EEG by prolonged wakefulness. Brain Res. 2001;913(2):220–3. doi: 10.1016/s0006-8993(01)02796-2. [DOI] [PubMed] [Google Scholar]
- 46.Chesson AL, Jr, Ferber RA, Fry JM, Grigg-Damberger M, Hartse KM, Hurwitz TD, Johnson S, Kader GA, Littner M, Rosen G, Sangal RB, Schmidt-Nowara W, Sher A. The indications for polysomnography and related procedures. Sleep. 1997;20(6):423–87. doi: 10.1093/sleep/20.6.423. [DOI] [PubMed] [Google Scholar]
- 47.Brunner DP, Dijk DJ, Borbely AA. Repeated partial sleep deprivation progressively changes in EEG during sleep and wakefulness. Sleep. 1993;16(2):100–13. doi: 10.1093/sleep/16.2.100. [DOI] [PubMed] [Google Scholar]
- 48.Kirschstein T, Kohling R. What is the source of the EEG? Clin EEG Neurosci. 2009;40(3):146–9. doi: 10.1177/155005940904000305. [DOI] [PubMed] [Google Scholar]
- 49.Krakauer JW, Ghilardi MF, Mentis M, Barnes A, Veytsman M, Eidelberg D, Ghez C. Differential cortical and subcortical activations in learning rotations and gains for reaching: a PET study. J Neurophysiol. 2004;91(2):924–33. doi: 10.1152/jn.00675.2003. [DOI] [PubMed] [Google Scholar]
- 50.Dang-Vu TT, Schabus M, Desseilles M, Albouy G, Boly M, Darsaud A, Gais S, Rauchs G, Sterpenich V, Vandewalle G, Carrier J, Moonen G, Balteau E, Degueldre C, Luxen A, Phillips C, Maquet P. Spontaneous neural activity during human slow wave sleep. Proc Natl Acad Sci U S A. 2008;105(39):15160–5. doi: 10.1073/pnas.0801819105. [DOI] [PMC free article] [PubMed] [Google Scholar]
- 51.Nir Y, Staba RJ, Cirelli C, Fried I, Tononi G. Firing rate correlates of sleep slow waves in the human cortex and hippocampus. Society for Neuroscience; Chicago, IL: 2009. [Google Scholar]