Abstract
The high rate of mortality and frequent incidence of recurrence associated with hepatocellular carcinoma (HCC) reveal the need for new therapeutic approaches. In this report, we evaluated the efficacy of a novel chemo-immunotherapeutic strategy to control HCC and investigated the underlying mechanism that increased the antitumor immune response. We developed a novel orthotopic mouse model of HCC through seeding of tumorigenic hepatocytes from SV40 T antigen (Tag) transgenic MTD2 mice into the livers of syngeneic C57BL/6 mice. These MTD2-derived hepatocytes form Tag expressing HCC tumors specifically within the liver. This approach provides a platform to test therapeutic strategies and antigen specific immune-directed therapy in an immunocompetent murine model. Using this model, we tested the efficacy of a combination of oral sunitinib, a small molecule multi-targeted receptor tyrosine kinase (RTK) inhibitor, and adoptive transfer of tumor antigen-specific CD8+ T cells to eliminate HCC. Sunitinib treatment alone promoted a transient reduction in tumor size. Sunitinib treatment combined with adoptive transfer of tumor antigen-specific CD8+ T cells led to elimination of established tumors without recurrence. In vitro studies revealed that HCC growth was inhibited through suppression of STAT3 signaling. In addition, sunitinib treatment of tumor-bearing mice was associated with suppression of STAT3 and a block in T cell tolerance.
Conclusion
These findings indicate that sunitinib inhibits HCC tumor growth directly through the STAT3 pathway and prevents tumor antigen-specific CD8+ T cell tolerance, thus defining a synergistic chemo-immunotherapeutic approach for HCC.
Keywords: Sunitinib, receptor tyrosine kinase inhibitor (RTKI), adoptive transfer, STAT3, CD8+ T cells, T antigen (Tag)
Recent discoveries have improved our understanding of the pathogenesis and treatment of HCC1. However, the efficacy of current monotherapies including chemotherapy for HCC is still limited. Immunotherapy is effective against small tumor burdens and disseminated tumor. Thus, chemoimmunotherapy, which has been applied successfully in patients with lymphoma and leukemia2–3, is considered a promising synergistic strategy. The critical role of immunity in the progression or recurrence of HCC is best demonstrated by the low HCC recurrence rate after surgery in patients given adoptive immunotherapy4. CD8+ T cells, also known as cytotoxic or killer T cells, are particularly effective at killing tumor cells by releasing cytokines to mediate local inflammation and cytotoxic granules to induce tumor cell apoptosis.
Receptor tyrosine kinase inhibitors (RTKIs) have been shown to modulate the function of a variety of immune cells. The effects of RTKIs vary from immunosuppression to immune-activation depending on the pathways inhibited by the specific agent. In 2008, the RTKI sorafenib was approved by the Food and Drug Administration (FDA) to treat advanced HCC, increasing the median overall survival from 7.9 to 10.7 months5. However, sorafenib did not delay time to symptomatic progression and the cost of treatment remains prohibitive. Furthermore, sorafenib caused reduced proliferation of T-cells (CD4 and CD8) and impaired maturation and function of dendritic cells (DCs) leading to an immune-suppressed state6.
Sunitinib is a small molecule RTKI that was approved by the FDA for the treatment of advanced clear cell renal cell carcinoma (ccRCC) and gastrointestinal stromal tumors (GIST) in 20067. Sunitinib treatment induces both antiangiogenic and anti-tumor activity. In contrast to sorafenib, sunitinib decreases the population of regulatory T cells (Tregs) and circulating myeloid-derived suppressor cells (MDSCs), and has no detectable negative effects on DCs6. Recent work demonstrates that sunitinib-induced immune activation is associated with STAT3 inhibition8. Ablating STAT3 in tumor-associated myeloid cells increases the activation of DCs and CD8+ T-cells while reducing the activity of tumor-associated Tregs9. These findings indicate that sunitinib may play a role in activating the immune response in addition to its role in direct tumor killing. However, the tumor antigen-specific effects of sunitinib treatment in HCC remain unclear. Although early analysis of a recent Phase III trial suggests that sorafenib may be more effective than sunitinib as a monotherapy for HCC10, in this study we seek to evaluate the efficacy and mechanisms of sunitinib in combination with immunotherapy for this deadly disease.
To facilitate mechanistic evaluation of HCC tumorigenesis and treatment, distinct HCC mouse models, including xenograft tumors, chemical carcinogen-induced tumors, viral carcinogen-induced tumors, and genetically engineered tumors11, have been established. However, a practical and reproducible model using immunocompetent mice is needed for testing immune therapies. Transgenic MTD2 mice express SV40 T antigen (Tag) under control of the major urinary protein (Mup) promoter12, and consistently develop hepatic dysplasia leading to frank HCC by 8–10 weeks of age13. However, these mice uniformly express Tag in the entire population of hepatocytes from an early age, leading to an overwhelming hepatic tumor burden and profound immune tolerance toward Tag. Here, we develop an orthotopic model of HCC through seeding a small number of tumorigenic hepatocytes from MTD2 mice into the livers of syngeneic immunocompetent C57BL/6 mice. In this novel model, an average of 2.3 tumor nodules per mouse develop in a background of normal liver parenchyma.
Using this model, we evaluated the synergistic effect and mechanism of a combined chemo-immunotherapy approach on HCC progression. We demonstrate that sunitinib not only suppresses HCC growth through inhibiting the STAT3 pathway but activates the tumor antigen-specific CD8+ T cell response through a mechanism associated with reduction of Tregs and MDSCs. The combination of sunitinib with adoptive transfer of tumor antigen-specific CD8+ T cells prolongs survival and leads to the complete regression of established tumors without evidence of recurrence.
Materials and Methods
Peptides, sunitinib, antibodies and adenovirus
Peptides were synthesized and solubilized in DMSO14. Sunitinib (SU11248) was purchased from Pfizer, and prepared as a 20 mM stock solution in DMSO for in vitro studies and a 1% (w/v) working solution for in vivo studies in a viscous liquid (0.5% Polysorbate 80, 10% polyethylene glycol 300 and 19.2%(V/V) 0.1N hydrocloric acid). Antibodies against STAT3, STAT5, ERK1/2, cleaved PARP, Akt, pAkt (S473), pSTAT3 (T705), pSTAT3 (S727), pSTAT5 (T694), β-actin, p38 MAPK, p-p38 MAPK, are from Cell Signaling; ERK and pERK1/2 were from Santa Cruz. Unlabeled rat anti-mouse CD16/CD32, FITC-anti-CD8a and PE-anti-mouse IFN-γ were from BD Pharmingen. The adenovirus expressing wild-type STAT3 (wtSTAT3) and dominant-negative STAT3 (dnSTAT3) has been described elsewhere15.
Cells
Human HCC cell lines Sk Hep1 and Hep G2 were obtained from American Type Culture Collection (Manassas, VA), and grown in MEM with 10% FBS at 37°C in 5% CO2 humidified atmosphere. B6/WT-19 is a SV40 transformed C57BL/6 mouse embryo fibroblast line that expresses wild-type Tag14.
Mice
C57BL/6 mice were purchased from The Jackson Laboratory (Bar Harbor, ME). The murine lines, MTD212 and 41616, have been previously described, and served as the source of tumorigenic hepatocytes and adoptively transferred TCR-I CD8+ T cells, respectively. All experiments with mice were performed under a protocol approved by the Penn State Hershey Institutional Animal Care and Use Committee and received humane care according to the criteria outlined in the “Guide for the Care and Use of Laboratory Animals”.
Proliferation and apoptosis assay
2×10⁴ cells were treated with the indicated concentrations of sunitinib for cell proliferation and apoptosis assays at the indicated time with the Proliferation Assay Kit (Promega) and Apo-one Homogeneous Caspase-3/7 Assay kit (Promega) according to the manufacturer’s instructions.
Colony formation assay
2×10² cells were seeded into 6-well plates and treated with the indicated concentrations of sunitinib for two weeks. Cells were rinsed in PBS and stained with 0.05% crystal violet for photography and colony counting. To determine the effect of STAT3, cells were first transfected with wtSTAT3, or dnSTAT3, and then used to perform the colony formation assay.
Western blot analysis
The lysate of tumor tissue was prepared with M-PERTM mammalian protein extraction reagent (Thermo Fisher Scientific, Inc), and used to perform Western blot as previously described17.
Generation of an orthotopic murine model of HCC
The orthotopic murine model of HCC was developed through seeding of primary Tag transgenic hepatocytes from MTD2 mice into the livers of C57BL/6 mice by intra-splenic (ISPL) injection. Detailed information for this procedure is provided in supplemental Fig.1S. Tumor surveillance in mice was conducted with Magnetic Resonance Imaging (MRI), and started as early as two weeks post ISPL inoculation.
Immunohistochemical (IHC) studies
Liver biopsies were fixed with 10% formalin and embedded in paraffin. Five-micrometer sections were stained for Tag by IHC as described previously18.
Sunitinib administration, adoptive transfer of tumor specific TCR-I and immunization of mice
Mice were orally administrated 200 μl of sunitinib every other day at 40 mg/kg of body weight for two weeks, then received adoptive transfer of 5×10⁶ clontypic TCR-I CD8+ T cells derived from spleens and lymph nodes (LNs) of 416 mice via i.v. tail vein injection, and immunization with 3×10⁷ B6/WT-19 cells via i.p. injection. Splenic lymphocytes were analyzed nine days post immunization.
Flow cytometric analysis
Ex vivo staining of lymphocytes with MHC tetramers and primary Abs was performed on single-cell suspensions as described previously18. Flourescent-labeled antibodies were purchased from eBioscience. Stained cells were analyzed using a FACScan flow cytometer (BD Biosciences). Data were analyzed using FlowJo software (Tree Star). Staining for intracellular IFNγ was performed as previously described16. Staining for FoxP3 using buffer set from eBioscience was performed as manufacture’s instruction.
Lifespan Analysis
Mice were monitored for the development of ascites, impairment of gait and breathing, indicative of end-stage liver tumors. Survival curves were constructed by the Kaplan-Meier method using GraphPad Prism software. Significance was determined by single-factor analysis of variance, and validated using the log-rank test. P values of < 0.05 were considered significant.
Results
Establishment of a novel orthotopic model of HCC in immunocompetent mice
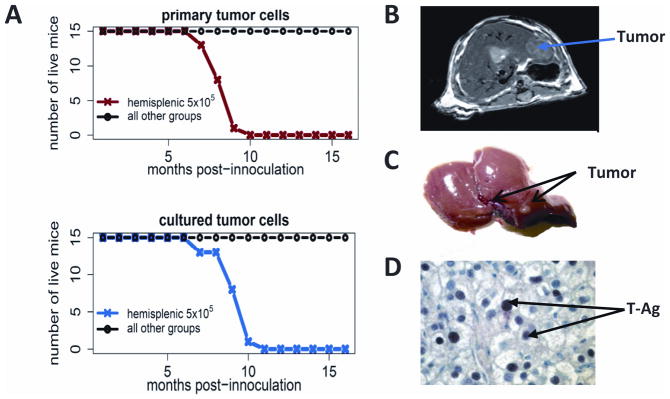
To establish a model system that can be used to evaluate the efficacy of chemo-immunotherapy and monitor the resulting immune response, C57BL/6 mice were administered two different doses of Tag tumorigenic hepatocytes (5×10⁵ and 5×10⁶ cells per mouse) from MTD2 mice via four distinct routes including intravenous (i.v.:tail vein), subcutaneous, intraperitoneal (i.p.), and intrasplenic (ISPL) inoculation. The results shown in Fig. 1A and Supplemental Table 1 indicate that only mice receiving ISPL inoculation with 5×10⁵ Tag tumorigenic hepatocytes developed tumors in the liver with 100% penetrance. The mice from other various groups survived and did not have signs of tumor development even 16 months after inoculation, including mice that received the higher cell dose by ISPL injection. Similar results were also found in mice inoculated with cultured Tag tumorigenic hepatocytes (Fig. 1A). Intrahepatic HCC tumors were detected as early as 4 weeks after inoculation by MRI (Fig. 1B) and confirmed by gross pathology (Fig. 1C). Identification of liver sections by two clinical pathologists indicated regions of well-defined spherical nodules with architectural disarrangement, irregularly shaped and enlarged nuclei, lack of sinusoidal arrangements, and liver cord structures. IHC analysis revealed Tag expression in the tumor tissue (Fig. 1D). Surface MHC Class I expression was maintained (data not shown). Macroscopic and IHC evaluation of spleens, lungs and kidneys did not reveal the presence of tumor (data not shown), indicating that tumor seeding and progression is liver-specific. Collectively, these results indicate that ISPL injection of a low dose of MTD2 tumorigenic hepatocytes results in the formation of liver-specific tumors in immunocompetent mice.
Fig. 1.
Establishment of a novel orthotopic mouse model of HCC in immunocompetent C57BL/6 mice. C57BL/6 mice were administered two different doses of MTD2 tumorigenic hepatocytes (5×10⁵ and 5×10⁶ cells per mouse) via four distinct routes including i.v. (tail vein), subcutaneous, i.p. and ISPL inoculation. The survival of mice was monitored over time. (A) Survival curve of mice inoculated with SV40 Tag transgenic hepatocytes under the distinct ways of injection. Upper, mice were inoculated with freshly isolated primary Tag transgenic hepatocytes; Lower, mice were inoculated with cultured Tag transgenic hepatocytes (B) Tumor within the liver was detected by MRI at 4 weeks post inoculation of SV40 Tag transgenic hepatocytes (C) Gross image of tumor shown in B and (D) Tag within the tumor was detected by IHC. The arrow indicates one of many Tag+ cells in the field.
Tag-specific CD8+ T cell response induced by distinct injection strategies
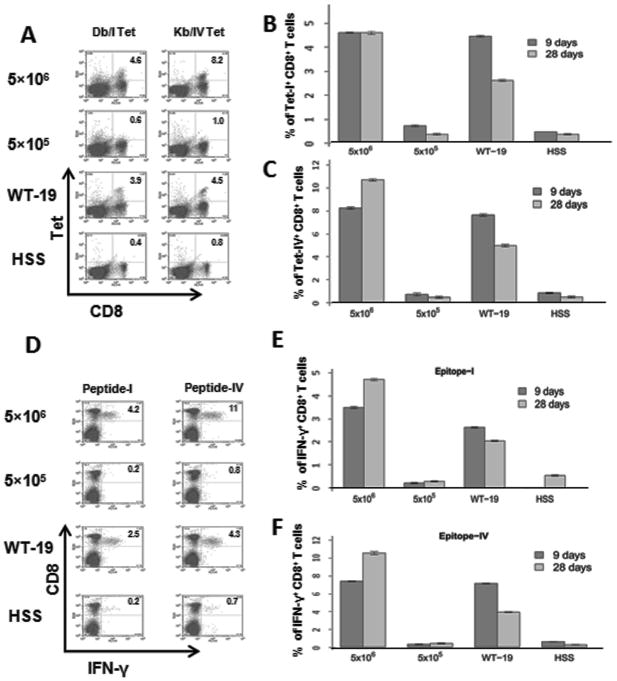
CD8+ T cells are considered to be the primary mediators of immunotherapy, and CD8+ T cell IFN-γ production is critical for tumor rejection in many models. To investigate the immunological basis for tumor growth following ISPL injection of a low dose of tumorigenic hepatocytes, we quantified the Tag-specific CD8+ T cell response in splenic lymphocytes using MHC tetramer and intracellular IFN-γ staining 19. MHC tetramer staining allows for detection of tumor antigen-specific CD8+ T cell accumulation independent of T cell function. The results in Fig. 2A demonstrate that no significant CD8+ T cell response against the well-documented Tag epitopes-I or -IV20 was detected in mice inoculated with 5×10⁵ Tag tumorigenic hepatocytes and control mice treated with HBSS at day 9 post inoculation. In contrast, both epitope-I- and epitope-IV-specific CD8+ T cells were readily detectable in mice inoculated with 5×10⁶ Tag tumorigenic hepatocytes (4.6% and 8.2% CD8+ T cells) or immunized with 3 × 10⁷ Tag transformed B6/WT-19 cells (3.9% and 4.5% CD8+ T cells). A similar trend was observed at day 28 (Fig. 2B and 2C). In addition, Tag-specific IFN-γ-producing CD8+ T cells were absent from mice inoculated with 5×10⁵ Tag tumorigenic hepatocytes (Fig. 2D, E and F), but were readily detected in mice that received the higher dose of hepatocyes. Similar results were found for the expression of TNF-α, perforin, and granzyme B, while no IL-2-producing CD8+ T cells were detected in any mice (Supplemental Fig. 2). These results indicate that ISPL inoculation of Tag tumorigenic hepatocytes at a low dose (5×10⁵ cells) failed to induce a CD8+ T cell-mediated immune response in immune competent mice, which was associated with tumor progression.
Fig. 2.
Tumor progression is associated with lack of Tag-specific CD8+ T cell response in immunocompetent mice. Splenic lymphocytes were isolated from mice inoculated with two different doses of SV40 Tag transgenic hepatocytes via ISPL injection, or immunized i.p. with B6/WT-19 cells and control HSS, respectively. (A) The frequency of Tag epitope I- or IV-specific CD8+ T cells was determined via ex vivo staining with MHC Db/I and Kb/IV tetramers at the indicated times post immunization. Pooled results for each group are shown for both epitope I (B) epitope IV (C) specific T cells. n=4 (D) The frequency of Tag peptide I or IV-specific IFN-γ-producing CD8+ T cells in the splenic lymphocytes were determined in parallel via intracellular cytokine staining. Combined results for all mice are shown in (E) (epitope I) and (F) (site IV). n=4; error bars represent mean ± S.D.
Tumor growth induces immunotolerance of CD8+ T cells
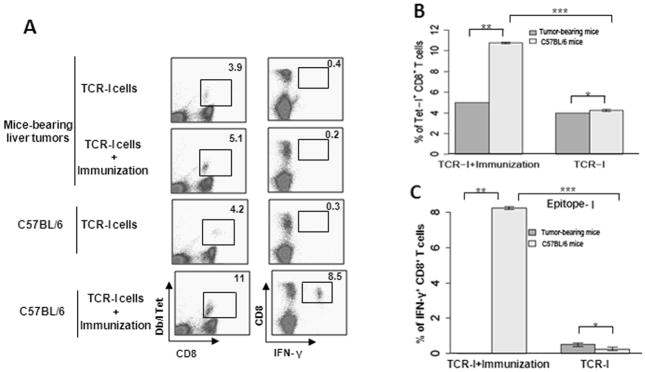
Tumor-induced immunotolerance is a key obstacle for immunotherapy. To assess immune responsiveness following the appearance of tumors, the Tag-specific CD8+ T cell response was evaluated in tumor-bearing mice with tumor volume > 120 mm3. Tumor-bearing mice received adoptive transfer of naïve epitope I-specific T cells (TCR-I) and subsequently received i.p. immunization with Tag-transformed B6/WT-19 cells. This approach serves to activate the adoptively transferred CD8+ T cells in vivo. Normal C57BL/6 mice received the same treatment and served as positive controls. In the absence of immunization, similar proportions of epitope-I-specific CD8+ T cells accumulated in the spleens of both tumor-bearing and tumor-free mice (p = 0.45, Fig. 3A and 3B), indicating limited activation of tumor-specific T cells in tumor-bearing mice. Following immunization with B6/WT-19 cells, TCR-I T cells expanded significantly in tumor-free mice, but not in tumor-bearing mice (p < 0.05, Fig. 3A and 3B). In addition, immunization of tumor-bearing mice failed to result in CD8+ T cell differentiation, as no peptide I-specific IFN-γ was produced in these mice (Fig. 3A and 3C). However, a significant proportion of CD8+ T cells produced IFN-γ following immunization of tumor-free C57BL/6 mice (p < 0.05, Fig. 3A and 3C). Collectively, these results indicate that HCC progression promotes immunotolerance of tumor-specific CD8+ T cells, preventing CD8+ T cell expansion and effector differentiation.
Fig. 3.
Tumor growth induces immunotolerance of CD8+ T cells in mice. C57BL/6 mice received ISPL inoculation of Tag tumorigenic hepatocytes at a low dose (5×10⁵ cells), and were monitored for tumor growth. After tumors reached a volume > 123.6 mm3, mice received adoptive transfer with naïve TCR-I cells and immunization with Tag transformed B6/WT-19 cells. Nine days post immunization, the splenic lymphocytes were isolated, and the frequency of epitope I-specific CD8+ T cells was determined by ex vivo staining with MHC Db/I tetramer (A and B) and by intracellular staining for IFN-y following in vitro stimulation with epitope I peptide (A and C). n=4; error bars represent means ± S.D.
Sunitinib treatment inhibits HCC growth in vitro
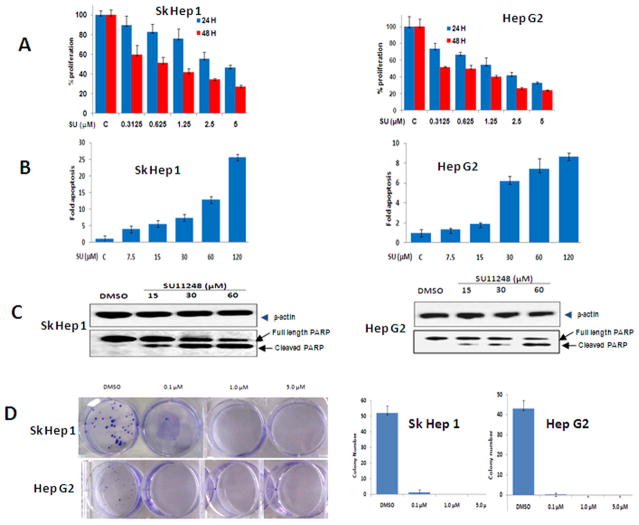
As the efficacy of sunitinib in HCC is not well documented, we utilized cellular proliferation, apoptosis and colony formation assay to assess its effect. Sunitinib treatment inhibited the proliferation of two HCC cell lines in a dose- and time-dependent manner. After treatment with 1.25 or 5.0 μM of sunitinib for 24 hours, the viability of Hep G2 cells was reduced to 45% and 25% of control (Fig. 4A). Treatment for 48 hours resulted in a further reduction. Similar results were observed in Sk Hep1 cells.
Fig. 4.
Sunitinib treatment inhibits HCC growth in vitro. (A) Sunitinib inhibits the proliferation of HCC cell lines in a time- and dose-dependent manner. Sk Hep 1 (left panel) and Hep G2 (right panel) cells were seeded into 96-well plates (5,000 per well) in MEM with 10% FBS and allowed to adhere overnight. Vehicle (DMSO) or sunitinib was added at the indicated concentrations the following day. After 24 or 48 hr. of treatment, cell proliferation assays were performed using Cell’Titer 96 Aqueous One Solution Cell Proliferation Assay Kit (Promega) according to the manufacturer’s instructions. n=3; error bars represent means ± S.D. (B) Sunitinib induces the apoptosis of HCC cell lines in a dose-dependent manner. Sk Hep1 (left panel) or Hep G2 (right panel) cells were seeded into 96-well plates (2×10⁴/well) in MEM with 1% FBS and allowed to attach overnight. Vehicle (DMSO) or sunitinib was added at different concentrations the following day. After 24 hr. of treatment, cell apoptosis assays were performed using Apo-one Homogeneous Caspase-3/7 Assay (Promega) according to the manufacturer’s instructions. n=3; error bars represent means ± S.D (C) A representative western blot of cleaved PARP from cells treated with sunitinib is shown. Sk Hep 1 (left panel) or HepG2 (right panel) cells were seeded into 6-well plates at a concentration of 1×10⁶/well and then treated with sunitinib at the indicated concentrations for 24 hr. The cells were lysed and proteins were extracted, quantified, and analyzed by Western blotting with antibodies to cleaved PARP and β-actin and (D) Sunitinib inhibits the colony formation of HCC cell lines. Sk Hep 1 and Hep G2 cells were plated at a density of 200 cells/well in 6-well plates and then treated with vehicle (DMSO) or the indicated concentration of Sunitinib the following day. After 2 weeks, the cells were stained with 0.05% crystal violet. A representative picture of colony staining is shown (left panel). Colonies were counted and the actual number of colonies in each well was plotted (right panels). n=3, error bars represent means +/- S.D.
Next, we investigated the effect of sunitinib in inducing apoptosis by measuring the activity of caspase-3/7. Treatment of Hep G2 cells with 7.5 and 30 μM of sunitinib for 24 hours increased the caspase-3/7 activities by 1.4- and 6-fold, respectively, compared to control (Fig. 4B). Similar results were also found in Sk Hep1 cells (Fig. 4B). These results indicate that higher concentrations of sunitinib induced apoptosis of HCC cells in a dose-dependent manner while low doses sunitinib inhibited cellular proliferation. These results are comparable to previous observations using RCC cell lines. To further confirm increased caspase-3/7 activity, the presence of cleaved PARP, was detected by western blot. A band corresponding to cleaved PARP was detected in sunitinib-treated cells, but not in controls (Fig. 4C). This band became more prominent with increasing concentrations of sunitinib, with a corresponding decrease in full length PARP (Fig. 4C). Colony formation assays demonstrated near complete growth inhibition in both HCC cell lines treated with low dose (0.1μM) sunitinib (Fig. 4D). These results indicate that sunitinib inhibits HCC growth and survival in vitro.
STAT3 is involved in sunitinib-induced suppression of HCC cell growth
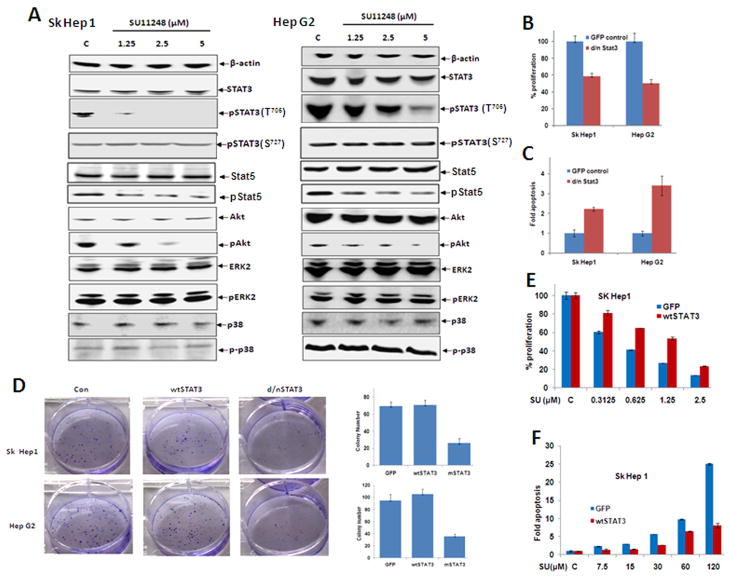
To elucidate the molecular mechanism of sunitinib-mediated suppression of HCC, a panel of well-characterized signaling molecules was utilized in sunitinib-treated HCC cells. As shown in Fig. 5A, sunitinib had no effect on total STAT3 and pSTAT3(S727) in Sk Hep1 cells; however, this treatment dramatically inhibited pSTAT3(T705). A similar dose-dependent, but incomplete reduction in pSTAT3(T705) was observed in Hep G2 cells (Fig. 5A). In contrast, no inhibitory effects were observed on STAT5, pERK-1/2 and p38 MAPK in either cell line. Only modest inhibitory effects were detected on pSTAT5 and pAkt with more notable effects in Sk Hep1 cells (Fig. 5A).
Fig. 5.
STAT3 is implicated in the mechanism of sunitinib-induced suppression of HCC growth. (A) Sk Hep1 or Hep G2 cells were seeded in 60mm petri dishes at a concentration of 2×10⁶/dish and then treated with sunitinib at the indicated concentrations for 24 hr. Cells were then lysed and proteins extracted, quantified, and analyzed by Western blotting with antibodies specific for the indicated proteins, and β-actin as an internal control. (B-D) Sk Hep 1 or Hep G2 cells were transfected with wtSTAT3 and dnSTAT3 and maintained overnight. Some of the cells transfected with dnSTAT3 were replated in 96-well plates at a density of 5×10⁴/well the following day and used for evaluation of proliferation (B) or suppression of apoptosis (C). In addition, some of the cells transfected with wtSTAT3 and dnSTAT3 were replated at a density of 300 cells/well in 6-well plates for colony forming assays (D). n=3, error bars represent mean +/- S.D.
To further confirm whether STAT3 is involved in the sunitinib-mediated suppression of HCC, we utilized wtSTAT3 and a dominant negative variant of STAT3. This dnSTAT3 inhibited the proliferation of Sk Hep1 and Hep G2 (Fig. 5B), induced the apoptosis (Fig. 5C), and dramatically decreased colony formation (Fig. 5D). In contrast, overexpression of wtSTAT3 rescued the sunitinib-mediated suppression of proliferation (Fig. 5E) and apoptosis (Fig. 5F). These results indicate that STAT3 is involved in sunitinib-mediated inhibition of HCC cell growth.
Sunitinib treatment leads to tumor regression and pSTAT3 reduction in vivo
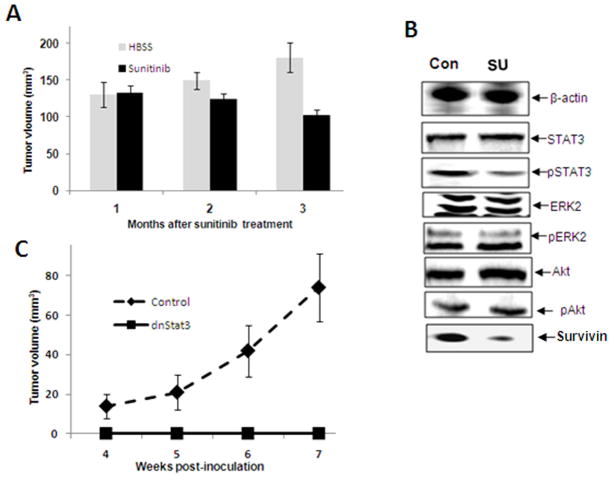
To investigate the effect of sunitinib on blocking tumor growth in vivo, tumor-bearing mice were orally administered sunitinib. Monthly MRI was used to monitor change in tumor size. The results in Fig. 6A demonstrate progressive tumor growth from 130 mm3 to 180 mm3 in vehicle-treated tumor-bearing mice, while sunitinib-treated mice demonstrate a continual decrease in tumor burden from 130 mm3 to 100 mm3 3 months post treatment. Western blot revealed decreased levels of pSTAT3 (T705) in the tumors from sunitinib-treated mice compared to vehicle-treated mice. Survivin, a direct downstream target of STAT3 is also reduced in the sunitinib-treated tumors (Fig. 6B). However, no detectable differences were found in the levels of ERK, pERK, Akt, pAkt and total STAT3. In a second in vivo analysis, dnSTAT3-transfected Tag tumorigenic hepatocytes do not produce tumors in C57BL/6 mice, while the empty vector-transfected hepatocytes demonstrate progressive tumor growth (Fig. 6C). These results indicate that sunitinib treatment induces the partial regression of established orthotopic HCC and is associated with a reduction in pSTAT3 within the tumor.
Fig. 6.
Sunitinib treatment leads to tumor regression and pSTAT3 reduction within the tumor. Groups of tumor-bearing mice with tumor volume > 123.6 mm3 were administered either sunitinib every other day for two weeks or treated with vehicle. (A) The tumor volume was measured by MRI every month after treatment with sunitinib and the fold-change in tumor volume is shown and (B) Tumor tissue was harvested from the mice treated above, and the proteins were extracted, quantified, and analyzed by Western blotting with antibodies specific for the indicated proteins and β-actin as an internal control. A representative result is shown. Con, vehicle treated mice; SU, sunitinib treated mice
Sunitinib treatment blocks CD8+ T cell tolerance in tumor-bearing mice
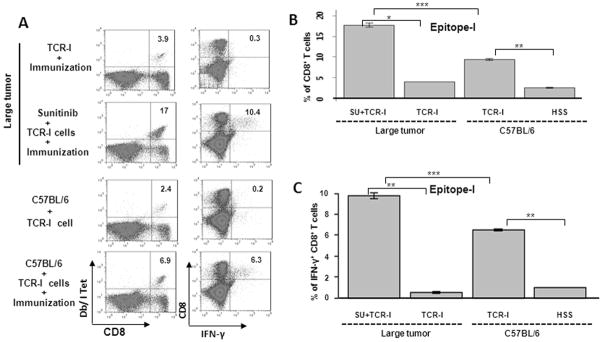
Suppression of STAT3 is crucial in both innate and adaptive immune responses against tumors8, 21. Therefore, we considered that sunitinib treatment may activate the tumor-specific immune response. Sunitinib treatment of tumor-bearing mice dramatically enhanced the accumulation of adoptively transferred TCR-I T cells following immunization (Fig. 7A and 7B). This level of accumulation was consistently higher than that observed in normal C57BL/6 mice (17% vs. 6.9%). This increase in TCR-I T cell accumulation was accompanied by effector T cell differentiation, as evidenced by the presence of a significant proportion of CD8+ T cells that produced IFN-γ in response to epitope-I peptide (Fig. 7A and 7C). These results indicate that sunitinib significantly suppresses tumor growth and also facilitates a high level of tumor-specific effector CD8+ T cell accumulation.
Fig 7.
Sunitinib treatment blocks CD8+ T cell tolerance in tumor-bearing mice. Groups of mice bearing tumors > 30mm wereorally administrated either sunitinib or vehicle every other day for two weeks, and then received immunization with B6/WT-19 cells 7 days after adoptive transfer with TCR-I cells. Control C57BL/6 mice received adoptive transfer with or without immunization. Nine days following immunization, splenic lymphocytes were isolated, and the frequency of Tag epitope I-specific CD8+ T cells was determined via ex vivo staining with MHC Db/I tetramer (A and B) or by intracellular staining for epitope I peptide-induced IFN-γ production (A and C). Representative flow cytometry results are shown in panel A while cumulative results are presented in panels B and C, n=4; error bars represent mean +/- S.D.
We also investigated that effect of sunitinib treatment on accumulation of Tregs and MDSCs in the lymphoid organs of tumor-bearing mice. Sunitinib treatment led to a reduced frequency of Tregs and MDSCs in the spleen (Supplemental Fig 3). This reduction in two key regulatory cell populations provides a potential explanation for the sunitinib-mediated activation of immune competence in HCC-bearing mice.
Combined sunitinib and adoptive T cell transfer promotes tumor eradication
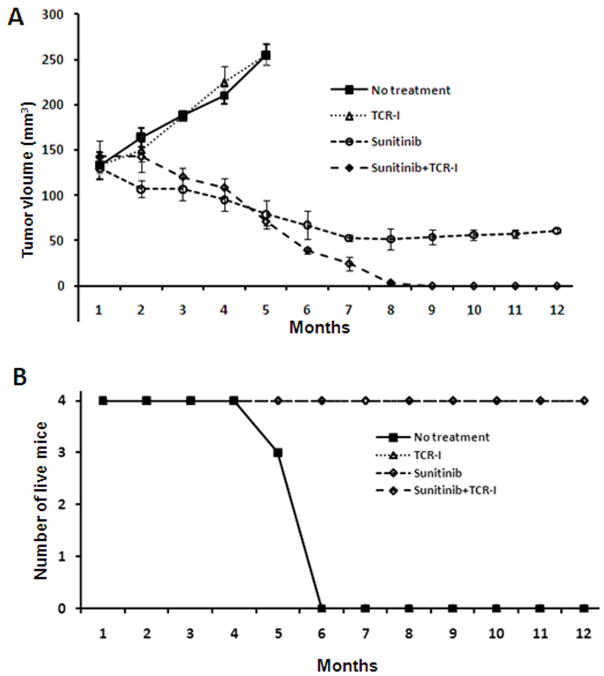
We investigated the therapeutic efficacy of sunitinib and adoptive transfer of tumor antigen specific TCR-I T cells against established HCC tumors. Cohorts of tumor-bearing mice received one of the following treatment regimens: vehicle administration; adoptive transfer of naïve TCR-I T cells; sunitinib administration; sunitinib administration plus adoptive transfer of naïve TCR-I T cells. Each group received immunization with B6/WT-19 cells following the indicated treatment. Mice treated with sunitinib plus immunization, with or without adoptive transfer demonstrated a significant reduction in tumor volume at 3 months when compared to vehicle-treated mice (140 to 120 cm3 and 130 to 100 cm3 vs 130 to 190 cm3). Mice treated with sunitinib and adoptive transfer plus immunization showed a further significant reduction in tumor size at 7 months (p < 0.001), and tumors regressed completely by 9 months. Importantly, tumors failed to recur in these mice up to 12 months after immunization (Fig. 8A).
Fig. 8.
The combination of sunitinib treatment with adoptive T cell transfer synergizes to promote HCC regression in tumor-bearing mice. The following tumor-bearing murine cohorts were utilized: Group 1, vehicle control; Group 2, adoptive transfer of naïve tumor-antigen-specific TCR-I T cells; Group 3, sunitinib every other day for two weeks; Group 4, sunitinib every other day for two weeks followed by adoptive T cell transfer. Mice in all 4 groups received immunization following the indicated treatment. Tumor diameters were monitored by MRI monthly (A), and the number of surviving mice in each group was determined over time and (B). N ≥ 3.
Survival analysis revealed 100% mortality in mice treated with only adoptive transfer of TCR-I cells or vehicle control within 6 months (Fig. 8B). In contrast, a 100% survival rate was achieved in mice treated with sunitinib plus immunization, despite the persistence of tumors in these mice (Fig. 8A and 8B). Mice treated with sunitinib and adoptive transfer of TCR-I cells plus immunization showed not only a 100% survival over 12 months, but showed complete tumor regression without recurrence. In summary, the adoptive transfer of TCR-I T cells and immunization alone had no efficacy on tumor growth while pretreatment with sunitinib followed by immunization induced partial regression of HCC. A strong synergistic effect of sunitinib treatment and adoptive T cell transfer resulted in the complete regression of established HCC and prevention of tumor recurrence.
Discussion
An orthotopic murine model of HCC without immune deficiency is essential for developing novel therapeutic strategies that involve the immune response. We developed such a model using immune-competent mice, in which a limited population of tumorigenic hepatocytes undergoes malignant transformation and form tumors within the normal liver parenchyma. This scenario differs from transgenic models where all cells of a given type carry a transgenic oncogene13. This model is more practical and relevant than ectopic transplantation models, which fail to consider the unique immune microenvironment of the liver. Use of SV40 Tag transgenic hepatocytes also facilitated monitoring of the tumor-specific immune response. While Tag is considered to be more immunogenic than some self tumor antigens, our results demonstrate that antigen-specific tolerance still develops following low level seeding of tumorigenic hepatocytes. In this scenario, Tag is representative of tumor specific antigens such as novel mutated antigens, Cancer/Testis antigens or virus-derived antigens which are not likely influenced by central T cell tolerance and for which host T cells may be available for immune targeting.
The antiangiogenic activities of sunitinib have been well documented experimentally and assessed clinically for several types of cancer22. However, the roles and mechanisms of sunitinib-mediated anti-tumor effects still remain incompletely defined. A recent report demonstrated that tumor biopsies from patients receiving sunitinib treatment for GIST showed marked tumor cell necrosis that was independent of a reduction in tumor vasculature23. It has also been reported that sunitinib alone or combined with other agents suppresses xenograft HCC tumor growth24. Xin and colleagues demonstrated that sunitinib inhibited STAT3 and induced direct RCC tumor cell apoptosis independent of tumor vasculature destruction8. Our investigation demonstrates that sunitinib directly suppresses HCC growth in vitro and in vivo, which is dependent on suppression of STAT3 activity. This STAT3-associated effect is supported by results demonstrating that dnSTAT3-transfected hepatocytes are not tumorigenic. Our results complement previous studies25, and indicate that sunitinib therapy can be effective against HCC, via STAT3 inhibition.
Given the poor prognosis for HCC with current therapies (< 5% 5 year overall survival), there is a major need for development of novel and more effective treatments26. The inability of monotherapies to eradicate tumors has led to a surge of investigation for combined therapeutic approaches for cancer treatment. The current study demonstrates that the combination of sunitinib and adoptive transfer of tumor antigen-specific T cells promoted extensive tumor regression without tumor recurrence over an extended period of time. This compelling evidence suggests that this combination immuno-therapy could provide a novel and effective therapeutic approach for the patients with advanced HCC.
This synergistic effect of sunitinib and adoptive transfer may be explained by the ability of sunitinib to activate the immune system and/or block tumor-associated immunosuppressive mechanisms in addition to direct killing of HCC tumor cells. This hypothesis is supported by our findings that sunitinib treatment leads to tumor regression, and high levels of TCR-I T cell accumulation in tumor-bearing mice. Furthermore, this increase in TCR-I T cell accumulation was associated with increased effector T cell differentiation, as evidenced by the presence of a significant proportion of CD8+ T cells that produced multiple effector molecules. Considering a prolonged period of time is observed between administration of sunitinib plus adoptive transfer of TCR-I T cells and complete tumor regression in our study, we postulate that sunitinib-induced direct anti-tumor effects progressively decrease the tumor size to a level where adoptively transferred T cells are able to efficiently eliminate residual tumor cells. The combined effects of sunitinib directly on the tumor and on the immune system may be advantageous over co-administration of other agents that effectively reverse T cell tolerance but have no direct impact on the tumor.
Although STAT3 is a recognized target of sunitinib, STAT3 is also an important molecule that mediates tumor-induced immunosuppression9, 27. Wang et al.28 reported that constitutive STAT3 activity inhibits DC functional maturation by inducing production of pleiotropic factors including IL-6, IFN-β, TNF-α, RANTES and IP-10. Blockade of STAT3 activates DCs and other components of innate immunity, leading to tumor-specific T-cell responses. Additionally, disruption of STAT3 signaling has been shown to enhance production of pro-inflammatory mediators by macrophages29 and led to the activation of antigen-specific CD4+ T cells in response to a normally tolerogenic stimulus in vivo30. Relevant to the current study, STAT3 signaling in Treg cells is crucial for their proliferation and function31 and our results support the STAT3-mediated reduction of Tregs in HCC-bearing mice. STAT3-ablation of hematopoietic system was found to produce increased levels of IFN-γ in CD8+ T cells after vaccination or exposure to tumor31. We demonstrated that sunitinib treatment dramatically decreased the expression level of pSTAT3 in vitro and in vivo, and also enhanced the anti-tumor immune response in vivo. This effect is possibly associated with the reduction of Tregs and MDSCs in tumor-bearing mice. These previous findings in combination with those presented in the current study indicate that ablation of STAT3 signaling in multiple types of immune cells has an overall immune-enhancing effect. In addition, these findings suggest that STAT3 inhibition could be the point of convergence for the immune-enhancing effects of sunitinib.
In conclusion, our results provide support for further investigation of the use of sunitinib in combination with immunotherapy for the treatment of HCC. Our results also suggest that chemotherapeutic agents, such as sunitinib that interrupts STAT3 signaling, may have direct antitumor effects through growth suppression, induction of apoptosis; and provide immune-enhancing effects through regulating the function of distinct immune cells. Further defining the underlying mechanisms of sunitinib activity should provide increased insight for the development of novel combination chemoimmunotherapies for the treatment of HCC.
Supplementary Material
Intrasplenic inoculation (ISPLI) procedure. C57BL/6 mice under general anesthesia with ketamine/xylazine undergo a ½ cm flank incision. (A) After spleen exposure and vascular pedicle dissection, two 10mm titanium clips are placed between the upper and lower branch of the splenic vasculature (B) Spleen is cut between the two clips (C) Hepatocytes are injected into the lower pole of the spleen and (D) A third titanium clip is placed on the lower branch of the vascular pedicle and the lower pole of the spleen is removed. Abdominal wall is sutured with 4-0 Vicryl suture.
Polyfunctional response of Tag-specific CD8 T cells from C57BL/6 mice. Splenic lymphocytes were isolated from mice inoculated with two different doses of SV40 Tag transgenic hepatocytes via ISPL injection, or immunized i.p. with B6/WT-19 cells or HSS. The isolated cells from the indicated mice were cultured with peptide I and IV for 6 h, and then stained for surface CD8 and intracellular effector molecules including TNF-α, perforin, and IL-2. For granzyme B expression assay, the isolated cells were directly used to stain without peptide I and peptide IV stimulation.
Sunitinib treatment reduces the magnitude of Tregs and MDSCs in tumor-bearing mice. Splenic lymphocytes were isolated from tumor-bearing mice treated with sunitinib or vehicle control every other day for two weeks, sequentially stained with specific mAbs, and analyzed by flow cytometry. A. The frequency of Tregs was determined via ex vivo staining with the indicated mAbs against CD4, CD25 and intracellular FoxP3. The representative dot plots show the expression of CD25 and FoxP3 in CD4+ splenocytes. B. The frequency of MDSCs were determined via ex vivo staining with mAbs against CD11b and Gr-1. The representative dot plots show the expression of CD11b and Gr-1 expression on splenocytes. C-D. Cumulative results. n=3; error bars represent mean +/- S.D.
Acknowledgments
Financial Support:
Grants Support: KO8-CA-100094 (K. F. Staveley-O’Carroll, PI) and R01-CA-025000 (T. D. Schell, PI) from the National Institutes of Health.
The authors thank Dr. Wafik El-Deiry for kindly reviewing our manuscript and Ralph L. Keil for helpful advice and discussion. We also thank Patti Miller and Jeremy Haley for expert technical assistance. The authors have declared that no conflict of interest exists.
List of Abbreviations
- HCC
hepatocellular carcinoma
- Tag
T antigen
- RTK
receptor tyrosine kinase
- RTKI
receptor tyrosine kinase inhibitor
- FDA
The Food and Drug Administration
- DCs
dendritic cells
- Tregs
regulatory T cells
- MDSCs
Myeloid-derived suppressor cells
- ccRCC
clear cell renal cell carcinoma
- GIST
gastrointestinal stromal tumors
- ISPL
intra-splenic
- Mup
Major Urinary Protein
- LNs
lymph nodes
- MRI
magnetic resonance imaging
References
- 1.El-Serag HB, Rudolph KL. Hepatocellular carcinoma: epidemiology and molecular carcinogenesis. Gastroenterology. 2007;132:2557–2576. doi: 10.1053/j.gastro.2007.04.061. [DOI] [PubMed] [Google Scholar]
- 2.Bujanda DA, Morales JA, Sarmiento UB, Grau SS, Franco CR. Clinical experience with biweekly CHOP plus rituximab chemoimmunotherapy for the treatment of aggressive B-cell non-Hodgkin lymphoma. Clin Transl Oncol. 2009;11:604–608. doi: 10.1007/s12094-009-0411-1. [DOI] [PubMed] [Google Scholar]
- 3.Schulz H, Klein SK, Rehwald U, Reiser M, Hinke A, Knauf WU, et al. Phase 2 study of a combined immunochemotherapy using rituximab and fludarabine in patients with chronic lymphocytic leukemia. Blood. 2002;100:3115–3120. doi: 10.1182/blood-2002-03-0972. [DOI] [PubMed] [Google Scholar]
- 4.Takayama T, Sekine T, Makuuchi M, Yamasaki S, Kosuge T, Yamamoto J, et al. Adoptive immunotherapy to lower postsurgical recurrence rates of hepatocellular carcinoma: a randomised trial. Lancet. 2000;356:802–807. doi: 10.1016/S0140-6736(00)02654-4. [DOI] [PubMed] [Google Scholar]
- 5.Llovet JM, Di Bisceglie AM, Bruix J, Kramer BS, Lencioni R, Zhu AX, et al. Design and endpoints of clinical trials in hepatocellular carcinoma. J Natl Cancer Instit. 2008;100:698–711. doi: 10.1093/jnci/djn134. [DOI] [PubMed] [Google Scholar]
- 6.Seliger B, Massa C, Rini B, Ko J, Finke J. Antitumour and immune-adjuvant activities of protein-tyrosine kinase inhibitors. Trends Mol Med. 2010;16:184–192. doi: 10.1016/j.molmed.2010.02.001. [DOI] [PubMed] [Google Scholar]
- 7.Chow LQ, Eckhardt SG. Sunitinib: from rational design to clinical efficacy. J Clin Oncol. 2007;25:884–896. doi: 10.1200/JCO.2006.06.3602. [DOI] [PubMed] [Google Scholar]
- 8.Xin H, Zhang C, Herrmann A, Du Y, Figlin R, Yu H. Sunitinib inhibition of Stat3 induces renal cell carcinoma tumor cell apoptosis and reduces immunosuppressive cells. Cancer Res. 2009;69:2506–2513. doi: 10.1158/0008-5472.CAN-08-4323. [DOI] [PMC free article] [PubMed] [Google Scholar]
- 9.Yu H, Kortylewski M, Pardoll D. Crosstalk between cancer and immune cells: role of STAT3 in the tumour microenvironment. Nat Rev Immunol. 2007;7:41–51. doi: 10.1038/nri1995. [DOI] [PubMed] [Google Scholar]
- 10.Cheng A, Kang Y, Lin D, et al. Phase III trial of sunitinib (Su) versus sorafenib (So) in advanced hepatocellular carcinoma (HCC). Paper presented at: ASCO Annual Meeting; June 3–7, 2011; Chicago, Illinois. 2011. [Google Scholar]
- 11.Frese KK, Tuveson DA. Maximizing mouse cancer models. Nat Rev Cancer. 2007;7:645–58. doi: 10.1038/nrc2192. [DOI] [PubMed] [Google Scholar]
- 12.Luis Garcia PS, Avella Diego, Tagaram Hepzibah, Jiang Yixing, Shereef Serene. MTD2 Mice Provide an Excellent Model for in Vivo Adoptive Transfer Studies to Evaluate the Tumor Antigen Specific T Cell Response to Hepatocellular. Journal of Surgical Research. 2008;144:386. [Google Scholar]
- 13.Held WA, Mullins JJ, Kuhn NJ, Gallagher JF, Gu GD, Gross KW. T antigen expression and tumorigenesis in transgenic mice containing a mouse major urinary protein/SV40 T antigen hybrid gene. EMBO J. 1989;8:183–191. doi: 10.1002/j.1460-2075.1989.tb03363.x. [DOI] [PMC free article] [PubMed] [Google Scholar]
- 14.Tevethia SS, Greenfield RS, Flyer DC, Tevethia MJ. SV40 transplantation antigen: relationship to SV40-specific proteins. Cold Spring Harb Symp Quant Biol. 1980;44(Pt 1):235–242. doi: 10.1101/sqb.1980.044.01.027. [DOI] [PubMed] [Google Scholar]
- 15.He TC, Zhou S, da Costa LT, Yu J, Kinzler KW, Vogelstein B. A simplified system for generating recombinant adenoviruses. Proc Natl Acad Sci U S A. 1998;95:2509–2514. doi: 10.1073/pnas.95.5.2509. [DOI] [PMC free article] [PubMed] [Google Scholar]
- 16.Staveley-O'Carroll K, Schell TD, Jimenez M, Mylin LM, Tevethia MJ, Schoenberger SP, et al. In vivo ligation of CD40 enhances priming against the endogenous tumor antigen and promotes CD8+ T cell effector function in SV40 T antigen transgenic mice. J Immunol. 2003;171:697–707. doi: 10.4049/jimmunol.171.2.697. [DOI] [PubMed] [Google Scholar]
- 17.Li G, Li W, Angelastro JM, Greene LA, Liu DX. Identification of a novel DNA binding site and a transcriptional target for activating transcription factor 5 in c6 glioma and mcf-7 breast cancer cells. Mol Cancer Res. 2009;7:933–943. doi: 10.1158/1541-7786.MCR-08-0365. [DOI] [PMC free article] [PubMed] [Google Scholar]
- 18.Otahal P, Schell TD, Hutchinson SC, Knowles BB, Tevethia SS. Early immunization induces persistent tumor-infiltrating CD8+ T cells against an immunodominant epitope and promotes lifelong control of pancreatic tumor progression in SV40 tumor antigen transgenic mice. J Immunol. 2006;177:3089–3099. doi: 10.4049/jimmunol.177.5.3089. [DOI] [PubMed] [Google Scholar]
- 19.Otahal P, Knowles BB, Tevethia SS, Schell TD. Anti-CD40 conditioning enhances the T(CD8) response to a highly tolerogenic epitope and subsequent immunotherapy of simian virus 40 T antigen-induced pancreatic tumors. J Immunol. 2007;179:6686–6695. doi: 10.4049/jimmunol.179.10.6686. [DOI] [PubMed] [Google Scholar]
- 20.Schell TD, Knowles BB, Tevethia SS. Sequential loss of cytotoxic T lymphocyte responses to simian virus 40 large T antigen epitopes in T antigen transgenic mice developing osteosarcomas. Cancer Res. 2000;60:3002–3012. [PubMed] [Google Scholar]
- 21.Darnell JE. Validating Stat3 in cancer therapy. Nat Med. 2005;11:595–596. doi: 10.1038/nm0605-595. [DOI] [PubMed] [Google Scholar]
- 22.Tugues S, Fernandez-Varo G, Munoz-Luque J, Ros J, Arroyo V, Rodes J, et al. Antiangiogenic treatment with sunitinib ameliorates inflammatory infiltrate, fibrosis, and portal pressure in cirrhotic rats. Hepatology. 2007;46:1919–1926. doi: 10.1002/hep.21921. [DOI] [PubMed] [Google Scholar]
- 23.Seandel M, Shia J, Linkov I, Maki RG, Antonescu CR, Dupont J. The activity of sunitinib against gastrointestinal stromal tumor seems to be distinct from its antiangiogenic effects. Clin Cancer Res. 2006;12:6203–6204. doi: 10.1158/1078-0432.CCR-06-1292. [DOI] [PubMed] [Google Scholar]
- 24.Huynh H, Ngo VC, Choo SP, Poon D, Koong HN, Thng CH, et al. Sunitinib (SUTENT, SU11248) suppresses tumor growth and induces apoptosis in xenograft models of human hepatocellular carcinoma. Curr Cancer Drug Targets. 2009;9:738–747. doi: 10.2174/156800909789271530. [DOI] [PubMed] [Google Scholar]
- 25.Amin HM, McDonnell TJ, Ma Y, Lin Q, Fujio Y, Kunisada K, et al. Selective inhibition of STAT3 induces apoptosis and G(1) cell cycle arrest in ALK-positive anaplastic large cell lymphoma. Oncogene. 2004;23:5426–5434. doi: 10.1038/sj.onc.1207703. [DOI] [PubMed] [Google Scholar]
- 26.Bruix J, Sherman M. Management of hepatoceullular carcinoma. Hepatology. 2005;42:1208–1236. doi: 10.1002/hep.20933. [DOI] [PubMed] [Google Scholar]
- 27.Lin L, Amin R, Gallicano GI, Glasgow E, Jogunoori W, Jessup JM, et al. The STAT3 inhibitor NSC 74859 is effective in hepatocellular cancers with disrupted TGF-beta signaling. Oncogene. 2009;28:961–972. doi: 10.1038/onc.2008.448. [DOI] [PMC free article] [PubMed] [Google Scholar]
- 28.Wang T, Niu G, Kortylewski M, Burdelya L, Shain K, Zhang S, et al. Regulation of the innate and adaptive immune responses by Stat-3 signaling in tumor cells. Nat Med. 2004;10:48–54. doi: 10.1038/nm976. [DOI] [PubMed] [Google Scholar]
- 29.Takeda K, Clausen BE, Kaisho T, Tsujimura T, Terada N, Forster I, et al. Enhanced Th1 activity and development of chronic enterocolitis in mice devoid of Stat3 in macrophages and neutrophils. Immunity. 1999;10:39–49. doi: 10.1016/s1074-7613(00)80005-9. [DOI] [PubMed] [Google Scholar]
- 30.Cheng F, Wang HW, Cuenca A, Huang M, Ghansah T, Brayer J, et al. A critical role for Stat3 signaling in immune tolerance. Immunity. 2003;19:425–436. doi: 10.1016/s1074-7613(03)00232-2. [DOI] [PubMed] [Google Scholar]
- 31.Kortylewski M, Kujawski M, Wang T, Wei S, Zhang S, Pilon-Thomas S, et al. Inhibiting Stat3 signaling in the hematopoietic system elicits multicomponent antitumor immunity. Nat Med. 2005;11:1314–1321. doi: 10.1038/nm1325. [DOI] [PubMed] [Google Scholar]
Associated Data
This section collects any data citations, data availability statements, or supplementary materials included in this article.
Supplementary Materials
Intrasplenic inoculation (ISPLI) procedure. C57BL/6 mice under general anesthesia with ketamine/xylazine undergo a ½ cm flank incision. (A) After spleen exposure and vascular pedicle dissection, two 10mm titanium clips are placed between the upper and lower branch of the splenic vasculature (B) Spleen is cut between the two clips (C) Hepatocytes are injected into the lower pole of the spleen and (D) A third titanium clip is placed on the lower branch of the vascular pedicle and the lower pole of the spleen is removed. Abdominal wall is sutured with 4-0 Vicryl suture.
Polyfunctional response of Tag-specific CD8 T cells from C57BL/6 mice. Splenic lymphocytes were isolated from mice inoculated with two different doses of SV40 Tag transgenic hepatocytes via ISPL injection, or immunized i.p. with B6/WT-19 cells or HSS. The isolated cells from the indicated mice were cultured with peptide I and IV for 6 h, and then stained for surface CD8 and intracellular effector molecules including TNF-α, perforin, and IL-2. For granzyme B expression assay, the isolated cells were directly used to stain without peptide I and peptide IV stimulation.
Sunitinib treatment reduces the magnitude of Tregs and MDSCs in tumor-bearing mice. Splenic lymphocytes were isolated from tumor-bearing mice treated with sunitinib or vehicle control every other day for two weeks, sequentially stained with specific mAbs, and analyzed by flow cytometry. A. The frequency of Tregs was determined via ex vivo staining with the indicated mAbs against CD4, CD25 and intracellular FoxP3. The representative dot plots show the expression of CD25 and FoxP3 in CD4+ splenocytes. B. The frequency of MDSCs were determined via ex vivo staining with mAbs against CD11b and Gr-1. The representative dot plots show the expression of CD11b and Gr-1 expression on splenocytes. C-D. Cumulative results. n=3; error bars represent mean +/- S.D.


