

Abstract
Many DNA regulatory factors require communication between distantly separated DNA sites for their activity. The type IIF restriction enzyme SfiI is often used as a model system of site communication. Here, we used fast-scanning atomic force microscopy to monitor the DNA cleavage process with SfiI and the changes in the single SfiI-DNA complex in the presence of either Mg2+ or Ca2+ at a scan rate of 1–2 fps. The increased time resolution allowed us to visualize the concerted cleavage of the protein at two cognate sites. The four termini generated by the cleavage were released in a multistep manner. The high temporal resolution enabled us to visualize the translocation of a DNA strand on a looped complex and intersegmental transfer of the SfiI protein in which swapping of the site is performed without protein dissociation. On the basis of our results, we propose that the SfiI tetramer can remain bound to one of the sites even after cleavage, allowing the other site on the DNA molecule to fill the empty DNA-binding cleft by combining a one-dimensional diffusion-mediated sliding and a segment transfer mechanism.
Introduction
The formation of site-specific protein-DNA complexes is a general mechanism involved in various genetic processes such as gene regulation, transposition, repair, and site-specific recombination. The mechanism by which the protein locates specific sites on DNA is a problem of great interest. Time-lapse atomic force microscopy (AFM) is capable of direct imaging of the dynamics of protein-DNA complexes including the site search process (1–4). However, the slow data acquisition rate of conventional AFM leaves many processes undetectable. Fast-scanning AFM that uses a miniaturized cantilever and a scanning stage to reduce the mechanical response time of the cantilever and to prevent the onset of resonant motion during high-speed scanning provides imaging in the subsecond timescale (5). The increased temporal resolution has allowed us to monitor restriction by the type IIP restriction enzyme ApaI (6), DNA looping and translocation by the type III restriction enzyme EcoP15I (7), and interaction of the type IIE restriction enzyme EcoRII with DNA (8).
A number of restriction enzymes show functional similarities and evolutionary relations to various site-specific DNA regulatory factors that bring spatially distant sites together (9–11). SfiI is the first restriction enzyme found that interacts through two distantly separated cognate sites to catalyze four-strand DNA breakage, similar to the mechanism seen in recombinases (12,13). It recognizes and binds two DNA duplexes containing the specific 13 bp recognition sites 5′-GGCCNNNN↓NGGCC-3′, where N is any nucleotide and the arrow indicates the site of cleavage (14). The recognition site can be on the same DNA molecule (in cis) or on two different molecules (in trans) (13,15). When the recognition sites are in cis, intervening looped DNA structures are formed. Like other type II restriction enzymes, SfiI requires only Mg2+ as a cofactor to catalyze the hydrolysis of DNA. However, in the presence of Ca2+ instead of Mg2+, SfiI forms the complex without subsequent cleavage (16). This makes SfiI a convenient model system for studying the multisite interactions and its characteristic features such as site-specific recognition and binding. Until now, DNA looping and subsequent cleavage by SfiI has been studied exclusively by biochemical methods (12,13,16–21). The cleavage at two sites by SfiI produces four termini of DNA, and the dynamics involved in the release of these termini influence the reaction mechanisms. Extensive biochemical studies have suggested the stepwise release of these termini (18). However, these studies provided only indirect evidence for this multistep process. Recently, the kinetics of the SfiI reaction through DNA looping was followed at a single molecule level by tethered particle motion analysis (22). Although this technique allows the DNA cleavage to be detected by monitoring the release of beads from the substrate, the information about the manner of release of cleaved DNA is not obtainable.
In the current study, using fast-scanning AFM, we directly visualize the concerted cleavage of individual DNA molecules by SfiI under conditions in which the cofactor Mg2+ was supplied. In addition, the site searching mechanism of SfiI protein was examined by imaging SfiI-DNA complexes under noncleaving conditions (in the presence of Ca2+, replacing Mg2+). Fast-scanning AFM images showed that the SfiI uses both one-dimensional (1D) diffusion translocation (sliding) mediated and intersegmental transfer to achieve communication between two separated DNA sites.
Materials and Methods
DNA and enzyme
Restriction enzyme SfiI (low bovine serum albumin) was purchased from New England Biolabs (Beverly, MA). The DNA fragment was prepared by similar methods to a previous study (20). Plasmid pEOF504 is derivative of the pUC8 plasmid with two SfiI recognition sites introduced by site-directed mutagenesis. Briefly, to introduce the first SfiI site, the entire pUC8 was polymerase chain reaction (PCR) amplified with two overlapping outward-directed primers containing the SfiI sequence. After SfiI digestion, the linear plasmid with the SfiI sticky ends was circularized with T4 DNA ligase. The new plasmid, with one SfiI site, was PCR-amplified with two other overlapping primers containing a SfiI sequence, in which the five central basepairs were selected to match the XhoI sequence. After XhoI digestion, the linear plasmid that had the XhoI sticky ends adjacent to the two SfiI half-sites was circularized.
To obtain DNA fragments with two SfiI recognition sites, PCR reaction was performed using the plasmid as a template and two primers 5′- GCC TTT TTA CGG TTC CTG GC -3′ and 5′-CCT CTG ACA CAT GCA GCT CC-3′. Fragments were purified from agarose gel as described above.
The DNA concentration was determined by absorption at 260 nm using the NanoDrop spectrophotometer (NanoDrop Technologies, Wilmington, DE).
Preparation of SfiI-DNA complexes
All complexes were assembled in Eppendorf tubes before deposition onto a mica surface for imaging. Reaction mixtures contained 0.004 units of SfiI, 5 ng/μl DNA fragment (905 bp), 10 mM HEPES (pH 7.5), 5 mM CaCl2, and 50 mM NaCl in a total volume of 10 μl. After incubating at an ambient temperature for 15 min, the complexes were filtered through a Montage PCR column (Millipore, Bedford, MA) to remove bovine serum albumin, and unbound protein. The filtrate was collected in the reaction buffer (10 mM HEPES (pH 7.5), 50 mM NaCl, and 5 mM CaCl2), and used for AFM imaging.
Fast-scanning AFM observation
Before deposition of the complexes onto a mica surface, a 1 mm diameter mica disc was treated with 1-(3-aminopropyl) silatrane (APS) (20,23,24). APS functionalizes the mica surface with amino groups. APS is less reactive and extremely resistant to hydrolysis and polymerization at neutral pH. The low rate of hydrolysis of the silatrane molecules can prevent formation of large polymer clusters on the surface and allows us to achieve clean surface modification of the mica. Next, 3 μl of a 167 μM water solution of APS was deposited onto a freshly cleaved mica surface. After 15 min incubation at ambient temperature, the mica disc was rinsed with 10 μl of water and dried with nitrogen gas. After drying, 3 μl of the sample mixture prepared as described previously was then deposited onto the APS-mica disc and incubated for 1 min. The sample was rinsed twice with 10 μl of the imaging buffer (10 mM HEPES (pH 7.5), 50 mM NaCl, and 5 mM MgCl2 (cleaving condition), or 5 mM CaCl2 (noncleaving condition)).
The AFM imaging was performed using a prototype fast-scanning AFM (see details in (25)). The sample was scanned in the imaging buffer solution at an ambient temperature with a small cantilever with dimensions (L × W × H) of 10 × 2 × 0.1 μm (Olympus, Tokyo, Japan). The cantilever had a spring constant of 0.1–0.2 N/m with a resonant frequency in water of 400–1000 kHz. The 600 nm × 450 nm (192 × 144 pixels) images were obtained at a scan rate of 1–2 fps. A sharp probe was deposited on each cantilever, using electron beam deposition by Nanotools (Munich, Germany). Individual frames of the movie files were imported into Image J (http://rsb.info.nih.gov/ij/) and analyzed. The videos and images were processed in Adobe Photoshop CS3 to enhance the contrast (Fig. S1 in the Supporting Material).
Analysis of single molecule trajectories
The two-dimensional diffusion coefficient of a molecule was calculated using the following equation:
where 〈Δr2〉 is the two-dimensional mean-square displacement of a molecule during time interval Δt.
Results and Discussion
DNA and protein diffusion on mica
Because AFM is a topographic imaging technique, success in time-lapse analysis by AFM requires conditions which satisfy two conflicting requirements; i), attachment of the molecules of interest onto the substrate surface, and ii), assuring free movement of the molecules on the substrate surface. We used positively charged APS mica whose surface has an enhanced affinity for negatively charged DNA molecules. This surface modification protocol with APS permits us to control the strength of the sample-surface interaction, allowing us to image DNA dynamics at the surface-liquid interface (26–28). The scanning probes used here were electron beam deposited, to produce a hydrophobic surface that is thought to have minimal interaction with DNA and proteins (3).
Fig. 1 A shows an initial frame of successive images of DNA molecules with unbound SfiI proteins captured at 2 fps under noncleaving conditions (for the complete movie, see Movie S1). In Fig. 1 B the counters of four individual DNA molecules from the successive images are superimposed to illustrate the DNA motion on the mica. The fluctuating motions of DNA strands in both x and y directions on the mica surface appeared to be equal, even though the scanning velocity was much greater in the x axis (fast scanning direction) than in the y axis (slow scanning direction), indicating that the scanning probe has little effect on the DNA motion. Of importance, it was previously reported that there is no injection of thermal energy originating from the high-speed scanning motion of the tip into the DNA molecule (29). Therefore, the observed DNA motion can be considered as native thermal diffusion.
Figure 1.
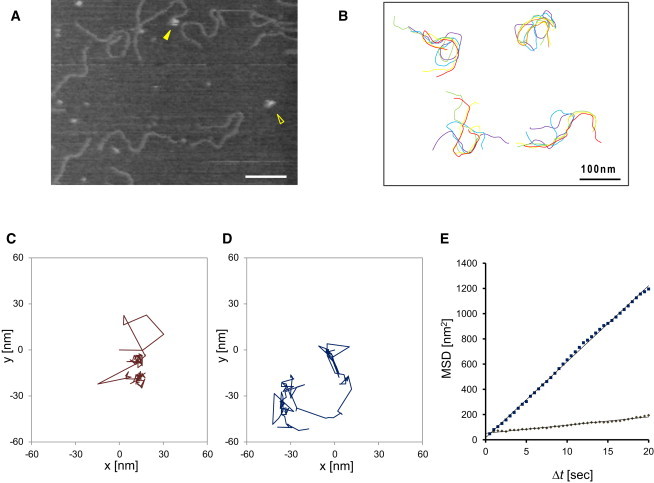
DNA and protein movement on a mica surface. (A) The initial frame of Movie S1. SfiI tetramers were indicated by yellow arrowheads. AFM imaging was performed in the presence of Ca2+. (B) Movement of DNA strands on a mica. The contours of four individual DNA strands were traced in every 20 frames and depicted in different colors. (C and D) Trajectories of SfiI protein on a mica. The particle position was plotted in x-y coordinates with the initial position as (0, 0). Trajectories in C and D correspond to the movements of the particles indicated by open arrowhead and solid arrow in A, respectively. (E) Mean-square displacement 〈Δr2〉 as a function of the interval time Δt. Mean-square displacement for trajectories (C) and (D) were shown by brown and blue squares, respectively. The straight lines represent linear fits to each trace.
Fig. 1, C and D, show sequentially recorded two individual SfiI protein motions on the mica surface, which seemed to be random. Noteworthy, when the interval time Δt was increased, the mean-square displacement of protein molecules, 〈Δr2〉, also increased (Fig. 1 E). Such behavior is typical for thermal diffusion, but would not be observed if the molecules were moved by the scanning probe.
From the previous considerations, we concluded that in our experimental system, the molecules have sufficient mobility to allow observation of dynamic process and, at the same time, the molecules remain within the observation area during the entire imaging.
DNA cleavage by SfiI protein
The SfiI protein under noncleaving condition was observed to form synaptic complexes on a 905 bp DNA fragment containing two recognition sites (Fig. 2, A and B). Measuring the lengths of the loop and the two arms showed that the proteins in these looped complexes were bound to the specific recognition sites (Fig. 2 C). This result is in line with the previous analysis performed with dried samples of SfiI-DNA complexes (20,30).
Figure 2.
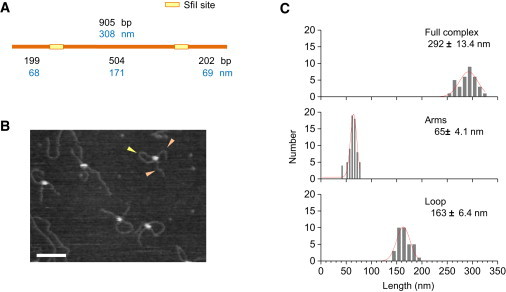
Visualization of SfiI-DNA complex. (A) The locations of the two SfiI recognition sites along a 905 bp fragment are shown. (B) AFM image of SfiI-DNA complex obtained under a Ca2+-containing buffer. Loop and short arms are indicated by yellow and orange arrowheads, respectively. Scale bar: 100 nm. (C) Histograms of the contour length of full complex, loop, and arms (N = 34). Gaussian-fitted curve is overlaid on each histogram.
Visualization of DNA cleavage was conducted under cleaving condition using fast-scanning AFM at the scan rate of 2 fps. Fig. 3 A shows the series of time-lapse AFM images of a cis-type looped SfiI-DNA complex that sequentially released the four termini from both sites (for the complete movie, see Movie S2). The specific loop structure remained until 0.5 s. At 1.0 s, one of the two sites was cut out and one short cleaved DNA was produced. The other site kept interacting with the protein for a while, however, at 6.0 s, the longer arm was dissociated and the last fragment was then released at 12.0 s. The three DNA products were clearly seen in the image at 19.0 s. The specificity of the cleavage was confirmed by measuring the length of the DNA fragments before and after the cleavage (Fig. S2).
Figure 3.
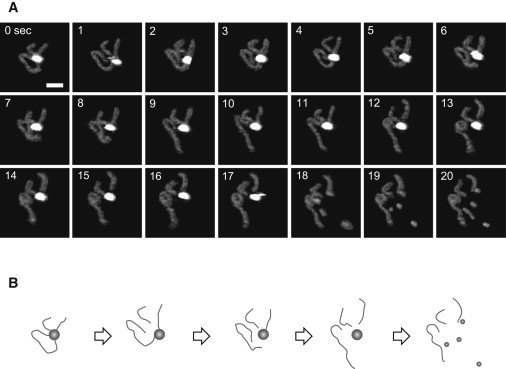
DNA cleavage by SfiI. (A) Successive time-lapse images of a SfiI-DNA reaction obtained at 2.0 fps in the presence of Mg2+. The elapsed time is indicated in each image. The image is cropped from the original scan size of 600 nm × 450 nm. Scale bar: 50 nm. (B) Schematic illustration of the DNA cleavage event.
After the dissociation from the DNA fragments, the SfiI tetramer immediately split into subunit particles (see 17 to 20 s in Fig. 3). This type of dissociation was commonly seen in our observation. This finding is in contrast to the previous gel filtration results indicating that SfiI forms tetramers not only when bound to DNA, but also when free in solution (12,18). However, it is conceivable that the force required for these stable complexes to dissociate may lead to dissociation of the protein subunits, which can later reassociate to form the preferred tetramer configuration. Because, in our AFM imaging, the final concentration of proteins on the mica surface was in a femtomolar order (which is over 106-fold lower concentration than that used for biochemical experiments), this suggests that under the conditions of the AFM experiments the association reaction is slow.
The lengths of free DNA molecules on the mica surface were measured (Fig. S3). Distribution of the lengths showed three peaks at 62 ± 10.5 nm, 182 ± 19.5 nm, and 280 ± 27.4 nm, corresponding to the expected lengths for the reaction products. However, it is noteworthy that there was no peak around the expected length of 230 nm (∼704 bp) for one site cleaved fragments, indicating SfiI cleaves both strands before dissociating from DNA. This is consistent with previous observations from biochemical assays by Halford and co-workers (12,13,16,18,31,32). Interestingly, it has been shown previously that the binding of SfiI to a DNA molecule with three recognition sites resulted in the cleavage of all three sites before the enzyme dissociates (21). This was contrary to the initial expectation that two of the sites would be cleaved in concert, while the third site remains intact. One proposed mechanism for this cleavage reaction for three sites is that, following the concerted cleavage of two of the sites, SfiI remains bound to one of the sites, allowing the third site to fill the empty DNA-binding cleft (21). Our AFM movies concur with this model, showing that even after the dissociation of two termini from one site, the SfiI tetramer can remain bound to one of the sites for a while.
How SfiI protein searches for its cognate sites
The question remains of how the empty DNA-binding cleft is filled? Because with Mg2+ the complexes with two SfiI sites would be followed by DNA cleavage and subsequent loss of the loop, imaging experiments were carried out under noncleaving conditions (Mg2+ cations were replaced with Ca2+) to examine the dynamics of the complex formation and dissociation. Under this condition, transient loop formation can be detected with the scan rate of 1 fps. A SfiI-DNA complex was bound to the one recognition site, which is located at around 200 bp from one end. Note that the first SfiI-DNA interaction happened before imaging, since protein and DNA were preincubated in the test tube. This complex was seen to form a diffusive loop and to change the loop size by 1D diffusion-mediated sliding (Fig. 4 A) (for the complete movie, see Movie S3). Fig. 4 B shows the changes in the length of the loop, the arms, and the contour of the complex from 0 to 13 s. The contour length stays close to the expected value of 305 nm for 905 bp DNA fragment, showing that dynamics of the molecule do not interfere with the measurements. The arm 1 also stayed at a value close to the expected 70 nm for the specific binding site throughout the imaging period, which shows that the protein remained specifically bound at this recognition site. The measurements of the loop length show a large fluctuation. The fluctuation is reflected in the length of arm 2. The peaks and valley match, suggesting sliding of the DNA strands.
Figure 4.
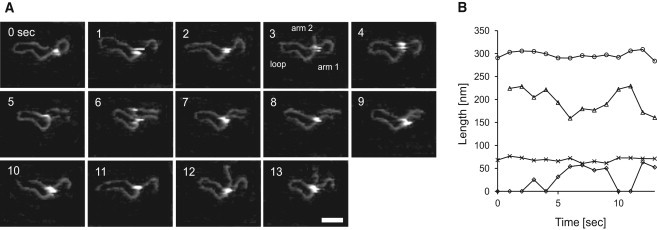
Looping and translocation by SfiI. Successive time-lapse images of a SfiI-DNA complex obtained at 1.0 fps in the presence of Ca2+. The elapsed time is shown in each image. The image is cropped from the original scan size of 600 nm × 450 nm. (A) Diffusive looping and following translocation, before dissociation of the complex at 18 s. Scale bar: 50 nm. (B) Changes in DNA length over a time period of 13 s (from 0 to 13 s) measured in 1 s intervals. The contour lengths of the entire molecule, loops, arm 1, and arm 2 are indicated by, (○), (Δ), (×), and (⋄), respectively.
In addition to the DNA translocation on the looped complex, intersegmental transfer of the SfiI protein was also monitored. Upon dissociation, the protein transiently bound to a single site before the complex quickly reformed in trans on an adjacent DNA molecule (Fig. 5) (for the complete movie, see Movie S4). The lengths of each complex before and after the transfer were measured to see a specificity of the interaction. A looped complex has the lengths of 64-154-61 nm (arm-loop-arm). After the transfer, the length of 67 nm for the resulting arm on the adjacent DNA also appears to correspond to specific binding. This transfer complex persists for 6 s before dissociating completely.
Figure 5.
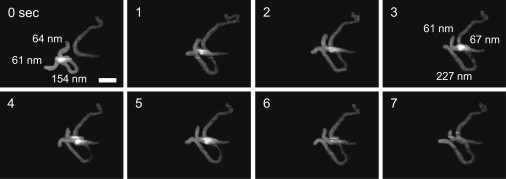
Segment transfer and formation of specific complex in trans. The experiment, same as Fig. 4, was performed with a different scanning rate. SfiI segment transfer event resulting in specific binding. Images were obtained at 2.0 fps. Scale bar: 50 nm.
Although kinetics of the sites' interaction has been well studied by both biochemical and single molecule methods (22,33,34), it has been difficult to elucidate the mechanism by which SfiI communicates with two noncontiguous sites. In one scheme, the protein first binds to one of the sites and then tracks along the DNA until it reaches the second site by 1D diffusion. The fast-scanning AFM successfully visualized this 1D diffusion-mediated DNA translocation. In another scheme for the sites' interaction, flexibility of DNA leads to juxtaposition of the sites in three-dimensional space and allows the protein to bind to both sites. It has been shown that the catenated DNA with a SfiI site in each ring was cleaved faster than uncatenated circular DNA and almost as rapidly as the parental plasmid with two sites in cis (35), indicating that SfiI interacts with two separated sites through 3D space. Here, we provided the first, to our knowledge, direct evidence of segment transfer by visualizing the rapid transfer of a cis looped complex to an adjacent DNA fragment to form a trans synaptic complex. This evidence supports the proposal that SfiI also uses intersegmental transfer as a mechanism to search for the specific sites.
Dissociation of SfiI protein
In our sequential images, dissociations of the SfiI protein were seen even after the formation of the specific complexes (Fig. 5). Previous studies of the SfiI lifetime have varied in their results. One study suggested that the looped complex formed in the presence of Ca2+ is stable for 7 h because the competitor DNA does not disrupt the preformed synaptic complex over time (16). A tethered particle motion experiment supports this, showing that no loop breakage was observed over a 3-h period for wild-type SfiI in Ca2+-containing buffer (22). However, under the same condition, a single-molecule fluorescence resonance energy transfer analysis measured a lifetime of 10–20 ms for the synaptic complex (36), and AFM force spectroscopy measurements yielded koff values ranging from 38 to 248 s−1 (37). The reason for the differences in the measured lifetimes in these studies is not clear, but the spacer sequence and the DNA length may possibly influence the obtained values.
AFM imaging is a technique requiring the sample to be bound to the surface. We used a positively charged APS mica surface that has an elevated affinity for negatively charged DNA molecules, allowing us to image DNA dynamics at the surface-liquid interface. At the same time, interaction of the protein complexes with the surface is a factor that may affect SfiI-DNA kinetics. We hypothesize that transiently dissociated DNA segments can be trapped by electrostatic interactions with the surface, interfering with the reassociation of the complex. These interactions shift the equilibrium of the association/dissociation dynamics toward dissociation that eventually leads to full dissociation of the SfiI-DNA complex. Very low protein concentration on the surface is also a possible factor that decreases the probability of stable complex formation.
The dissociation of the SfiI protein from DNA in this study contrasted with what was observed in the previous fast-scanning AFM study with another restriction enzyme that requires synapsis between more than one DNA recognition site (8). In that study, the EcoRII protein often stayed stably bound to a single recognition site upon dissociation of the synaptic complexes. Additionally, in AFM studies where dry imaging was performed, the EcoRII protein formed many intermediate complexes bound to varying numbers of recognition sites (24), whereas the SfiI protein formed two-site synaptic complexes almost exclusively (20). This reduced stability of the SfiI protein with a single site may explain the importance for an intersegmental transfer mechanism for the protein to rapidly locate a new binding site before it dissociates from the unstable one-site complex.
Conclusion
Although, the necessity of binding the sample to the mica surface cannot be eliminated, fast-scanning AFM has the great advantage that distinct reaction and interaction events can be identified by monitoring changes in the structure and the morphology of the enzyme-DNA complex. In this study, we have demonstrated directly that release of the cleaved DNA products can be a multistep process, with each terminus peeling off the tetrameric protein as a separate event. On the basis of our results, we believe that if SfiI remains bound to one of the sites, it allows the other site on the DNA molecule to fill the empty DNA-binding cleft by a diffusive looping or a segment transfer mechanism. When the second binding is nonspecific, SfiI uses a translocation mechanism along the DNA, by 1D diffusion-mediated sliding, in search of the second binding site.
Acknowledgments
We thank Alex Lushnikov for providing us with the DNA fragment. We also thank members of Corporate R&D Center of OLYMPUS for technical assistance.
This work was supported by a Human Frontier Science Program (K.T.) and by grants from the Japanese Ministry of Education, Culture, Sports, Science and Technology (Grant-in-Aid for Scientific Research on Priority Areas to K.T. and S.H.Y.) and from Japan Society for the Promotion of Science (Grant-in-Aid for Basic Research (A) to K.T. and (B) to S. H.Y., Japan-UK Bilateral Joint Project Award to K.T.), grants to Y.L.L. from National Science Foundation (NSF) (PHY-061590), U. S. Department of Energy (DOE) (DE-FG02-08ER64579), North Atlantic Treaty Organization (NATO) (CBN.NR.NRSFP 983204) and Nebraska Research Initiative (NRI), grant 0812853 (NSF East Asia and Pacific Summer Institutes (EAPSI) program) and a structural biology and biophysics fellowship to J.L.G. provided by Graduate Assistance in Areas of National Need (GAANN) funding (U.S. Department of Education grant P200A060150), and by SENTAN, JST (Japan Science and Technology Agency). R.M.H. holds a Biotechnology and Biological Sciences Research Council (BBSRC) Japan-Partnering Award. Y.S. is a recipient of the JSPS (Japan Society for the Promotion of Science) research fellow.
Contributor Information
Yuri L. Lyubchenko, Email: ylyubchenko@unmc.edu.
Kunio Takeyasu, Email: takeyasu@lif.kyoto-u.ac.jp.
Supporting Material
References
- 1.van Noort S.J., van der Werf K.O., Greve J. Direct visualization of dynamic protein-DNA interactions with a dedicated atomic force microscope. Biophys. J. 1998;74:2840–2849. doi: 10.1016/S0006-3495(98)77991-3. [DOI] [PMC free article] [PubMed] [Google Scholar]
- 2.Ellis D.J., Dryden D.T., Henderson R.M. Direct observation of DNA translocation and cleavage by the EcoKI endonuclease using atomic force microscopy. Nat. Struct. Biol. 1999;6:15–17. doi: 10.1038/4882. [DOI] [PubMed] [Google Scholar]
- 3.Guthold M., Zhu X., Bustamante C. Direct observation of one-dimensional diffusion and transcription by Escherichia coli RNA polymerase. Biophys. J. 1999;77:2284–2294. doi: 10.1016/S0006-3495(99)77067-0. [DOI] [PMC free article] [PubMed] [Google Scholar]
- 4.Abdelhady H.G., Allen S., Williams P.M. Direct real-time molecular scale visualisation of the degradation of condensed DNA complexes exposed to DNase I. Nucleic Acids Res. 2003;31:4001–4005. doi: 10.1093/nar/gkg462. [DOI] [PMC free article] [PubMed] [Google Scholar]
- 5.Ando T., Kodera N., Toda A. A high-speed atomic force microscope for studying biological macromolecules. Proc. Natl. Acad. Sci. USA. 2001;98:12468–12472. doi: 10.1073/pnas.211400898. [DOI] [PMC free article] [PubMed] [Google Scholar]
- 6.Yokokawa M., Yoshimura S.H., Takeyasu K. Fast-scanning atomic force microscopy reveals the molecular mechanism of DNA cleavage by ApaI endonuclease. IEE Proc., Nanobiotechnol. 2006;153:60–66. doi: 10.1049/ip-nbt:20050018. [DOI] [PubMed] [Google Scholar]
- 7.Crampton N., Yokokawa M., Henderson R.M. Fast-scan atomic force microscopy reveals that the type III restriction enzyme EcoP15I is capable of DNA translocation and looping. Proc. Natl. Acad. Sci. USA. 2007;104:12755–12760. doi: 10.1073/pnas.0700483104. [DOI] [PMC free article] [PubMed] [Google Scholar]
- 8.Gilmore J.L., Suzuki Y., Lyubchenko Y.L. Single-molecule dynamics of the DNA-EcoRII protein complexes revealed with high-speed atomic force microscopy. Biochemistry. 2009;48:10492–10498. doi: 10.1021/bi9010368. [DOI] [PMC free article] [PubMed] [Google Scholar]
- 9.Jo K., Topal M.D. DNA topoisomerase and recombinase activities in Nae I restriction endonuclease. Science. 1995;267:1817–1820. doi: 10.1126/science.7892605. [DOI] [PubMed] [Google Scholar]
- 10.Mucke M., Kruger D.H., Reuter M. Diversity of type II restriction endonucleases that require two DNA recognition sites. Nucleic Acids Res. 2003;31:6079–6084. doi: 10.1093/nar/gkg836. [DOI] [PMC free article] [PubMed] [Google Scholar]
- 11.Topal M.D., Conrad M. Changing endonuclease EcoRII Tyr-308 to Phe abolishes cleavage but not recognition: possible homology with the Int-family of recombinases. Nucleic Acids Res. 1993;21:2599–2603. doi: 10.1093/nar/21.11.2599. [DOI] [PMC free article] [PubMed] [Google Scholar]
- 12.Wentzell L.M., Nobbs T.J., Halford S.E. The SfiI restriction endonuclease makes a four-strand DNA break at two copies of its recognition sequence. J. Mol. Biol. 1995;248:581–595. doi: 10.1006/jmbi.1995.0244. [DOI] [PubMed] [Google Scholar]
- 13.Wentzell L.M., Halford S.E. DNA looping by the Sfi I restriction endonuclease. J. Mol. Biol. 1998;281:433–444. doi: 10.1006/jmbi.1998.1967. [DOI] [PubMed] [Google Scholar]
- 14.Qiang B.Q., Schildkraut I. A type II restriction endonuclease with an eight nucleotide specificity from Streptomyces fimbriatus. Nucleic Acids Res. 1984;12:4507–4516. doi: 10.1093/nar/12.11.4507. [DOI] [PMC free article] [PubMed] [Google Scholar]
- 15.Nobbs T.J., Williams S.A., Halford S.E. Phosphorothioate substrates for the SfiI restriction endonuclease. Biol. Chem. 1998;379:599–604. [PubMed] [Google Scholar]
- 16.Milsom S.E., Halford S.E., Szczelkun M.D. Analysis of DNA looping interactions by type II restriction enzymes that require two copies of their recognition sites. J. Mol. Biol. 2001;311:515–527. doi: 10.1006/jmbi.2001.4893. [DOI] [PubMed] [Google Scholar]
- 17.Williams S.A., Halford S.E. SfiI endonuclease activity is strongly influenced by the non-specific sequence in the middle of its recognition site. Nucleic Acids Res. 2001;29:1476–1483. doi: 10.1093/nar/29.7.1476. [DOI] [PMC free article] [PubMed] [Google Scholar]
- 18.Nobbs T.J., Szczelkun M.D., Halford S.E. DNA excision by the Sfi I restriction endonuclease. J. Mol. Biol. 1998;281:419–432. doi: 10.1006/jmbi.1998.1966. [DOI] [PubMed] [Google Scholar]
- 19.Nobbs T.J., Halford S.E. DNA cleavage at two recognition sites by the SfiI restriction endonuclease: salt dependence of cis and trans interactions between distant DNA sites. J. Mol. Biol. 1995;252:399–411. doi: 10.1006/jmbi.1995.0506. [DOI] [PubMed] [Google Scholar]
- 20.Lushnikov A.Y., Potaman V.N., Lyubchenko Y.L. DNA strand arrangement within the SfiI-DNA complex: atomic force microscopy analysis. Biochemistry. 2006;45:152–158. doi: 10.1021/bi051767c. [DOI] [PMC free article] [PubMed] [Google Scholar]
- 21.Embleton M.L., Vologodskii A.V., Halford S.E. Dynamics of DNA loop capture by the SfiI restriction endonuclease on supercoiled and relaxed DNA. J. Mol. Biol. 2004;339:53–66. doi: 10.1016/j.jmb.2004.03.046. [DOI] [PubMed] [Google Scholar]
- 22.Laurens N., Bellamy S.R., Wuite G.J. Dissecting protein-induced DNA looping dynamics in real time. Nucleic Acids Res. 2009;37:5454–5464. doi: 10.1093/nar/gkp570. [DOI] [PMC free article] [PubMed] [Google Scholar]
- 23.Shlyakhtenko L.S., Gall A.A., Lyubchenko Y.L. Silatrane-based surface chemistry for immobilization of DNA, protein-DNA complexes and other biological materials. Ultramicroscopy. 2003;97:279–287. doi: 10.1016/S0304-3991(03)00053-6. [DOI] [PubMed] [Google Scholar]
- 24.Shlyakhtenko L.S., Gilmore J., Lyubchenko Y.L. Direct visualization of the EcoRII-DNA triple synaptic complex by atomic force microscopy. Biochemistry. 2007;46:11128–11136. doi: 10.1021/bi701123u. [DOI] [PubMed] [Google Scholar]
- 25.Yokokawa M., Wada C., Takeyasu K. Fast-scanning atomic force microscopy reveals the ATP/ADP-dependent conformational changes of GroEL. EMBO J. 2006;25:4567–4576. doi: 10.1038/sj.emboj.7601326. [DOI] [PMC free article] [PubMed] [Google Scholar]
- 26.Mikheikin A.L., Lushnikov A.Y., Lyubchenko Y.L. Effect of DNA supercoiling on the geometry of holliday junctions. Biochemistry. 2006;45:12998–13006. doi: 10.1021/bi061002k. [DOI] [PMC free article] [PubMed] [Google Scholar]
- 27.Shlyakhtenko L.S., Lushnikov A.Y., Lyubchenko Y.L. Dynamics of nucleosomes revealed by time-lapse atomic force microscopy. Biochemistry. 2009;48:7842–7848. doi: 10.1021/bi900977t. [DOI] [PMC free article] [PubMed] [Google Scholar]
- 28.Lyubchenko Y.L., Shlyakhtenko L.S. AFM for analysis of structure and dynamics of DNA and protein-DNA complexes. Methods. 2009;47:206–213. doi: 10.1016/j.ymeth.2008.09.002. [DOI] [PMC free article] [PubMed] [Google Scholar]
- 29.Suzuki Y., Higuchi Y., Takeyasu K. Molecular dynamics of DNA and nucleosomes in solution studied by fast-scanning atomic force microscopy. Ultramicroscopy. 2010;110:682–688. doi: 10.1016/j.ultramic.2010.02.032. [DOI] [PubMed] [Google Scholar]
- 30.Lushnikov A.Y., Potaman V.N., Lyubchenko Y.L. Site-specific labeling of supercoiled DNA. Nucleic Acids Res. 2006;34:e111. doi: 10.1093/nar/gkl642. [DOI] [PMC free article] [PubMed] [Google Scholar]
- 31.Bellamy S.R., Milsom S.E., Halford S.E. A switch in the mechanism of communication between the two DNA-binding sites in the SfiI restriction endonuclease. J. Mol. Biol. 2007;373:1169–1183. doi: 10.1016/j.jmb.2007.08.030. [DOI] [PMC free article] [PubMed] [Google Scholar]
- 32.Embleton M.L., Siksnys V., Halford S.E. DNA cleavage reactions by type II restriction enzymes that require two copies of their recognition sites. J. Mol. Biol. 2001;311:503–514. doi: 10.1006/jmbi.2001.4892. [DOI] [PubMed] [Google Scholar]
- 33.Embleton M.L., Williams S.A., Halford S.E. Specificity from the synapsis of DNA elements by the Sfi I endonuclease. J. Mol. Biol. 1999;289:785–797. doi: 10.1006/jmbi.1999.2822. [DOI] [PubMed] [Google Scholar]
- 34.Bellamy S.R., Kovacheva Y.S., Halford S.E. Differences between Ca2+ and Mg2+ in DNA binding and release by the SfiI restriction endonuclease: implications for DNA looping. Nucleic Acids Res. 2009;37:5443–5453. doi: 10.1093/nar/gkp569. [DOI] [PMC free article] [PubMed] [Google Scholar]
- 35.Szczelkun M.D., Halford S.E. Recombination by resolvase to analyse DNA communications by the SfiI restriction endonuclease. EMBO J. 1996;15:1460–1469. [PMC free article] [PubMed] [Google Scholar]
- 36.Karymov M.A., Krasnoslobodtsev A.V., Lyubchenko Y.L. Dynamics of synaptic SfiI-DNA complex: single-molecule fluorescence analysis. Biophys. J. 2007;92:3241–3250. doi: 10.1529/biophysj.106.095778. [DOI] [PMC free article] [PubMed] [Google Scholar]
- 37.Krasnoslobodtsev A.V., Shlyakhtenko L.S., Lyubchenko Y.L. Probing interactions within the synaptic DNA-SfiI complex by AFM force spectroscopy. J. Mol. Biol. 2007;365:1407–1416. doi: 10.1016/j.jmb.2006.10.041. [DOI] [PMC free article] [PubMed] [Google Scholar]
Associated Data
This section collects any data citations, data availability statements, or supplementary materials included in this article.