

Abstract
A new theory, to our knowledge, is developed that describes the dynamics of a lipidic pore in a liposome. The equations of the theory capture the experimentally observed three-stage functional form of pore radius over time—stage 1, rapid pore enlargement; stage 2, slow pore shrinkage; and stage 3, rapid pore closure. They also show that lipid flow is kinetically limited by the values of both membrane and aqueous viscosity; therefore, pore evolution is affected by both viscosities. The theory predicts that for a giant liposome, tens of microns in radius, water viscosity dominates over the effects of membrane viscosity. The edge tension of a lipidic pore is calculated by using the theory to quantitatively account for pore kinetics in stage 3, rapid pore closing. This value of edge tension agrees with the value as standardly calculated from the stage of slow pore closure, stage 2. For small, submicron liposomes, membrane viscosity affects pore kinetics, but only if the viscosity of the aqueous solution is comparable to that of distilled water. A first-principle fluid-mechanics calculation of the friction due to aqueous viscosity is in excellent agreement with the friction obtained by applying the new theory to data of previously published experimental results.
Introduction
The creation and growth of pores in cell membranes is a biological process that has been studied for many years in a variety of contexts. For example, hemolysis—release of the internal contents of a red blood cell through a membrane pore—is a well known phenomenon in the field of medicine. Hemolysis most often occurs through colloidal osmotic swelling of the cell, which leads to membrane stretching. Excessive stretching causes local rearrangement of the membrane lipids into the configuration of a pore, more commonly referred to as membrane rupture. The efflux of the internal solution through the pore relieves the internal pressure, allowing the pore to then shrink (1). Pore formation and growth are generated by physical forces and do not require the presence of proteins; the process can be modeled by swelling of liposomes. A giant liposome, on the order of tens of microns, that is fully swollen cannot sustain an internal pressure without rupturing. As a practical matter, to study pores within giant liposomes, one wants to be able to control pore formation rather than have pores spontaneously and uncontrollably form as a result of osmotic swelling. Lipidic pores can be created by other means than osmotic swelling. Electroporation is one such method: applying a large electric field that exceeds the membrane dielectric breakdown results in pore formation (2–4). Illumination of liposomes that contain fluorescently labeled lipids is another method: excitation of the fluorescent probes leads to lipidic pores by a mechanism that is as yet poorly characterized (5). For giant liposomes, the pore that results upon illumination can be observed by light microscopy, allowing the time course of its enlargement and subsequent shrinkage to be experimentally quantified.
To understand the dynamic growth of pores generated by illumination, it is useful to know the basic experimental protocol. Experimenters initially adjust osmotic conditions to somewhat decrease the volume of the liposomes. This results in dynamic membrane foldings that undulate (6,7). The true area of the membrane is greater than inferred from measuring liposome radii by light microscopy. For bilayers containing fluorescent lipids, irradiation of an individual liposome causes the folding of its membrane to smooth out, generating a mechanical tension. A pore forms as a result of that tension. Membrane smoothing is observed as an increase in the measured liposome radii (8,9). In this way, pore formation can be triggered in a controlled manner and pores observed for an individual liposome.
Once a pore has formed, the observed evolution of its size can be divided into three distinct stages (see Fig. 1, upper). The first stage is characterized by rapid pore enlargement caused by the membrane tension generated by the pressure within the liposome. During this enlargement, pressure causes an outflow of the internal aqueous solution, which in turn results in a reduced membrane tension. The ever-decreasing mechanical tension becomes balanced by an opposing lateral force, directed into the center of the pore, created by the edge tension (also known as line tension) of the pore, and the pore radius reaches a maximum value. The pore then slowly shrinks (stage 2) as the pressure promoting pore enlargement becomes less consequential than the edge energy. When the pressure has effectively collapsed, only edge energy is present and a third stage—rapid pore closure—ensues.
Figure 1.
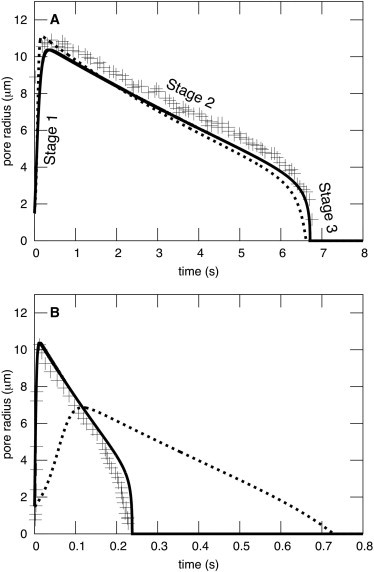
Pore evolution in giant liposomes exhibits three distinct stages. (A) Both BGS and DAV theory yield three stages, and parameters can be found for each theory to satisfactorily fit experimental data. But the curve for BGS (dashed curve) assumes ηs = 0 and ηl = 1000 P. The DAV model (solid curve), on the other hand, assumes ηs = 32 cP as used in the experiments of Brochard-Wyart et al. (10) (crosses), and the physically realistic ηl = 1 P. The other parameters were also as in Brochard-Wyart et al. (10) and are S = 0.0458 kT/nm2, γ = 2.5 kT/nm (∼10 pN), W = 0 kT/nm2, R0= 19.7 μm, R(t = 0) = 20.59 μm, r(t = 0) = 1.5 μm, C = 8.16, and d = 3 nm. (B) Parameters used are the same as in A, except that ηs = 1.13 cP. DAV fits well the experimental data Portet and Dimova (9) without adjusting any parameters (other than ηs), whereas BGS does not.
A quantitative physical theory that describes the observed evolution of a pore, which we denote as BGS theory, was devised by Brochard-Wyart, de Gennes, and Sandre (10). The membrane and aqueous solutions are obviously viscous, and both must move if a pore radius is to change. BGS theory uses membrane viscosity to explicitly account for the dissipation of energy that occurs during pore expansion/contraction. Building on previous efforts (11), BGS combined the efflux of aqueous solution, elastic membrane moduli, and a rate equation for the control of pore radius by the viscosity of the membrane. This is now the standard formalism to describe pore evolution in liposomes (8,9,12,13). In the BGS formalism, the flow of the liposome's internal aqueous solution through the pore is regulated by aqueous viscosity (by the same equation as our Eq. 2). But this flow does not exert a lateral force on the pore. A central assumption in the BGS theory is that the only dissipative force that generates lateral stress on the pore is internal to the lipid bilayer (i.e., membrane viscosity). The equation that considers lateral forces (Eq. 5 of Brochard-Wyart et al. (10)) implicitly assumes that water viscosity is zero. In contrast, experiments show that increasing the solution viscosity slows down pore kinetics (8,9).
Using BGS as a base, we have developed a new theory, to our knowledge, that accounts for the lateral stress on the pore arising from the tangential movement of a viscous aqueous solution relative to the membrane. We find that for giant liposomes, the kinetics of pore dynamics is controlled by water viscosity and is virtually independent of the value of membrane viscosity. Also, for small, submicron liposomes, pore kinetics are affected by membrane viscosity if the aqueous viscosity is comparable to that of distilled water. Our theory leads to fundamentally different physical conclusions than does the BGS formalism, and as we will show, curve-fitting our theory to experimental data consistently yields reasonable physical parameters, whereas BGS theory does not. Because this new theory reveals the dominance of aqueous viscosity in controlling pore dynamics, we refer to the model as DAV theory.
A careful mathematical treatment of a physical problem—in this case one directed toward a biological process—can lead to results that extend beyond the initial problem. This study of pore dynamics in a membrane led us to calculate the coefficient of friction for an infinite two-dimensional sheet with a hole (i.e., a pore in a bilayer), surrounded by a viscous medium; the radius of the hole changes as a consequence of a force applied to its rim. To our knowledge, a solution to this general problem has not been previously presented in the literature. For the radius to increase, material of the infinite sheet must flow away from the hole; for the radius to decrease, material must flow toward the hole. A derivation and expression for the friction associated with this flow is given in Appendix A.
The Dav Model
The total tension of the bilayer, σ, promotes pore enlargement, and edge tension of the pore, γ, induces pore shrinkage. The pore radius, r(t), is given by
| (1) |
where , ηs is the viscosity of the aqueous solution, ηm is membrane viscosity, and γ is line tension. ηm is related to lipid viscosity (ηl) through the relation ηm = ηld, where d is the thickness of the bilayer. We let d = 3 nm for all figures of this article. The first term Cηsrr′ explicitly accounts for the lateral stresses generated on the bilayer as water movement shears along the dilating or shrinking pore. The precise form of this term is justified in Appendix A. C is a coefficient that is determined through a curve fit to experimental data for pore size as a function of time during rapid pore closure. We show that this determination of C agrees with the value obtained by directly calculating the friction for a changing radius of a circular hole in a two-dimensional sheet surrounded by water, as described in Appendix A. The total tension on the bilayer, σ, is due to mechanical stretching of the membrane and the surface tension, W, of a relaxed bilayer. The tension is given by σ = S(A − A0)/A0 + W, where S is the modulus for increasing the area of the bilayer, A0 is the area of the membrane in the absence of mechanical tension, and A is the area in the presence of tension. For membranes that have folds (sometimes referred to as wrinkles), the area of the membrane refers to an apparent area. The apparent area is inferred from the microscopically observed radius of the liposome as if the membrane were a smooth sphere; the existence of possible folds is ignored. Immediately after a pore has formed, the experimentally observed radius of the liposome is greater than that before illumination. This shows that the undulations have been suppressed, strongly indicating that, for unexplained reasons, a mechanical tension was generated by illumination. Because tension suppresses undulations, S should therefore be the elastic modulus for smoothing out membrane folding by mechanical tension, as has been assumed (10), rather than the modulus of stretching a membrane by increasing the area/lipid. The typical value of the modulus for unfolding into a smooth membrane is S = 0.046 kT/nm2 (10) and the typical modulus for increasing the area/lipid is S = 60 kT/nm2 (14), where k is the Boltzmann constant and T is the absolute temperature in units of Kelvin.
Invoking conservation of mass, the rate of volume efflux, −d/dt[(4/3)πR3], of the internal solution leaving a liposome of radius R is equal to the flux through the pore. This flux is Pr3/(3ηs), where P is the pressure drop across the pore (see pg. 153 of Happel and Brenner (15)). Using the Laplace relation P = 2σ/R yields (as derived by a somewhat alternate means in BGS), the rate of change of the liposome radius:
| (2) |
It is worth noting that the outflow of the aqueous solution does not generate stresses on the pore and therefore does not directly promote any changes in pore radius.
In the common experimental practice of inducing pores by photoactivation of fluorescently labeled lipids, the liposome is not fully swollen but has membrane undulations before illumination. From conservation of lipid, the total area of the liposome membrane after illumination, including the area of a pore of radius r, is given by , where R0.is the radius of the liposome before the formation of the pore in the absence of mechanical tension, and the stretching modulus S is set equal to the two-dimensional modulus for unfolding of the undulations to yield a taut membrane (16). We follow BGS in making the approximation W = 0, as mechanical tension is more consequential than relaxed surface tension in controlling pore growth and shrinkage. This equation for the area of the liposome yields an algebraic equation for σ in terms of r and R (and the modulus S and experimentally measured R0). The radius of the initial pore is r(0).
Solution of two differential equations (Eqs. 1 and 2) determines the two unknowns, r and R. We used the forward Euler method to solve these equations. The time intervals were chosen as follows: the lifetime of a pore was set over the interval (0,1), which was partitioned into 104 equal subdivisons. A finer time mesh is required over the rapid rising stage of pore growth than over the subsequent stages in which pore size changes more slowly. This was accomplished by cubing the time of each subdivision. After cubing, the time point of each subinterval was multiplied by the lifetime of the pore, yielding the true time for each point. In simulations where the pore radius increased quickly (stage 1), squaring, instead of cubing, led to numerical outputs that exceeded error tolerances, and therefore we used cubing. We checked the precision of our simulation by comparing runs for reference partitions with 103 and 105 subdivisions.
Results and Discussion
Dynamics of pores in large liposomes is controlled by the aqueous viscosity
We first consider giant liposomes, tens of microns in diameter, since pores in these liposomes spend the majority of their time at radii of microns, and so, the pore can be experimentally observed. To introduce the basic pattern of the pore dynamics, we plot pore radius as a function of time for BGS theory (Fig. 1 A, dashed curve) and for DAV theory (Fig. 1 A, solid curve). Both approaches exhibit the three stages of pore dynamics that are experimentally observed (crosses) by light microscopy (8–10,12,13), and both can quantitatively match experimental pore dynamics. However, in BGS theory, only membrane viscosity controls pore dynamics, since the theory ignores stresses caused by aqueous viscosity. Consequently, in BGS theory, a value of ηl on the order of 1000 poise must be assumed so that the theoretically derived dynamics are as slow as the actual experimental time courses. This is an inordinately large and physically unrealistic value of viscosity; it is at least 100 times greater than measured membrane viscosities. DAV theory explicitly accounts for the experimental fact that aqueous viscosity slows pore dynamics (through Eq. 1). For the solid curve of DAV theory in Fig. 1 A, we set ηl = 1 P, a realistic value that is typical for lipid bilayer membranes, and ηs = 32 cP, because this is the viscosity of the solution that was used experimentally (a glycerol, water, sucrose/glucose solution) in the BGS study (10). Although both DAV and BGS theories account for the experimental data quite well (Fig. 1 A, crosses), they utilize very different values for the physical parameter ηl.
In contrast to the conclusions of BGS theory, DAV theory shows that aqueous viscosity is by far the dominant source of friction during changes in pore radius. This becomes strikingly apparent when aqueous viscosity is varied. In Fig. 1 B, ηs = 1.13 cP. The curves for both DAV and BGS use their respective values of ηl of Fig. 1 A. Clearly, DAV (solid curve) accurately describes the experimental pore dynamics (Fig. 1 B, crosses, obtained from Portet and Dimova (9)), whereas BGS (dashed curve) predicts a significantly slower change in pore radius in both the opening and rapid closure stages. Although it would be possible to modify the value of ηl so that BGS fits the data of Fig. 1 B, doing so requires that ηl become a fitting parameter rather than an experimentally determined physical parameter. In other words, in BGS, membrane viscosity has to be recalibrated when the experimental aqueous viscosity is adjusted. In contrast, both ηl and ηs are true physical parameters in DAV theory, independent of each other, and are set by their experimental values. As will be shown, DAV theory does not have any free parameters.
DAV theory shows that membrane viscosity is, in fact, irrelevant for pore dynamics in giant liposomes. This can be appreciated by fixing the aqueous viscosity at ηs = 32 cP and changing ηl by 2 orders of magnitude above and below the experimentally realistic ηl = 1 P (Fig. 2). These large variations in ηl barely affect pore dynamics (see Fig. 2, where thel three curves are superimposed). Experimentally, using solutions with a viscosity of ηs = 1.133 cP yielded considerably faster pore dynamics, with lifetimes of a few hundred milliseconds (9) rather than the lifetimes of several seconds observed in the solutions of ηs = 32 cP (10). This supplies direct experimental proof that the frictional forces arising from the viscosity of water greatly affect pore dynamics. Calculations from DAV theory show that aqueous viscosity alone is the relevant source of friction (Fig. 2). Membrane viscosity must become more consequential for less viscous aqueous solutions. However, even for an aqueous solution with ηs = 1 cP (the viscosity of distilled water), membrane viscosity is largely irrelevant for time courses of pore evolution (Fig. 3). The value of ηl must be increased by two orders of magnitude (Fig. 3, dotted curve) above the experimental value (1 P; Fig. 3, solid curve) for the slowing of pore dynamics by membrane viscosity to be consequential according to the DAV model.
Figure 2.
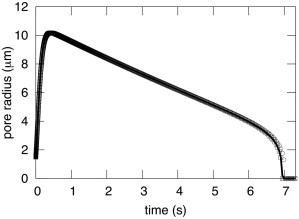
Pore evolution in giant liposomes is independent of membrane viscosity for viscous solutions. The viscosity of the aqueous solution was fixed at ηs = 32 cP, and the viscosity of the lipid was varied by four orders of magnitude: η1 = 1 P (solid curve), 100 P (circles), and 0.01 P (squares). The three curves are virtually identical, lying on top of each other. All other parameters are the same as in Fig. 1.
Figure 3.
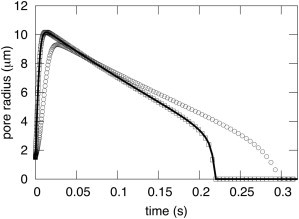
Pore evolution in giant liposomes is somewhat dependent on membrane viscosity for low-viscosity solutions. For the aqueous viscosity of distilled water, ηs = 1 cP (solid curve), the dynamics of pore evolution is slowed by the unnaturally large lipid viscosity of η1 = 100P (circles). The dynamics were independent of membrane viscosity for smaller values of ηl, as shown for 0.01 P (squares). All other parameters are as given in the legend of Fig. 1.
Results of calculating pore radius for ηs = 1 cP, 16 cP, and 32 cP directly demonstrate that aqueous viscosity does indeed control pore dynamics in our formalism (Fig. 4). In fact, pore dynamics scales in time with ηs; the maximum pore diameter is independent of the aqueous viscosity and pore lifetime is directly proportional to ηs.
Figure 4.
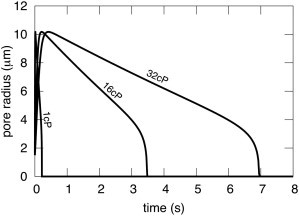
Pore kinetics in giant liposomes scales with aqueous viscosity. ηs was assigned the values of 1 cP, 16 cP, and 32 cP, fixing η1 = 1 P and the other parameters as listed in the legend of Fig. 1. The maximum pore radius is independent of ηs; the value of r at every time is scaled by ηs.
How reliable is DAV theory?
To test whether the model accurately predicts pore properties, we used it to obtain edge tension of pores from experimental data of pore dynamics published in prior studies (9). We used the experimental points of pore radius during rapid closure, stage 3, to obtain γ. Both r and σ are small in the rapid closure stage, so σr ∼ 0. Consequently, Eq 1 can be written as . Solving for r(t) gives . Here tc is the integration constant and is equal to the lifetime of the pore. DAV theory therefore predicts that for rapid pore closure (stage 3), the time at which a given pore radius occurs varies as a quadratic function of that radius. Therefore, as previously noted (in the Appendix of Brochard-Wyart (10)), energy dissipation dominated by aqueous viscosity results in a pore radius that varies as a square-root function of time. In contrast, if one assumes ηs = 0 in Eq. 1, pore radius and time vary linearly. Least-squares fits verify a quadratic dependence between time and radius, as predicted by the DAV model (Fig. 5). Therefore, the DAV theory model correctly predicts the functional form of pore radius versus time that is observed experimentally in stage 3.
Figure 5.
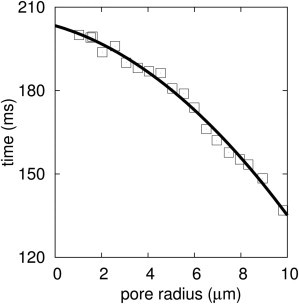
Stage of rapid pore closure, stage 3, is a quadratic function of time. A least-squares fit of the data of Portet and Dimova (9) yielded t = 0.34r2 – 4.5r + 209.4, with a confidence of 0.99. By combining this quadratic equation, the calculated value of C = 8.16, and ηs = 1.133 cP as used for the experiment, one obtains the edge tension, γ, of the pore. The calculation yields γ = 13.5 pN.
To obtain the value of γ, the constant C must be determined. C is a fundamental constant of DAV theory and therefore should have the same value in every experiment, independent of membrane and solution viscosities, as well as any other variability in experimental conditions. To test this prediction, we evaluated C by curve-fitting data from experiments performed independently by two different groups. For one fit, we used the data of Karatekin et al. (8) (see their Fig. 7) and their determined value of γ = 10 pN (based on BGS theory) to find that C = 8.16. For the other fit, we used data of Portet and Dimova (9) (see their Fig. 2). We let γ = 14 pN, as they determined from stage 2 of their data (see next paragraph), fit their data of stage 3, and found that C = 8.44. As described in Appendix A, we also determined C by calculating the shear stresses generated by water on a circular hole within an infinite sheet. The hole contracts as a result of edge tension (i.e., the force on the rim of the hole) exceeding the force of surface tension at the rim. The solution to the fluid mechanical process yields C = 8.09. The fact that the values of C determined by the two curve fits to data agree with each other and with the theoretical value provides additional quantitative support for the validity of the DAV theory of pore dynamics.
Figure 7.
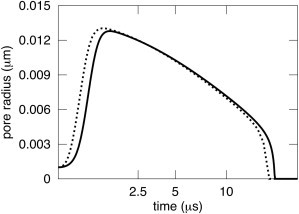
Membrane viscosity does not appreciably affect pore dynamics in small liposomes for viscous aqueous solutions. Predicted pore dynamics was only slightly faster in the absence of membrane viscosity, η1= 0 P (dashed curve) than in its presence, η1= 1 P (solid curve). R0= 300 nm, R(0) = 309 nm, and ηs = 32 cP. All other parameters are provided in the legend of Fig. 6. Note that the time axis is not linear, but rather is plotted as the square root of time.
Pore edge tension can be obtained by analyzing stage 3 as well as stage 2
Values of edge tension of lipidic pores have previously been obtained by analyzing the second stage of pore dynamics (8,9,12,13). It has been observed in experiments that pore radius decreases slowly in stage 2, and both BGS and DAV theory are consistent with this observed decrease. The value of line tension is obtained from the slope of the linear decrease in R2lnr versus time. The decrease in pore radius is described by the same equation for both models, because r′ is small in this stage: The stresses generated through membrane viscosity are given by ηmr′. The efflux of the aqueous solution through the pore is slow in the second stage, and pore closure is slow. Consequently, ηmr′ is less than both mechanical and edge tensions. Therefore, the drastic disparity in values of ηm derived by curve fitting in the two theories is irrelevant for the description of pore closure during stage 2. In essence, the time course of pore closure in stage 2 is determined by the rate of water efflux, and virtually any model that accounts for conservation of mass will correctly describe this time course, independent of the rate equation (Eq. 1). The predictions of the theories are different only if the force generated by water movement along the membrane, ηsrr′, is significant. This is the case in stages 1 and 3. Because r′ is small in stage 2, the two theories make the same predictions for this stage (and only for this stage).
The pore shrinks during stage 2, because the edge tension is somewhat greater than the force of mechanical tension: the edge tension, , remains constant as r decreases, but the magnitude of the force from mechanical tension, , continuously decreases during this closure. The time course of the slow shrinkage is determined by the rate at which the mechanical tension, σ(r,R), decreases. This tension decreases as the internal contents of the liposome continue to exit; this is determined by Eq. 2, and it is independent of Eq. 1. For both BGS and DAV theory, the constant downward slope of R2lnr versus time varies linearly with γ; and all other parameters that affect the slope are constant or controlled experimentally. This allows the value of γ to be obtained from stage 2 (9). We checked that the value of γ determined from DAV theory was not sensitive to the precise value chosen for the constant C. We used the theoretical value of C = 8.09, fit the data of stage 2 of Portet and Dimova (9), and obtained γ = 13.5 pN. Alternatively, we used the value C = 8.44 derived by curve-fitting the data of stage 3 of the same experiment, fit the data of stage 2, and found γ = 14 pN. These similar values of γ show that small changes in the value of C used for curve fits has little affect on the determined value of γ, and vice versa. This illustrates that the numerically determined solutions of the equations of the DAV model are computationally stable and do not vary greatly as input parameters are smoothly varied.
As a practical matter, it is simpler to obtain values of γ, as traditionally done, from data of stage 2 rather than those of stage 3. But from a mathematical point of view, stage 3 is preferable. To obtain γ from stage 2, it must be assumed that σ is constant for the duration of that stage and that 2ηmr′ ≪ rσ − γ (Eqs. 10 and 11, respectively, of Karatekin et al. (8)). Although these assumptions are reasonable, as stated in the previous paragraph, σ decreases with the efflux of internal contents, and in some cases, the second assumption can break down. At stage 3, it is certain that σr ≪ γ, since the pore is rapidly closing, and the quadratic fit rigorously follows without additional assumptions or approximations.
DAV theory predicts that aqueous friction limits pore growth in stage 1, with the initial slope of the rising phase inversely proportional to aqueous viscosity (calculations not shown). If one assumes ηs = 0, on the other hand, the initial rate of pore growth is predicted to vary inversely with membrane viscosity (and cannot depend on the solution viscosity). Experimental data show that the rapid pore enlargement in stage 1 is slower for a larger aqueous viscosity (8–10).
Pores within small liposomes surrounded by low-viscosity solution are sensitive to membrane viscosity
It is not possible to use light microscopy to detect pore sizes in small (submicron) liposomes. However, having found considerable confirmation that the equations of DAV theory are reliable, we used them to predict pore dynamics in small liposomes (Fig. 6). The relevant value of the modulus S (for increasing membrane area) is drastically different when generating pores in giant liposomes by illumination than when creating pores in small liposomes by standard osmotic swelling. The value of S for increasing the area/lipid by swelling, S = 60 kT/nm2, is much greater than the modulus for suppressing undulations, 0.045 kT/nm2. Using a value of S corresponding to increasing the area/lipid leads to kinetics of pore enlargement for giant liposomes in stage 1 that is orders of magnitude faster than kinetics in experiments, and a clear three-stage process is not predicted by either BGS or DAV (Fig. S1 of the Supporting Material). In contrast, we found that for small liposomes, rather than rapid pore enlargement, a pore immediately contracts upon formation if S is set to 0.045 kT/nm2 (see Small liposomes in the Supporting Material). We therefore assumed S = 60 kT/nm2 for small liposomes, the modulus for increasing the area/lipid molecule.
Figure 6.
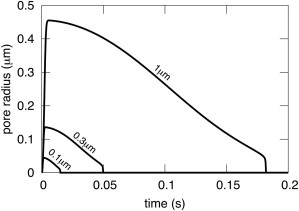
Pore dynamics as a function of liposome radius for small liposomes. The kinetics roughly scale with liposome radius. We assumed that R(0) was 3% larger than R0, corresponding to the maximum increase in area/lipid that can occur when liposomes rupture in pore formation (20). Explicitly, for R0 = 1 μm, we chose R(0) = 1.03 μm; for R0 = 0.3 μm, R(0) = 0.309 μm; for R0 = 0.1 μm, R(0) = 0.103 μm. The parameters used for the small liposomes are S = 60 kT/nm2, γ = 2.5 kT/nm, W = 0 kT/nm2, C = 8.16, ηs = 1 cP, η1 = 1 P, r(0) = 1 nm, and d = 3 nm.
Based on the graphs for small liposomes, r as a function of time scales with R, and r′ scales with 1/R in the limit that the initial liposome radius is zero (Fig. 6). (For giant liposomes, scaling is much more approximate than it is for small liposomes.) As the initial pore radius increases, the scaling relations become less exact. The maximum pore size is ∼45 nm for a liposome of radius 100 nm, demonstrating that a pore can grow to an appreciable fraction of the membrane radius and still close. (The same phenomenon also holds for giant liposomes.) This contrasts with the experimental finding in planar bilayer membranes, where pores can only close if they are small. Once these pores achieve a radius above a relatively small critical value, ∼10 nm, they are irreversibly open and continue to enlarge (17–19). Large pores in liposomes can close because mechanical tension relaxes toward zero as water is expelled from the liposome interior and consequently, edge tension becomes the dominant force, resulting in pore shrinkage and closure. For planar bilayer membranes, mechanical tension is generated and maintained by the surrounding Gibbs-Plateau border that supports the bilayer.
For small liposomes, DAV theory predicts that pore dynamics is sensitive to membrane viscosity if the viscosity of the aqueous solution is comparable to that of water. For the high viscosity of ηs = 32 cP, aqueous friction dominates and pore dynamics are almost independent of ηl. Letting ηl = 0 (Fig. 7, dashed curve; note that the abscissa is not uniform in time, but is presented as a square root of time) barely speeds up pore dynamics as compared to letting ηl = 1 P (Fig. 7, solid curve). For ηs = 1 cP (Fig. 8), however, membrane viscosity has some importance: pores grow to larger radii and do so faster in the absence (Fig. 8, dashed curve, ηl = 0) than in the presence of membrane viscosity (Fig. 8, solid curve, ηl = 1 P). Membrane viscosity becomes more consequential as liposomes become smaller, because the volume of water decreases with the cube of the radius and membrane area decreases less steeply, as the square of the radius. But if the aqueous solution is sufficiently viscous, membrane viscosity is unimportant even for very small liposomes. For liposomes of R = 0.3 μm, ηl has a < 4% effect for ηs > 4 cP. For R = 1 μm, the effect of ηl is also < 4 % for ηs > 8 cP.
Figure 8.
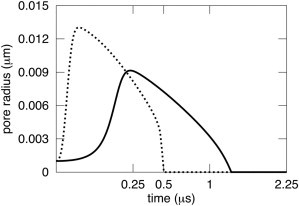
Membrane viscosity affects pore dynamics in small liposomes for small aqueous viscosities. Pore dynamics is shown for the same 300 nm liposome as in Fig. 7, except that ηs = 1 cP; the viscosity of distilled water is assumed. The kinetics are appreciably slowed by the typical lipid viscosity η1= 1 P (solid curve) as compared to the kinetics when lipid viscosity is ignored, η1= 0 P (dashed curve). The abscissa is plotted as the square root of time.
Improvements that can be made to DAV
The assumption that the liposome is always spherical (also made in BGS) cannot be correct. Because a fraction of the internal contents of a liposome is expelled after a pore has formed, the liposome volume decreases. Consequently, the liposomes should assume nonspherical shapes, since membrane area is conserved, and in fact, inspections of published optical projections of liposomes show that they are not always spherical. One could try to account for this by assuming that a spherical liposome evolves into an ellipsoid or into another geometric shape. A more appropriate approach would be to use a variational treatment that calculates, as an output, the evolving liposome geometry over time that minimizes energy. We are using a phase field approach to achieve this aim.
There is also the question of the appropriate constitutive relation of mechanical tension as a function of membrane area. Regarding this issue, DAV theory has adhered to BGS theory and assumed that, for giant liposomes, the tension is given by S(A − A0)/A0, where S is the modulus for elimination or creation of membrane undulations. This relationship has been extensively tested experimentally when tension increases the area/lipid, and it holds up extremely well (14,20). However, experimental justification for this relation in the case of reducing membrane folds is sparse (16). The value of S and the precise constitutive relation predominantly affect the stage of rapid pore enlargement (i.e., stage 1). The maximum pore radius, for example, is relatively insensitive to modulus and constitutive relation since it can be approximated by extrapolating the curve of slow pore closure (i.e., stage 2) to time = 0. The value of S does not affect the rate of pore shrinkage during stage 2, but it does affect the time a pore spends in this stage: increasing the value of S increases the tension promoting pore enlargement, and this lengthens the time before a pore reaches the stage of rapid pore closure (stage 3). In other words, the larger S is, the longer the time a pore spends in stage 2.
We, and previous investigators, have treated pore dynamics by evaluating the balance between surface tension and edge tension. These treatments ignore the fact that the vectors for the forces arising from surface tension are tangential to a liposome's (spherical) surface, whereas the vectors arising from edge tension are directed along the flat plane and toward the center of the circle defined by the pore circumference. The different angles (relative to the plane of this circle) of the two sets of force vectors have been ignored but could be accounted for.
Last, our derivation (and other versions of it) of Eq. 2 assumes that the efflux of the aqueous solution is through a small hole in an infinite plane. However, experimentally, r can become appreciable relative to R. Deriving an equation that would rigorously account for the fluid dynamics for all values of r is mathematically quite complex.
Conclusions
DAV and BGS theory account for the source of friction differently. Although a lipid bilayer is 100-fold more viscous than water, the bilayer is very thin when compared to the thickness of the aqueous volumetric flow. The sliding of the membrane through the aqueous solution, as occurs during changes in pore radius, is consequently a significant source of dissipation. In BGS theory, only internal membrane friction (i.e., membrane viscosity), and not friction of water movement, creates stresses on the pore. We adopted the BGS formalism (10,11) to define the total internal membrane friction as . This quantifies the friction generated by internal membrane sliding. DAV theory has the critical addition of incorporating the friction of the membrane moving in water; this friction is expressed as .
Several important consequences arise from this addition. The friction generated by a membrane sliding through the aqueous solution is at least an order of magnitude larger than the internal membrane friction. In a viscous solution, they can differ by two orders of magnitude. Because aqueous friction has a different form (rr′) than does the internal membrane friction (r′), the overall form of the friction equation in DAV theory (Eq. 1) is different than that of BGS theory (see Eq. 5 of Brochard-Wyart et al. (10)). As a direct consequence, DAV theory predicts a quadratic relationship for the rapid closing stage, whereas BGS theory predicts a linear relationship. Finally, the equations of DAV and BGS describe two opposite extremes of a pore in a large liposome (or in a cell): for DAV, aqueous viscosity limits pore dynamics; in BGS, membrane viscosity limits the pore.
DAV theory yields several physical and mathematical implications
For large liposomes, membrane viscosity is inconsequential for pore dynamics. We therefore predict that the variation of kinetics of enlargement and closure of pores as lipid composition is varied will depend only on the pore edge tension of that lipid composition. Edge tension can be obtained from pore closure during either stage 2 or stage 3.
For small liposomes, membrane viscosity affects pore dynamics if the aqueous viscosity is not too large.
ηs is a linear scaling factor in time, as long as ηm is irrelevant. For example, all curves for pore dynamics of large liposomes can be scaled through ηs to a single curve.
Liposome radius, R, is an approximate numerical scaling factor for pore radius r. At any time, r varies linearly with R, and dr/dt roughly varies linearly with 1/R.
The constant C can be obtained either by curve-fitting experimental data or by calculating from standard fluid mechanical equations. These two strategies yield nearly the same value of C.
DAV theory accounts for the experimental observation that pore dynamics in giant liposomes is controlled by aqueous viscosity; the theory correctly predicts and quantifies the dependence of pore kinetics on experimentally varied parameters.
Acknowledgments
We thank Robert S. Eisenberg for his continual encouragement and for a critical reading of this article.
I.B. was supported by a Fordham University Student Research internship, R.R. was supported by a Fordham First Year Research Grant, and F.S.C. was supported by National Institutes of Health grant GM 066837.
Appendix A
Consider a lipidic pore contracting in solution. When the pore is still large, a large volumetric region of fluid is deformed by pore contraction. When the pore is small, only a small region of fluid is affected by the contraction. To quantify the interaction between membrane and fluid, the fluid velocity immediately surrounding the pore is assumed proportional to the speed of the pore. Since the water far from the pore is static, a shear stress proportional to rate of contraction r′, the solution viscosity ηs, and the characteristic size of the deformation r is generated. The proportionality constant C is determined either by a curve fit or by a theoretical, hydrodynamic model.
How do the friction coefficients compare?
We compare the two sources of friction, membrane and solution. Consider a liposome in a solution with viscosity ηs = 1cP and lipid viscosity ηl = 1P. Assuming the value C = 8.085 (determined from a curve fit to experimental data), we find the ratio of the solvent and membrane friction, Fs/Fm = 13.475r, where r = r μm. For pores 1 μm in radius, the dissipation due to water friction is more than 10 times that of membrane friction. Following experimental studies that stimulated the BGS theory, we let the solution viscosity be 30 times that of distilled water. The source of friction due to the aqueous solution is then at least 390 times greater than that of the membrane throughout most of the life of the pore.
Calculating C from a curve fit
As stated in the body of this article, the rapid falling stage (stage 3) obeys the quadratic relationship −Cηsr2/2γ − 2ηmr/γ + tc = t. One way to determine the coefficient C is by fitting microscopy data from the falling stage with a quadratic function. For example, a least-squares fit to pore radius data obtained from Portet and Dimova (9) yields a value of 0.3418 for the coefficient Cηs/2γ. The value of γ = 14 pN was previously calculated from the linear closing stage (stage 2). A solution with viscosity ηs = 1.133 cP was used in the experiment. Solving, we find the value C = 8.4469.
Deriving the friction for a contracting membrane with a hole
We can evaluate the friction due to the aqueous solution by a scaling argument. First, we find a dilation of space that makes the pore appear stationary. It turns out that this dilation factor is simply r. In the dilated coordinates, the membrane is static and the velocity of the membrane is known. We then look for a steady flow and calculate the friction due to this steady flow. The friction of the moving membrane is then evaluated by scaling back to the original coordinates. The scaling factor for friction is ηsrr′, in part justifying the form Fs = Cηsrr′. The friction coefficient C is then found by solving the boundary value problem for the steady, axial flow around a diaphragm with a hole.
It is well known that the shear stress on a surface in a viscous, Newtonian fluid is
where u is the velocity, (Du +DTu) the strain tensor, p the pressure, and n the unit normal of the surface (see for example (21); chapter 5, eqn 13). Here u and p are the solution to the Navier-Stokes equation with a no-slip, moving boundary condition given by the velocity of the diaphragm. To calculate the radial friction Fs, we dot the equation for stress with the radial vector field x/|x| and integrate over the diaphragm:
The factor of 2 appears because the water on both sides of the membrane is sheared. Making the change of variables x = ry, the area element dA scales by r2 and the gradient scales by r-1. This gives
There is no closed form expression to evaluate this integral. Instead, we look for a solution of the form u(ry,t) = u0(y,t)r′(t) where the speed of the pore r′ gives the characteristic velocity and u0 is the steady flow field. Making this substitution, the previous equation becomes
Here C is a property of the characteristic flow, the meaning of which will be made clear below. The point is that it is a constant independent of physical parameters. The value of C can be determined by solving for u0 and integrating the shear stress over the diaphragm.
Calculating C numerically
To determine the boundary condition for the velocity, we assume the membrane area is locally conserved and the membrane remains in the horizontal plane. This implies u(x,t) = r(t)r′(t)/|x| and v(x,t) = 0 where u and v are the radial and axial components of the velocity field respectively.
Assume the velocity of the surrounding water reaches a quasi-steady state. In other words, if the coordinate system is dilated so that the diaphragm appears static, the flow appears steady. This motivates the expansion
We now derive a boundary value problem for the lowest order terms u0 and p0 by expanding and matching the coefficients in powers of r. On the diaphragm,
Matching coefficients, we read off the boundary conditions 1/|y| = u0(y), 0 = v0(y). The velocity and pressure pair (u, p) are a solution to the Navier-Stokes equations:
Applying the expansion to these equations yields a system of equations
These equations are discretized on a rectangular grid using the finite difference method. The linear system of equations resulting from the discretization are solved and an approximation of the steady flow field u0 is found. The constant C = 8.085 was evaluated by applying a numerical quadrature to the integral expressions for the lateral friction Fs.
Supporting Material
References
- 1.Koslov M.M., Markin V.S. A theory of osmotic lysis of lipid vesicles. J. Theor. Biol. 1984;109:17–39. doi: 10.1016/s0022-5193(84)80108-3. [DOI] [PubMed] [Google Scholar]
- 2.Riske K.A., Dimova R. Electro-deformation and poration of giant vesicles viewed with high temporal resolution. Biophys. J. 2005;88:1143–1155. doi: 10.1529/biophysj.104.050310. [DOI] [PMC free article] [PubMed] [Google Scholar]
- 3.Weaver J.C. Electroporation theory. Concepts and mechanisms. Methods Mol. Biol. 1995;55:3–28. doi: 10.1385/0-89603-328-7:3. [DOI] [PubMed] [Google Scholar]
- 4.Zhelev D.V., Needham D. Tension-stabilized pores in giant vesicles: determination of pore size and pore line tension. Biochim. Biophys. Acta. 1993;1147:89–104. doi: 10.1016/0005-2736(93)90319-u. [DOI] [PubMed] [Google Scholar]
- 5.Sandre O., Moreaux L., Brochard-Wyart F. Dynamics of transient pores in stretched vesicles. Proc. Natl. Acad. Sci. USA. 1999;96:10591–10596. doi: 10.1073/pnas.96.19.10591. [DOI] [PMC free article] [PubMed] [Google Scholar]
- 6.Dobereiner H.G., Evans E., Wortis M. Mapping vesicle shapes into the phase diagram: A comparison of experiment and theory. Phys. Rev. E. 1997;55:4458–4474. [Google Scholar]
- 7.Hirn R., Bayerl T.M., Sackmann E. Collective membrane motions of high and low amplitude, studied by dynamic light scattering and micro-interferometry. JCS Faraday Trans. II. 1998;111:17–30. doi: 10.1039/a807883a. discussion 69–78. [DOI] [PubMed] [Google Scholar]
- 8.Karatekin E., Sandre O., Brochard-Wyart F. Cascades of transient pores in giant vesicles: line tension and transport. Biophys. J. 2003;84:1734–1749. doi: 10.1016/S0006-3495(03)74981-9. [DOI] [PMC free article] [PubMed] [Google Scholar]
- 9.Portet T., Dimova R. A new method for measuring edge tensions and stability of lipid bilayers: effect of membrane composition. Biophys. J. 2010;99:3264–3273. doi: 10.1016/j.bpj.2010.09.032. [DOI] [PMC free article] [PubMed] [Google Scholar]
- 10.Brochard-Wyart F., de Gennes P.G., Sandre O. Transient pore is stretched vesicles: role of leak-out. Physica A. 2000;278:32–51. [Google Scholar]
- 11.Debrégeas G., Martin P., Brochard-Wyart F. Viscous bursting of suspended films. Phys. Rev. Lett. 1995;75:3886–3889. doi: 10.1103/PhysRevLett.75.3886. [DOI] [PubMed] [Google Scholar]
- 12.Rodriguez N., Cribier S., Pincet F. Transition from long- to short-lived transient pores in giant vesicles in an aqueous medium. Phys. Rev. E. 2006;74:061902. doi: 10.1103/PhysRevE.74.061902. [DOI] [PubMed] [Google Scholar]
- 13.Sruvudtam N.M. Determination of the line tension of giant vesicles from pore-closing dynamics. J. Phys. Chem. B. 2008;112:7147–7152. doi: 10.1021/jp7119203. [DOI] [PubMed] [Google Scholar]
- 14.Kwok R., Evans E. Thermoelasticity of large lecithin bilayer vesicles. Biophys. J. 1981;35:637–652. doi: 10.1016/S0006-3495(81)84817-5. [DOI] [PMC free article] [PubMed] [Google Scholar]
- 15.Happel J., Brenner H. Prentice-Hall; Englewood Cliffs, NJ: 1965. Low Reynolds Number Hydrodynamics: With Special Applications to Particulate Media. [Google Scholar]
- 16.Brochard F., de Gennes P.G., Pfeuty P. Surface tension and deformations of membrane structures: relation to two-dimensional phase transitions. J. Phys. (France) 1976;37:1099–1103. [Google Scholar]
- 17.Abidor I.G., Arakelyan V.B., Tarasevich M.R. Electrical breakdown of BLM: Main experimental facts and their qualitative discussion. Bioelectrochem. Bioenerg. 1979;104:37–52. [Google Scholar]
- 18.Genco I., Gliozzi A., Scalas E. Electroporation in symmetric and asymmetric membranes. Biochim. Biophys. Acta. 1993;1149:10–18. doi: 10.1016/0005-2736(93)90019-v. [DOI] [PubMed] [Google Scholar]
- 19.Wilhelm C., Winterhalter M., Benz R. Kinetics of pore size during irreversible electrical breakdown of lipid bilayer membranes. Biophys. J. 1993;64:121–128. doi: 10.1016/S0006-3495(93)81346-8. [DOI] [PMC free article] [PubMed] [Google Scholar]
- 20.Evans E., Needham D. Physical properties of surfactant bilayer membranes: thermal transitions, elasticity, rigidity, cohesion, and colloidal interactions. J. Phys. Chem. 1987;91:4219–4228. [Google Scholar]
- 21.Gurtin M. Academic Press; New York: 2003. An Introduction to Continuum Mechanics. [Google Scholar]
Associated Data
This section collects any data citations, data availability statements, or supplementary materials included in this article.