

Abstract
The minichromosome maintenance (MCM) proteins are thought to function as the replicative helicases in archaea and eukarya. In this work we determined the solution structure of the N-terminal portion of the MCM complex from the archaeon Methanothermobacter thermautotrophicus (N-mtMCM) in the presence and absence of DNA using small-angle neutron scattering (SANS). N-mtMCM is a multimeric protein complex that consists of 12 monomers, each of which contains three distinct domains and two unstructured regions. Using an all-atom approach incorporating modern force field and Monte Carlo methods to allow the unstructured regions of each monomer to be varied independently, we generated an ensemble of biologically relevant structures for the complex. An examination of the subsets of structures that were most consistent with the SANS data revealed that large movements between the three domains of N-mtMCM can occur in solution. Furthermore, changes in the SANS curves upon DNA binding could be correlated to the motion of a particular N-mtMCM domain. These results provide structural support to the previously reported biochemical observations that large domain motions are required for the activation of the MCM helicase in archaea and eukarya. The methods developed here for N-mtMCM solution structure modeling should be suitable for other large protein complexes with unstructured flexible regions.
Introduction
The minichromosome maintenance (MCM) complex is thought to function as the replicative helicase in archaea and eukarya. Whereas in eukarya MCM is a family of six related polypeptides (Mcm2–7), most archaeal species studied contain a single MCM homolog. However, these two types of MCM complexes have similar biochemical properties (1–3). The archaeal MCM protein consists of an N-terminal part, a catalytic region, and a helix-turn-helix (HTH) motif (Fig. 1 a). Low-resolution crystal structures have been determined for the entire MCM protein from Sulfolobus solfataricus (4) and Methanopyrus kandleri (5), and high-resolution crystal structures have been determined for the N-terminal part of MCM from Methanothermobacter thermautotrophicus (N-mtMCM) (6) and S. solfataricus (N-ssMCM) (7). The high-resolution studies revealed hexameric N-ssMCM and dodecameric N-mtMCM structures in which each monomer folds into three distinct domains: A, B, and C. Fig. 1 a illustrates the two major parts of mtMCM. The N-terminal part (N-mtMCM) includes domain A, shown in yellow, and domains B and C (B/C), shown in blue, whereas the C-terminal part (C-mtMCM) contains the catalytic region (AAA+) and the HTH motif, both shown in white. An unstructured loop region is present in N-mtMCM between domain A and domain B/C, and is shown in green. A second unstructured region between N-mtMCM and C-mtMCM is shown in purple. Given that MCM contains unstructured regions that are likely disordered and flexible, it falls into the category of intrinsically disordered proteins (IDPs). The function of many IDPs is dependent on the flexibility afforded to these unstructured regions (8,9).
Figure 1.
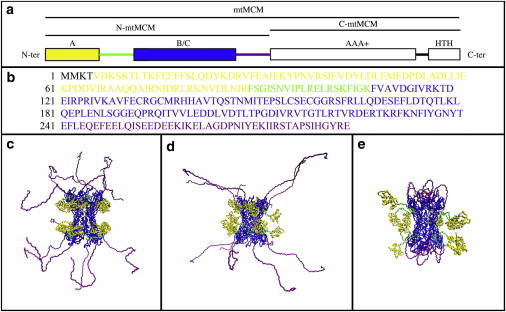
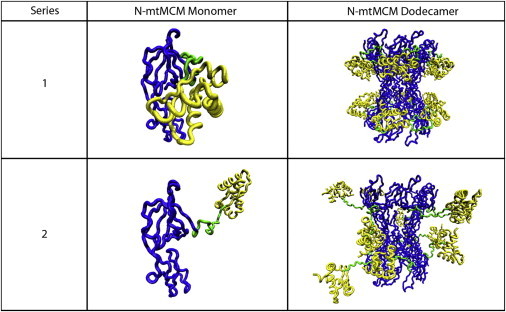
N-mtMCM structures. (a) Linear structure for full-length mtMCM, showing the N-terminal (N-mtMCM) and C-terminal parts (C-mtMCM). N-mtMCM shows domain A in yellow and domains B and C (B/C) in blue, whereas C-mtMCM includes the catalytic region (AAA+) and the HTH motif, both shown in white. An unstructured loop region is present in N-mtMCM between domain A and domain B/C, and is shown in green. A second unstructured region between N-mtMCM and C-mtMCM is shown in purple. (b) N-mtMCM sequence with domains A and B/C and the two unstructured regions shown in the same colors as in panel a. (c) Example of a series 1 N-mtMCM model structure. Unstructured residues 244–286 (purple) are defined as flexible for the SASSIE analysis. Unstructured residues 89–108 (green) are positioned as in the crystal structure (1LTL). (d) Example of a series 2 N-mtMCM model structure. Unstructured residues 89–108 (green) and 244–286 (purple) are defined as flexible. In addition, the region containing residues 244–286 (purple) is defined as stretched out (away from the central hole) in the starting structure for SASSIE analysis. (e) Example of a series 3 N-mtMCM model structure. Unstructured residues 89–108 (green) and 244–286 (purple) are defined as flexible. However, the region containing residues 244–286 (purple) is defined as folded inward (near the central hole) in the starting structure for SASSIE analysis.
The sequence of N-mtMCM is shown in Fig. 1 b, with domains A and B/C and the unstructured regions shown in the same colors as in Fig. 1 a. Domain A is suggested to play a role in regulating helicase activity, domain B participates in DNA binding, and domain C is involved in protein multimerization, DNA binding, and communicating with the catalytic domain (3). Electron microscopy (EM) reconstruction studies of the full-length mtMCM showed different forms, including hexamers, heptamers, dodecamers, open rings, and filamentous structures (1–3). EM studies of the N-mtMCM revealed a hexameric structure (10) that differs from the dodecameric structures suggested by the x-ray crystal structure (6) and biochemical characterization of the protein in solution (11). In addition, the x-ray crystallographic and EM measurements showed differences in the structures of the hexameric/dodecameric rings. To fit the crystal structure of the N-mtMCM into the EM reconstruction, domain A has to be rotated outward (10), suggesting that the MCM complex is not as compact as suggested by the crystal structure.
Neither EM nor crystal structure determination reveals the structure of a protein in solution, where it is at full hydration under conditions closer to its natural state. Thus, to gain complementary structural information about the archaeal MCM, we determined the solution structures of the N-mtMCM protein in the presence and absence of DNA using small-angle neutron scattering (SANS). Small-angle scattering is becoming increasingly useful for the structural determination of both large protein complexes and flexible proteins in solution, owing mainly to recent developments in structure modeling, as described in a recent review (12). Although many options are available for modeling multimeric protein complexes using a combination of rigid-body and atomistic approaches (12), methods for modeling IDPs have mainly employed monomeric proteins that contain domains separated by unstructured flexible linker regions (13,14). N-mtMCM, a complex of 12 monomers with such domains, presents another level of complexity that has been addressed by the recently-developed SASSIE software (15,16), which can generate energetically relevant ensembles of all-atom structures while treating each flexible region of each monomer independently.
Using this method, we show that the N-mtMCM protein forms dodecamers, consistent with the crystal structure, and that a conformational change in a specific region of the N-mtMCM helicase, namely, the unstructured loop region between domains A and B/C, is consistent with changes seen in the SANS data as a function of DNA binding. This result provides direct structural support for biochemical studies suggesting that large conformational changes involving domain A are needed to activate the MCM helicase.
Materials and Methods
Protein expression, purification, and sample preparation for SANS analysis
The N-terminal part (residues 1–286) of M. thermautotrophicus MCM (N-mtMCM) was overexpressed in Echerichia coli BL21(DE3) pLysS cells (Novagen Biosciences, San Diego, CA) for 16 h in autoinduction medium consisting of 1% (w/v) tryptone, 0.5% (w/v) yeast extract, 0.33% (w/v) (NH4)2SO4, 0.68% (w/v) KH2PO4, 0.71% (w/v) Na2HPO4, 0.05% (w/v) glucose, 0.2% (w/v) α-lactose, and 0.015% (w/v) MgSO4. (Certain commercial equipment, instruments, or materials are identified in this work to foster understanding. Such identification does not imply a recommendation or endorsement by the National Institute of Standards and Technology (NIST), nor does it imply that the materials or equipment identified are necessarily the best available for the purpose.) The proteins were purified on an Ni-NTA column (GE Healthcare, Piscataway, NJ) as previously described (10). The purified proteins were dialyzed twice (10 mL into 1 L) against SANS buffer consisting of 20 mM Tris-HCl (pH 7.4), 100 mM NaCl, 0.5 mM EDTA, 2 mM DTT, and 5% (v/v) glycerol. Buffers for N-mtMCM/DNA complex also contained 2 mM MgCl2. The SANS buffer was made with D2O instead of H2O. Because the glycerol did not contain D, the buffer contained ≈95% (v/v) D2O and 5% (v/v) H2O (95% D2O buffer). The proteins were stored at 4°C and used within 24 h after dialysis. The N-mtMCM protein concentration was found to be 1.77 mg/mL by Bradford assay (Bio-Rad, Hercules, CA) with bovine serum albumin as the standard. Before SANS measurements were obtained, the sample was clarified by centrifugation to remove possible aggregates. For samples containing N-mtMCM/DNA complex, either ϕX174 RF2 circular double-stranded DNA (dsDNA; 5386 bp) in D2O was added to a final concentration of 0.12 mg/mL, or DF50 single-stranded DNA (ssDNA; 50 nt, 5′-GGGACGCGTCGGCCT GGCACGTCGGCCGCTGCGGCCAGGCACCCGATGGC-3′) in D2O was added to a final concentration of 0.08 mg/mL. These concentrations represent a significant excess in DNA over protein, making it likely that at least one DNA molecule will be bound to each N-mtMCM molecule in solution. A 95% D2O buffer sample containing DF50 ssDNA at ∼0.1 mg/mL was also prepared to confirm that free DNA in solution did not contribute significantly to the scattering, even when none of the DNA was bound to MCM in solution.
Three samples were prepared for SANS measurements: 1), N-mtMCM without Mg2+ or DNA (–Mg–DNA); 2), N-mtMCM with Mg2+ and ϕX174 RF2 dsDNA (+Mg+dsDNA); and 3), N-mtMCM with Mg2+ and DF50 ssDNA (+Mg+50ssDNA).
SANS measurements
SANS measurements were performed on the 30-m SANS instruments (17) at the NIST Center for Neutron Research in Gaithersburg, Maryland. The neutron wavelength, λ, was 5 Å, with a wavelength spread, Δλ/λ, of 0.15. Scattered neutrons were detected with a 64 cm × 64 cm two-dimensional, position-sensitive detector with 128 × 128 pixels at a resolution of 0.5 cm/pixel. We reduced the data using the IGOR program with SANS macro routines developed at the NIST Center for Neutron Research (18). Raw counts were corrected for empty cell counts, ambient room background counts, and nonuniform detector response. Data were placed on an absolute scale relative to the known incident beam flux. Finally, the data were radially averaged to produce scattered intensity, I(q), versus q curves, where q = 4πsin(θ)/λ and 2θ is the scattering angle. Sample-to-detector distances of 10.0 m and 2.0 m were used to cover the range of 0.007 Å−1 ≤ q ≤ 0.2 Å−1. The scattered intensities from the samples were then further corrected for buffer scattering and incoherent scattering from hydrogen in the samples. We performed the initial data analysis using the Guinier approximation, , on the low-q portions of the data to obtain initial values for the radius of gyration, Rg, and the forward scattering intensity, I(0), of the samples. This analysis is valid only in the region where qRg∼1.
Structure modeling
The structure for the N-mtMCM dodecamer molecule was built from the x-ray crystal structure coordinates of the monomer (PDB accession number 1LTL) (6), which contains residues 5–243 of the N-mtMCM sequence (Fig. 1 b). We added an unstructured region consisting of residues 244–286 to the C-terminus of this model structure using the program CHARMM (19), and constructed a full dodecamer model structure from 1LTL using the program COOT (20). SASSIE was used to generate ensembles of structures for comparison with SANS data. We generated a variety of structures by randomly varying backbone dihedral angles within chosen regions of the protein. After each randomly chosen angle was rotated by a given value, we checked the final value to determine whether it was energetically probable, based on an energy function using the Charmm-22 all-atom protein force-field parameters (21). The new configuration was checked for overlap of basis atoms, usually chosen to be α-carbon atoms. The overlap distance was taken to be 3 Å (technical details regarding this overlap value are included in the Supporting Material). If both checks were met, the new structure was accepted and Rg was calculated. All structures were energy-minimized by means of the program NAMD (22).
We generated three series of dodecamer model structures in this manner using SASSIE. In series 1, the residues added to the C-terminus of each monomer (residues 244–286) were treated as unstructured flexible regions in which the dihedral angles were variable as described above. These regions were facing upward, away from the center of the molecule, in the starting structure. An example of a series 1 structure is shown in Fig. 1 c. The domains and unstructured regions are colored as in Fig. 1, a and b, with residues 244–286 shown in purple. Series 2 structures define this same region to be flexible, as well as a second region in each monomer defined by residues 89–108, which corresponds to the unstructured loop between domains A and B/C. Fig. 1 d shows an example of a series 2 structure, with residues 89–108 shown in green. The same two regions were treated as flexible in series 3 structures, except that the regions containing residues 244–286 were initially defined to be folded inward, toward the center of the molecule. An example of a series 3 structure is shown in Fig. 1 e, with residues 244–286 shown in purple. We treated this series of structures separately because it would be difficult to obtain such a configuration from a series 1 or series 2 starting structure by relying only on the uncorrelated random movements of the dihedral angles in residues 244–286 for each monomer, especially given that structures with overlap are not accepted. Thus, to avoid biasing against structures like those in series 3, it was treated as a separate starting structure.
The accepted structures for each series were compared with the experimental data for each sample. We calculated the SANS profiles from each accepted structure using the program Xtal2Sas (23,24). We then compared the calculated data (model SANS curves) with the experimental data and scored them for quality using the χ2 equation, , where Iexp(q) is the experimentally determined SANS intensity curve, Icalc(q) is the calculated intensity curve from the model structure and σexp(q) is the q-dependent variance. The sum was taken over N = 60 data points.
An examination of a plot of χ2 versus Rg provides an idea of how well the individual structures in each series fit the data, as well as which series of structures produces the overall best fits to the data. The best-fit (lowest χ2) and worst-fit (highest χ2) model SANS curves are noted for each series, along with the average model SANS curve from the entire ensemble of accepted structures for that same series. These curves were plotted along with the experimental SANS data to aid in visualization of the quality of the fits to the data. Isodensity surfaces representing the total configuration space examined by all of the accepted structures were generated for each series of structures and compared with that representing the best-fit family of structures for that same series. The best-fit family of structures was chosen based on the lowest ≈20% of the χ2-values for each series.
Results
SANS data
The SANS data obtained for the three different N-mtMCM samples are shown on a log(I) versus log(q) scale in Fig. 2. Although the exact MCM:DNA stoichiometry in the samples is not known, the mass fraction of the DNA component of the MCM/DNA complexes is certainly at least an order of magnitude lower than that of MCM, given the concentrations of MCM and DNA that were used to make the sample. Although many N-mtMCM molecules will bind to a single ϕX174 dsDNA, and either one or two 50-mer DNA molecules will bind to a single N-mtMCM molecule, it is reasonable to approximate the mass fraction of DNA as 0.1 and the mass fraction of MCM as 0.9 in the MCM/DNA complex. Furthermore, the contrast of DNA in 95% D2O is lower than that of MCM. Thus, the scattering from the bound DNA component does not contribute significantly to the scattering from the MCM/DNA complex, and any differences seen in the data upon DNA binding can be attributed to structural changes in the MCM. To test whether free DNA in solution would contribute to the scattering, a sample containing DF50 ssDNA in 95% D2O buffer at ∼0.1 mg/mL was also measured, and no scattering was observed.
Figure 2.
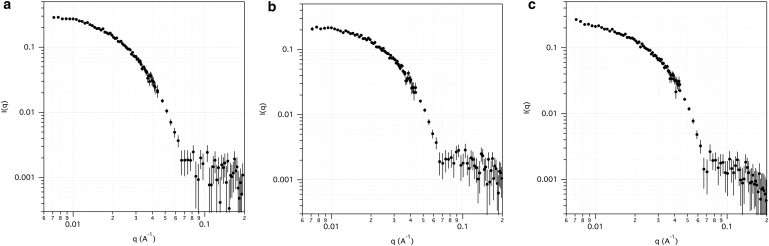
N-mtMCM SANS data. Measured SANS log(I) versus log(q) curves from (a) (–Mg–DNA), (b) (+Mg+50ssDNA), and (c) (+Mg+dsDNA). Error bars represent plus and minus the combined standard uncertainty of the data collection.
Guinier fits to the (–Mg–DNA) data resulted in an Rg-value of 78 Å ± 1 Å. The Rg-values of 69 Å ± 1 Å and 70 Å ± 1 Å for the (+Mg+50ssDNA) and (+Mg+dsDNA) samples, respectively, indicate that there is a significant (8–9 Å) decrease in the size of the N-mtMCM molecule when dsDNA or 50-mer ssDNA is bound. Because the SANS intensities are on an absolute scale, the I(0) values are related to the mass average molecular mass of the molecule. However, the predicted I(0) value of the (–Mg–DNA) sample at 1.77 mg/mL, assuming a mass average molecular mass of 380 kDA (6), is 0.6 cm−1, compared with the value of 0.30 cm−1 ± 0.02 cm−1 obtained from the Guinier analysis, suggesting a concentration of 0.89 mg/mL ± 0.05 mg/mL. It is likely that the concentration of the measured sample was indeed closer to this value, due to the loss of some sample as a result of the formation of filaments (10,25), which were subsequently removed during the centrifugation step before SANS measurements were obtained. It is difficult to calculate the predicted I(0) values of the (+Mg+50ssDNA) and (+Mg+dsDNA) samples because the MCM:DNA stoichiometry is not known. Because I(0) is not a reliable means of gauging the integrity of the samples, this was corroborated by direct comparison of the experimental data with model SANS curves from single N-mtMCM dodecamer structures.
An examination of the higher-q portion of the data sets in Fig. 2 shows a shoulder in the data beyond q = 0.07 Å−1 for the (–Mg–DNA) sample (Fig. 2 a), and a broad secondary peak in the (+Mg+50ssDNA) sample curve (Fig. 2 b) in the same region. The presence of a peak in this region can be an indication that there is more intramolecular order in the dodecamer. We address this concept further below, and directly compare model structures with different degrees of intramolecular order with the data using a goodness-of-fit criterion. The (+Mg+dsDNA) sample curve (Fig. 2 c) has a shoulder that slopes downward as compared with the same region of the (–Mg–DNA) sample curve. Such differences in the higher-q region of these SANS curves generally indicate structural changes within the molecule.
Details of the N-mtMCM structures
We generated 20,142 accepted (nonoverlapping) structures for series 1 (Fig. 1 c), 7050 for series 2 (Fig. 1 d), and 2083 for series 3 (Fig. 1 e). The number of accepted structures depended on the probability of overlap. Thus, when more regions were allowed to be flexible (series 2) and/or the flexible regions at the C-terminus were in close proximity to each other by design (series 3), fewer of the energetically probable randomly generated structures satisfied the 3 Å overlap distance requirement. The acceptance rate was ≈80% for series 1, ≈37% for series 2, and ≈8% for series 3.
The model SANS curves from the accepted structures for all three series were compared with the data sets shown in Fig. 2, and the resultant χ2 versus Rg plots are shown in Fig. 3. The first column of Fig. 3 shows the plots for the (–Mg–DNA) data. In this case, the lowest overall χ2-values occur when the data are compared with the series 2 structures (middle row), where the best χ2-values are <2. The lowest χ2-values are >4 when the (–Mg–DNA) data are compared with the series 1 and 3 structures. The lowest overall χ2-values are <2 for the (+Mg+50ssDNA) and (+Mg+dsDNA) data compared with all three series of structures. From these χ2 versus Rg plots alone, it appears that the series 2 structures result in the best χ2-values for the (–Mg–DNA) samples, whereas that distinction cannot be made for the other two samples. Focusing on the bottom row of Fig. 3, one can see that the series 3 structures have Rg-values that are significantly lower than those found from Guinier fits to the SANS data for all three samples. This is because the conformational space of the C-terminal residues is severely restricted due to the high probability of overlap, and suggests that the model SANS curves from the series 3 structures do not match the low-q portion of the SANS data.
Figure 3.
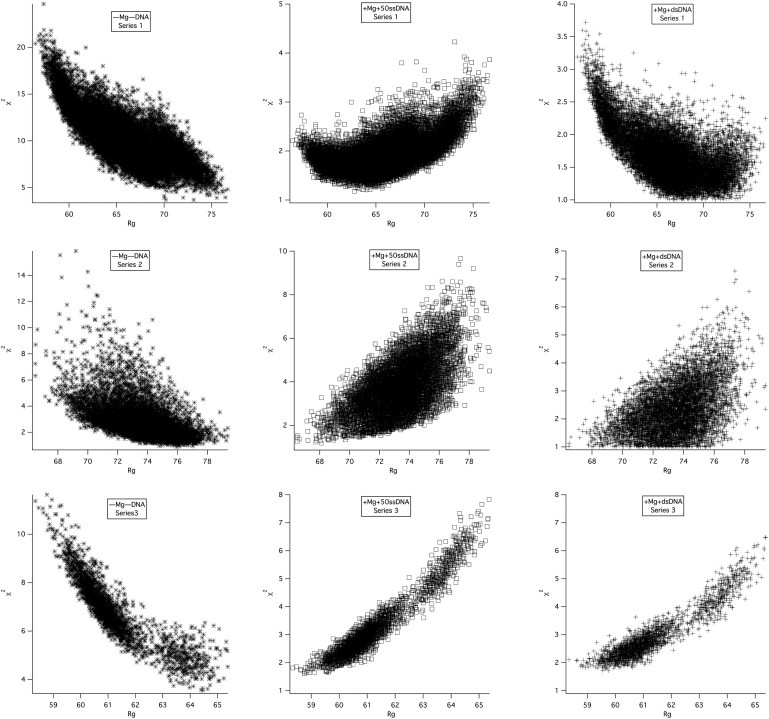
χ2 versus Rg plots for model SANS curves to SANS data. The top row shows the plots for series 1 model SANS curves compared with measured SANS data from (–Mg–DNA) (left), (+Mg+50ssDNA) (middle), and (+Mg+dsDNA) (right). Series 2 and 3 structures are compared with the same data in the middle and bottom rows, respectively.
The model SANS curves corresponding to the best fit (solid line) and worst fit (dashed line) to the experimental data are shown for all three series in Fig. 4, along with the model SANS curve representing the average of all of the accepted structures (dotted line) in each case. Again focusing on the bottom row, one can see that even the best-fit series 3 model SANS curves do not agree well with the SANS data for all three samples at low q-values, as expected. It should also be noted that the ensemble average of all the accepted series 3 structures is also not a good fit to the SANS data. Thus, even if N-mtMCM exists in multiple conformations in solution, it cannot easily be modeled by this generated ensemble of energetically relevant series 3 structures. Given the restricted configuration space of the C-terminal residues, it is unlikely that a larger ensemble of series 3 structures would fit the data better. Thus, based on the information presented in Figs. 3 and 4, structures of the series 3 type were ruled out as good models for the (–Mg–DNA), (+Mg+50ssDNA), and (+Mg+dsDNA) samples in solution.
Figure 4.
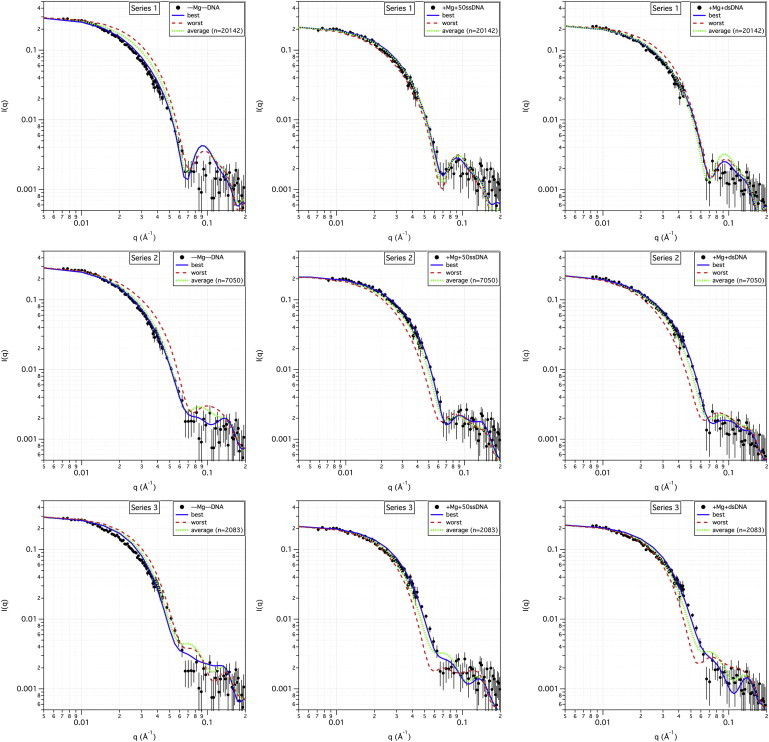
Best- and worst-fit model SANS curves to SANS data. The top row shows the plots of the measured SANS data for the (–Mg–DNA) (left), (+Mg+50ssDNA) (middle), and (+Mg+dsDNA) (right) samples, along with the best-fitting (lowest χ2) and worst-fitting (highest χ2) model SANS curves from the ensemble of series 1 structures, as well as the average model SANS curve from the entire ensemble of series 1 structures. The number of structures that were used to calculate the average curve is shown in parentheses. Similar model SANS curves for the series 2 and 3 structures are shown along with the measured SANS data in the middle and bottom rows, respectively. Error bars on the measured SANS data represent plus and minus the combined standard uncertainty of the data collection.
On the other hand, the best-fit model structure is a much better representation of the experimental data for the series 1 and 2 structures, especially at q-values below q = 0.07 Å−1, as illustrated in rows 1 and 2 of Fig. 4. Furthermore, the ensemble average of both series of structures is often a reasonable fit to the data as well. This is also demonstrated by the relatively flat χ2 versus Rg plots in Fig. 3 that show equally good fits for model SANS curves over a range of Rg-values.
It is important to note that the best-fit structure found for each sample is not unique, and there is a family of structures that fit the data equally well in each case. To illustrate this further, three of the best-fit series 1 and 2 model structure curves are plotted for each sample in Fig. S1 in the Supporting Material. Recall that the best-fit family of structures was chosen based on the lowest ≈20% of the χ2-values for each series. The χ2-values range between 0.73 and 1.5, except for the (–Mg–DNA) sample compared with the series 1 structures, where the values are between 3.6 and 3.9.
It can be seen from Fig. 4 and Fig. S1 that the model SANS curves from the series 1 structures fit the (–Mg–DNA) data the worst, especially at the higher q-values, i.e., q > 0.07 Å−1. Just the opposite is true for series 2 structures, which fit the (–Mg–DNA) data much better in the same q range. This supports the conclusion drawn from the χ2 versus Rg plots that series 2 structures are the best representation of the (–Mg–DNA) sample. Recall that the difference between the series 1 and 2 structures is that the series 2 structures contain a second flexible region in each monomer of the N-mtMCM dodecamer, i.e., the unstructured loop between domains A and B/C defined by residues 89–108 (the green region in Fig. 1). This allows the N-terminal residues 5–88 (yellow region in Fig. 1 corresponding to domain A) in each monomer to take on a wide range of conformations independently of the same region in the other monomers. In the absence of DNA, the structures that best fit the SANS data are among those that allow this flexibility.
On the other hand, equally good fits can be found for both series 1 and series 2 structures when DNA is bound. Thus, flexibility of residues 89–108 is not a necessary condition to obtain structures that fit the (+Mg+50ssDNA) and (+Mg+dsDNA) samples. The secondary peak beyond q = 0.07 Å−1 in the model SANS curves for series 1 structures results from the fact that the N-terminal residues that comprise domain A are locked in the orientation found in the x-ray crystal structure, resulting in a more symmetric molecule. Fig. 4 and Fig. S1 (top row) show that the SANS data fit the series 1 model structures in this higher-q region only when DNA is bound.
A comparison of the best-fit model SANS curves of the series 1 and 2 structures with the SANS data suggests that the (–Mg–DNA) sample must have flexible C-terminal and N-terminal regions, as modeled in series 2, to fit the SANS data. Representative best-fit series 1 and 2 model structures for the (–Mg–DNA) sample are shown in Fig. 5 without the C-terminal unstructured region (residues 244–286) to illustrate the differences in position of domain A between the two series of structures. The figure illustrates the difference in position of domain A (yellow), along with the flexible loop between domains A and B/C (green) for one monomer (left column) as well as the full dodecamer structure (right column). Recall that the position of domain A in each monomer matches that of the crystal structure for series 1 structures (top row), but is variable in series 2 structures (bottom row).
Figure 5.
Flexibility of the linker between domains A and B/C. The top row shows a best-fit series 1 model structure for the (–Mg–DNA) sample without the C-terminal unstructured region (residues 244–286) for a single monomer (left) and the full dodecamer (right). Domain A, shown in yellow, was fixed in the position determined from the crystal structure. The bottom row shows a best-fit series 2 model structure for the (–Mg–DNA) sample without the C-terminal unstructured region for a single monomer (left) and the full dodecamer (right). The unstructured loop region between domains A and B/C, shown in green, was allowed to be flexible in the series 2 structures, resulting in a large range of possible positions for domain A.
For the (+Mg+50ssDNA) and (+Mg+dsDNA) samples with DNA bound, equally good fits to the data can be obtained from both series 1 and series 2 structures. This is further illustrated in Fig. S2, which shows isodensity surface plots illustrating the conformation space occupied by the ensemble of best-fit series 1 (Fig. S2 a) and series 2 (Fig. S2 b) structures for each sample, along with that of the ensemble of all accepted structures for comparison. In both cases, the first row shows the density plots for the full molecule, and the second row shows the same plots for the molecule without the C-terminal unstructured region (residues 244–286). In particular, Fig. S2 a shows that the population of (–Mg–DNA) series 1 structures representing the lowest ≈20% of the χ2-values is significantly smaller than that of (+Mg+50ssDNA) and (+Mg+dsDNA). The lowest χ2-values are significantly higher as well. Although some of the populations of the best-fit series 2 structures shown in Fig. S2 b are also small, it can be seen from the second row that there is no preferential location for the N-terminal unstructured residues and thus domain A (shown in yellow). The fact that equally good fits of the DNA-bound samples can be obtained whether the N-terminal unstructured residues are flexible or not is significant because this means that the DNA-bound samples can have a more symmetric structure, whereas the unbound sample cannot.
Discussion
The data presented here demonstrate that SANS analysis combined with energetically relevant all-atom ensemble structure modeling is a powerful tool that allows the assessment of the degree of flexibility of large protein complexes in solution, even in cases where an ensemble of structures is likely present. For this N-mtMCM study in particular, the movement of a particular region of each N-mtMCM monomer (domain A, shown in yellow in Fig. 1) was found to be related to changes in the SANS curves upon DNA binding. We were able to unequivocally reach this conclusion even though there was an additional unstructured, flexible region in each monomer (C-terminal residues 244–286, shown in purple in Fig. 1).
Furthermore, this SANS study of N-mtMCM in solution provides structural support for biochemical and EM structural studies with the full-length mtMCM molecule suggesting that DNA binding causes conformational changes in the mtMCM protein (26–29). The SANS-derived structures of N-mtMCM in the absence of DNA revealed that the loop residues connecting domains A and B/C (green region in Fig. 1) must be flexible, allowing for the observed movement of domain A (Fig. 5) with respect to B/C. This is in contrast to the more rigid, symmetric structure suggested by the x-ray crystal structure (6). This flexibility is consistent, however, with the EM and biochemical studies of the archaeal and eukaryal MCM proteins. The crystal structure of N-mtMCM (6) cannot fit into the EM structure (10) unless domain A is rotated outward in a manner similar to that found for the model structures that best fit the SANS data. EM studies on a mutant mtMCM protein also suggested that domain A can swing outward in comparison with its location in the crystal structure (26).
In addition to the structural studies described above, biochemical studies with the eukaryal MCM proteins also suggested that the loop that connects domain A to the rest of the MCM molecule is flexible, and a large movement of domain A is required to activate the helicase. These observations come from the study of an MCM mutant protein identified in the yeast Saccharomyces cerevisiae. In the mutant protein, known as Mcm5-Bob1, a Pro residue in domain A is substituted by Leu at amino acid 82, which is a part of domain A (30,31). In yeast, the activity of the Dbf4-dependent Cdc7 kinase (DDK) is essential for initiation of DNA replication. It was found that the Mcm5-Bob1 mutation bypasses the requirement for the MCM phosphorylation by the DDK. Structural studies with the corresponding mutation (P62L) in domain A of the N-mtMCM protein (6) demonstrated that domain A is pushed outward when Leu replaces the Pro residue in the mutant protein. Biochemical studies with the mtMCM P62L mutant protein, the yeast Mcm5-Bob1, and other Mcm5 mutant proteins showed that the swinging of domain A from domain B/C, and consequently the rest of the MCM molecule in the eukaryotic Mcm5 protein, is required for helicase activity (6,32,33). In vivo, the phosphorylation by DDK of the eukaryotic MCM likely results in the movement of domain A before the initiation of MCM activity and DNA replication. The SANS data presented here provide solution data to support these biochemical data regarding the required movement of domain A for MCM function.
The methods developed here for N-mtMCM solution structure modeling extend the capabilities of current all-atom methods for the modeling of IDPs (12,14) to include protein complexes in which unstructured flexible regions in each monomer can be treated independently. An examination of the best-fit and ensemble average model SANS curves provides biologically relevant insight into the family of structures that exist in solution. In the absence of DNA binding, the unstructured loop region between domains A and B/C must be able to assume a wide range of conformations, independently for each monomer, to be consistent with the SANS data. Upon DNA binding, the N-mtMCM complex can take on a more symmetric form in which the unstructured region in each monomer is in the same conformation, matching that found in the x-ray crystal structure. This type of analysis would not have been as straightforward to implement using other existing, generally available, ensemble modeling techniques.
In this work we have presented a unique example of the application of all-atom ensemble structure modeling to a large, multisubunit protein complex; however, the newly developed software can be applied to many different types of protein complexes, which can be as small as dimers or as large as viruses. Furthermore, although N-mtMCM consists of 12 identical monomers, the software can be applied to heterogeneous complexes as well. Thus, the methods shown here will be generally applicable to other large, multimeric protein complexes that contain unstructured regions.
Acknowledgments
We thank Ken Rubinson for helpful discussions and assistance in obtaining the SANS data. We also thank Jane Ladner for assistance in building the starting dodecamer model structure from 1LTL.
This work was supported by a grant from the National Science Foundation (MCB-0815646 to Z.K.) and utilized facilities supported in part by the National Science Foundation under Agreement No. DMR-0944772.
Supporting Material
References
- 1.Brewster A.S., Chen X.S. Insights into the MCM functional mechanism: lessons learned from the archaeal MCM complex. Crit. Rev. Biochem. Mol. Biol. 2010;45:243–256. doi: 10.3109/10409238.2010.484836. [DOI] [PMC free article] [PubMed] [Google Scholar]
- 2.Costa A., Onesti S. Structural biology of MCM helicases. Crit. Rev. Biochem. Mol. Biol. 2009;44:326–342. doi: 10.1080/10409230903186012. [DOI] [PubMed] [Google Scholar]
- 3.Sakakibara N., Kelman L.M., Kelman Z. Unwinding the structure and function of the archaeal MCM helicase. Mol. Microbiol. 2009;72:286–296. doi: 10.1111/j.1365-2958.2009.06663.x. [DOI] [PubMed] [Google Scholar]
- 4.Brewster A.S., Wang G., Chen X.S. Crystal structure of a near-full-length archaeal MCM: functional insights for an AAA+ hexameric helicase. Proc. Natl. Acad. Sci. USA. 2008;105:20191–20196. doi: 10.1073/pnas.0808037105. [DOI] [PMC free article] [PubMed] [Google Scholar]
- 5.Bae B., Chen Y.-H., Nair S.K. Insights into the architecture of the replicative helicase from the structure of an archaeal MCM homolog. Structure. 2009;17:211–222. doi: 10.1016/j.str.2008.11.010. [DOI] [PubMed] [Google Scholar]
- 6.Fletcher R.J., Bishop B.E., Chen X.S. The structure and function of MCM from archaeal M. thermoautotrophicum. Nat. Struct. Biol. 2003;10:160–167. doi: 10.1038/nsb893. [DOI] [PubMed] [Google Scholar]
- 7.Liu W., Pucci B., Ladenstein R. Structural analysis of the Sulfolobus solfataricus MCM protein N-terminal domain. Nucleic Acids Res. 2008;36:3235–3243. doi: 10.1093/nar/gkn183. [DOI] [PMC free article] [PubMed] [Google Scholar]
- 8.Dyson H.J., Wright P.E. Intrinsically unstructured proteins and their functions. Nat. Rev. Mol. Cell Biol. 2005;6:197–208. doi: 10.1038/nrm1589. [DOI] [PubMed] [Google Scholar]
- 9.Uversky V.N., Dunker A.K. Understanding protein non-folding. Biochim. Biophys. Acta. 2010;1804:1231–1264. doi: 10.1016/j.bbapap.2010.01.017. [DOI] [PMC free article] [PubMed] [Google Scholar]
- 10.Chen Y.-J., Yu X., Egelman E.H. Structural polymorphism of Methanothermobacter thermautotrophicus MCM. J. Mol. Biol. 2005;346:389–394. doi: 10.1016/j.jmb.2004.11.076. [DOI] [PubMed] [Google Scholar]
- 11.Kasiviswanathan R., Shin J.-H., Kelman Z. Biochemical characterization of the Methanothermobacter thermautotrophicus minichromosome maintenance (MCM) helicase N-terminal domains. J. Biol. Chem. 2004;279:28358–28366. doi: 10.1074/jbc.M403202200. [DOI] [PubMed] [Google Scholar]
- 12.Rambo R.P., Tainer J.A. Bridging the solution divide: comprehensive structural analyses of dynamic RNA, DNA, and protein assemblies by small-angle X-ray scattering. Curr. Opin. Struct. Biol. 2010;20:128–137. doi: 10.1016/j.sbi.2009.12.015. [DOI] [PMC free article] [PubMed] [Google Scholar]
- 13.Bernadó P., Mylonas E., Svergun D.I. Structural characterization of flexible proteins using small-angle X-ray scattering. J. Am. Chem. Soc. 2007;129:5656–5664. doi: 10.1021/ja069124n. [DOI] [PubMed] [Google Scholar]
- 14.Pelikan M., Hura G.L., Hammel M. Structure and flexibility within proteins as identified through small angle X-ray scattering. Gen. Physiol. Biophys. 2009;28:174–189. doi: 10.4149/gpb_2009_02_174. [DOI] [PMC free article] [PubMed] [Google Scholar]
- 15.SASSIE. http://www.smallangles.net/sassie. Accessed August 22, 2011.
- 16.Curtis J.E., Raghunandan S., Krueger S. SASSIE: a program to study intrinsically disordered biological molecules and macromolecular ensembles using experimental scattering restraints. Comput. Phys. Commun. 2011 [Google Scholar]
- 17.Glinka C.J., Barker J.G., Orts W.J. The 30 m small-angle neutron scattering instruments at the National Institute of Standards and Technology. J. Appl. Cryst. 1998;31:430–445. doi: 10.1107/S1600576722000826. [DOI] [PMC free article] [PubMed] [Google Scholar]
- 18.Kline S.R. Reduction and analysis of SANS and USANS data using IGOR Pro. J. Appl. Cryst. 2006;39:895–900. [Google Scholar]
- 19.Brooks B.R., Brooks C.L., 3rd, Karplus M. CHARMM: the biomolecular simulation program. J. Comput. Chem. 2009;30:1545–1614. doi: 10.1002/jcc.21287. [DOI] [PMC free article] [PubMed] [Google Scholar]
- 20.Emsley P., Cowtan K. Coot: model-building tools for molecular graphics. Acta Crystallogr. D Biol. Crystallogr. 2004;60:2126–2132. doi: 10.1107/S0907444904019158. [DOI] [PubMed] [Google Scholar]
- 21.MacKerell A.D., Bashford D., Karplus M. All-atom empirical potential for molecular modeling and dynamics studies of proteins. J. Phys. Chem. B. 1998;102:3586–3616. doi: 10.1021/jp973084f. [DOI] [PubMed] [Google Scholar]
- 22.Phillips J.C., Braun R., Schulten K. Scalable molecular dynamics with NAMD. J. Comput. Chem. 2005;26:1781–1802. doi: 10.1002/jcc.20289. [DOI] [PMC free article] [PubMed] [Google Scholar]
- 23.Heidorn D.B., Trewhella J. Comparison of the crystal and solution structures of calmodulin and troponin C. Biochemistry. 1988;27:909–915. doi: 10.1021/bi00403a011. [DOI] [PubMed] [Google Scholar]
- 24.Krueger S., Gorshkova I., Schwarz F.P. Determination of the conformations of cAMP receptor protein and its T127L,S128A mutant with and without cAMP from small angle neutron scattering measurements. J. Biol. Chem. 1998;273:20001–20006. doi: 10.1074/jbc.273.32.20001. [DOI] [PubMed] [Google Scholar]
- 25.Shin J.-H., Heo G.-Y., Kelman Z. The Methanothermobacter thermautotrophicus MCM helicase is active as a hexameric ring. J. Biol. Chem. 2009;284:540–546. doi: 10.1074/jbc.M806803200. [DOI] [PubMed] [Google Scholar]
- 26.Costa A., Pape T., Onesti S. Structural basis of the Methanothermobacter thermautotrophicus MCM helicase activity. Nucleic Acids Res. 2006;34:5829–5838. doi: 10.1093/nar/gkl708. [DOI] [PMC free article] [PubMed] [Google Scholar]
- 27.Sakakibara N., Schwarz F.P., Kelman Z. ATP hydrolysis and DNA binding confer thermostability on the MCM helicase. Biochemistry. 2009;48:2330–2339. doi: 10.1021/bi801921j. [DOI] [PubMed] [Google Scholar]
- 28.Costa A., Pape T., Onesti S. Structural studies of the archaeal MCM complex in different functional states. J. Struct. Biol. 2006;156:210–219. doi: 10.1016/j.jsb.2006.04.001. [DOI] [PubMed] [Google Scholar]
- 29.Jenkinson E.R., Costa A., Chong J.P. Mutations in subdomain B of the minichromosome maintenance (MCM) helicase affect DNA binding and modulate conformational transitions. J. Biol. Chem. 2009;284:5654–5661. doi: 10.1074/jbc.M806973200. [DOI] [PMC free article] [PubMed] [Google Scholar]
- 30.Hardy C.F.J., Dryga O., Sclafani R.A. mcm5/cdc46-bob1 bypasses the requirement for the S phase activator Cdc7p. Proc. Natl. Acad. Sci. USA. 1997;94:3151–3155. doi: 10.1073/pnas.94.7.3151. [DOI] [PMC free article] [PubMed] [Google Scholar]
- 31.Hoang M.L., Leon R.P., Sclafani R.A. Structural changes in Mcm5 protein bypass Cdc7-Dbf4 function and reduce replication origin efficiency in Saccharomyces cerevisiae. Mol. Cell. Biol. 2007;27:7594–7602. doi: 10.1128/MCB.00997-07. [DOI] [PMC free article] [PubMed] [Google Scholar]
- 32.Fletcher R.J., Chen X.S. Biochemical activities of the BOB1 mutant in Methanobacterium thermoautotrophicum MCM. Biochemistry. 2006;45:462–467. doi: 10.1021/bi051754z. [DOI] [PubMed] [Google Scholar]
- 33.Sakakibara N., Kasiviswanathan R., Kelman Z. Mutational analysis of conserved aspartic acid residues in the Methanothermobacter thermautotrophicus MCM helicase. Extremophiles. 2011;15:245–252. doi: 10.1007/s00792-010-0352-1. [DOI] [PubMed] [Google Scholar]
Associated Data
This section collects any data citations, data availability statements, or supplementary materials included in this article.