Abstract
To assess the quality of high dose rate (H,D,R.) interstitial implants in breast cancer by using different volumetric indices and correlating them with skin and subcutaneous tissue toxicity. Out of 15 patients who were selected for interstitial implants after undergoing breast conservation surgery, five were treated radically with 34 Gy in 10 fractions in 5 days @ 3.4 Gy # twice daily and 10 patients recieved boost dose of 12 Gy in 4 fractions @ 3 Gy /# twice daily. The median follow up was 15 months. During each follow up assessment of late skin and subcutaneous tissue toxicity as per RTOG criteria was done . Various dosimetric indices were analysed. Dose Volume Histogram for dose per unit volume of skin for 10cc,5cc,2cc,1cc,0.1cc and 0.01cc was calculated. Best estimates and correlation of toxicity was revealed by assessment of Dose Nonuniformity Ratio(DNR) which also correlated well with geometry defining indices like Uniformity Index (UI).Volumetric assessment of skin dose for less than 2 cc correlated most with toxicity. DNR and UI can help us to assess and correlate late skin and subcutaneous tissue toxicity and thus serve useful to determine the quality of implant.
Keywords: Brachytherapy, Breast, Dosimetric indices
In recent years brachytherapy by using high dose rate with 192 Ir source for partial breast irradiation as well as boost after external irradiation has been an established modality of treatment of early breast cancer. Despite the advantages of brachytherapy with regard to tumour control, maintaining good cosmesis and minimum skin and subcutaneous tissue toxicity is important. RTOG 95–17 was the first prospective cooperative group trial which evaluated both acute and chronic toxicity rates for both low (LDR) and high (HDR) accelerated partial breast irradiation (APBI) [1]. Till date various studies have evaluated normal tissue toxicity primarily on brachytherapy techniques: multiple catheter based interstitial or mammosite and also primarily concentrated on planar separation of catheters, dwell position and volume of tissue encompassed by 100%, 150%, 200% isodose lines[2–5]. Very little information is available to evaluate the quality of brachytherapy done using various dosimetric volumetric indices comprehensively and correlating them with the toxicity outcome. The present study was undertaken not only to evaluate the quality of HDR brachytherapy by assessing various volumetric indices in early stage post lumpectomy patients whether treated radically or as boost and correlating with toxicity outcome but also to analyse which indices prove to be better in assessing the outcome.
Material and Methods
Between December 2006 and January 2008 total 15 patients of early stage breast cancer were selected. Patients were eligible if the all of the following criteria were met
Unicentric primary cancer with invasive ductal histology
Stage T1, T2, N0, N1
Negative (< 1 mm) microscopically assessed surgical margin
Patients were considered ineligible if any of the following were present
Tumor histology with invasive or in situ lobular carcinoma or pure ductal carcinoma in situ
Skin involvement
A breast unsatisfactory for brachytherapy (defined as having <1 cm thickness of breast tissue within the entire impact volume, as measured from skin to pectoralis fascia or subareolar position of lumpectomy cavity)
History of prior primary malignancy.
History of prior irradiation to chest wall
History of unresected residual carcinoma
History of vascular disease or concurrent pregnancy.
Informed consent was taken for all patients in this study. All patients were initially evaluated by a detailed history ,a thorough clinical examination followed by routine investigations comprising of Hemogram, Liver FunctionTests (LFT), Kidney Function Tests (KFT), Chest X-ray, a preoperative mammography and ultrasound (USG) of the abdomen.
All selected patients underwent lumpectomy and level II axillary nodal clearance. Surgical clips were applied to the medial, lateral, superior, inferior surfaces of the cavity .Following wound healing all patients underwent CT scan of thorax. Thus lumpectomy cavity delineation was done both by direct visualisation of the surgical clips and scarred tissue on the CT images. CT slice thickness was 2.5 mm.
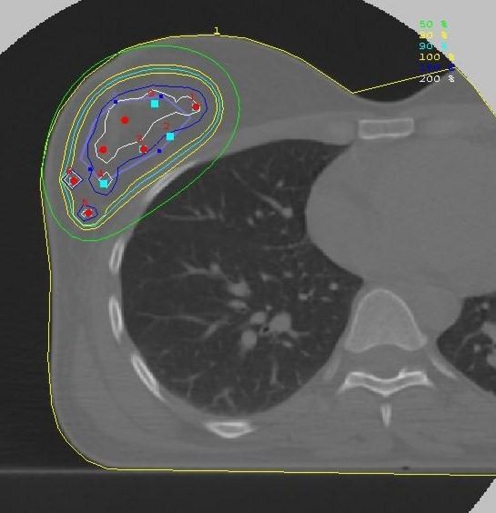
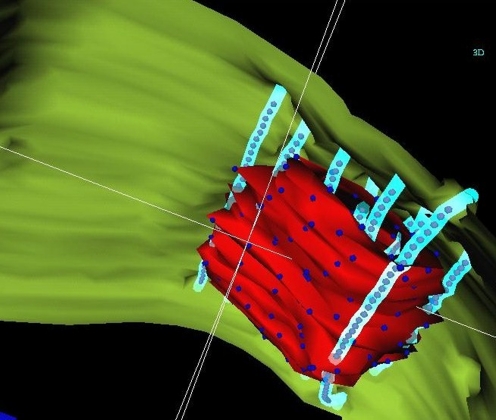
Following this, implant procedure was carried under general anaesthesia and needles were inserted by free hand technique or by rigid template system. Decision of doing a double plane or a triple plane implant was based on the depth and size of the lumpectomy cavity. The interplane separation was 1.5 cm & inter catheter separation was 1–1.5 cm. After the catheter insertion, non contrast multislice CT scans of the in-situ catheter in the lumpectomy cavity were taken. These images were transferred to treatment planning station (TPS) by LAN network using ACRNIMA DICOM software and using Nucleotron Plato Brachytherapy VIG 2.3 version images were reconstructed at TPS. The planning target volume was defined as lumpectomy cavity plus 2 cm margin of breast tissue as delineated by surgical clips on CT images. Dose was prescribed to the margin of the PTV. Final plan was obtained after using graphical optimisation tool over geometrically optimized plan. Dose was edited 5 mm from skin (Figs. 1 and 2). Execution of treatment was done by using after loaded HDR microselectron machine using Ir 192 source of strength 10 Ci of step size 2.5 mm.
Fig. 1.
Isodose distribution after planning
Fig. 2.
3D dose distribution
Thirty four Gy in 10 fractions in 5 days @ 3.4 Gy # twice daily was given to five patients selected for radical treatment and ten patients selected for boost were treated to a total dose of 12 Gy in 4 fractions @ 3 Gy /# twice daily. Interfraction time of minimum of 6 h was maintained.
The target volume +2 cm margin was taken as PTV. The volume encompassed by the 100% isodose was taken as target reference (TV ref) and the common area encompassed by PTV and TV ref was taken as reference volume (Vref).
Based on this dosimetric indices were analysed for each patient from the cumulative and differential dose volume histogram.
Coverage index CI = V ref/ PTV
It is defined as fraction of the target volume receiving a dose equal to or greater than the reference dose. This index helps us to understand how much of the target is covered by the 100% dose and thus help in assessing local control.
Ideally it should be 1.
Normal tissue conformity index (NTCI) = V ref /TVref
It is defined as the ratio of the volume of the target which is covered by the reference isodose curve to the implant volume delineated by the reference isodose curve.
External volume index (EVI) = 1–Vref / TVref
It is amount of normal tissue volume that receives a dose equal to or greater than the reference dose.
EVI and NTCI are complementary to each other and both help to understand how mush of normal tissue is irradiated and thus analyse local toxicity.
Dose Homogeneity Index (DHI) = 1–V150/ V100
Total treatment volume enclosed by the prescribed treatment dose rate and that enclosed by a volume in which the dose is 50% higher than the prescribed treatment dose rate. The dose homogeneity index (DHI) is used to assess implant quality; such that the higher the DHI, the more uniform is the dose distribution within a treatment volume.
Dose nonuniformity ratio (DNR) DNR = Vhdr / Vrdr
Defined as the ratio of high dose volume to low dose (reference volume) Vhdr = volume receving high dose rates greater than some multiplication factor (1.5—as suggested by Saw) Vrdr = reference volume.
Using Anderson’s dose volume histogram Uniformity Index (UI) and Quality Index (QI) were also noted for each patient . Natural dose volume histogram (Lowell Anderson) does not take into account the inverse square relationship . UI is defined as the volume between the dose values of prescribed dose (PD) and high dose (HD),normalized to the u- interval (u = D-3/2) between PD and HD, divided by the volume encompassed by PD, normalized to the u interval between PD and the infinity dose. QI is defined as the volume between the dose values of low dose (LD) and high dose (HD),normalized to the u- interval (u = D-3/2) between LD and HD ,divided by the volume encompassed by LD, normalized to the u interval between LD and the infinity dose. UI helps us to evaluate how well the target is covered by the dose distribution and QI correlates with the homogenous dose distribution.
Four millimeter thick skin was contoured on each CT image of each patient and using cumulative DVH for skin dose per unit volume for 10cc,5cc,2cc,1cc,0.1cc,0.01cc was calculated.
No patients had suffered from any complications while on treatment and there was no treatment interruption.
Patients were assessed 2 weeks after treatment completion and then at 3 monthly intervals. Mammograms were obtained at 6 months after the implant. On each follow up visit local skin and subcutaneous toxicity was analysed. Skin and subcutaneous toxicity were graded according to the RTOG system [6]. The toxicity scores recorded on the last follow-up visit were used for analysis (Table 1).
Table 1.
Skin and subcutaneous toxicity grading according to the RTOG/European Organization
| Skin | Grade1 | Grade2 | Grade3 | Grade4 |
| Toxicity | Slight atrophy, pigmentation change, some hair loss | Patchy atrophy, moderate telangiectasia, total hair loss | Marked atrophy, gross telangiectasia | Ulceration |
| Sub cutaneous tissue | Grade1 | Grade2 | Grade3 | Grade4 |
| Toxicity | Slight induration (fibrosis) and loss of subcutaneous fat | Moderate fibrosis but asymptomatic Slight field contracture <10% linear reduction | Severe induration and loss of subcutaneous tissue Field contracture >10% linear measurement | Necrosis |
Statistical Analysis
Measures of central tendency were calculated for patient related characteristics and dosimetric indices. These included age, menopausal status, pT size ,number of nodes removed, grade of the tumour, presence of lymphovascular emboli, margins postivity, stage (pathological), target volume, irradiated volume of breast tissue, CI ,EVI, NTCI ,DHI, DNR, UI, QI. Patients were divided into two groups based on Grade (Gr )of skin and subcutaneous tissue toxicity. One group consisted of those who had Gr 1 toxicity and the other group comprised of those who had Gr 2–3 toxicity. Comparison of means was done for each group of patients with respect to irradiated volume, EVI, NTCI, DNR. Median values of skin dose per unit volume of 10cc,5cc,2cc,1cc,0.1cc,0.01cc were also compared between the two groups. Univariate regression and correlation tests were done between UI with DHI, DNR and similarly between QI with DHI, DNR.
Results
The median age of patients was 60 years. Out of 15 patients 5 patients had age >60 years and 10 patients had <59 years of age. Nine patients were premenopausal and 6 patients were postmenopausal. Post surgery the median pathological tumour size was 2 cm (range- 1–2.5 cm). Ten patients had positive margins and 5 patients had margins free of tumour (Table 2).
Table 2.
Patient related characteristics
| Age | <59 year | 10 |
| Median–60 year | >60 year | 5 |
| Menopausal status | Premenopausal | 6 |
| postmenopausal | 9 | |
| pT size | <2 cm | 7 |
| > 2 cm | 8 | |
| No. of nodes removed | <10 | 5 |
| >10 | 10 | |
| Grade | I | 1 |
| >II | 14 | |
| LVI | Positive | 5 |
| negative | 10 | |
| Margins | Close | 5 |
| Free | 10 | |
| Stage (p) | I | 13 |
| II | 2 |
The median number of nodes removed were 10 (range- 4–20) (Table 3). Majority of patients (14 out of 15 patients ) had grade II tumour. Estrogen receptor (ER )was positive in 8 patients and Progesterone receptor (PR) was positive in 7 patients; both were negative in 6 patients. The median time interval between surgery and implant was 7 weeks (range 3–9 weeks).
Table 3.
Brachytherapy characteristics
| Template used | Yes | 9 |
| no | 6 | |
| No. of catheters | <10 | 5 |
| Median 10 (range 9–16) | >10 | 10 |
| No. of planes | 2 | 8 |
| 3 | 7 | |
| Volume of irradiation | ||
| Median–107.5 cc | <100 cc | 6 |
| Range 56.8 cc–196.96 cc | >100 cc | 9 |
The median number of catheter used was 10 (range- 9–16). A biplanar implant was done in 8 patients and three planes were done in 7 patients. In 9 patients a rigid template was used. The median volume of irradiated breast tissue was 107.5 cc (range 56.8 cc–196.96 cc) The median values and range of various dosimetric indices (Table 4).
Table 4.
The median values and range of various dosimetric indices
| Name | Median | Range |
|---|---|---|
| TVref | 57.75 cc | 26cc–131.43 cc |
| CI | 0.93 | 0.63–0.993 |
| NTCI | 0.498 | 0.197–0.809 |
| EVI | 0.50 | 0.20–0.803 |
| V150 | 52 cc | 22–74 cc |
| V200 | 18.7 cc | 14.2 cc–23.4 cc |
| DNR | 0.35 | 0.2–0.548 |
| DHI | 0.65 | 0.452–0.79 |
| QI | 1.35 | 1.19–1.65 |
| UI | 1.31 | 1.22–1.74 |
With the use of template 5/8 patients (62.5%) achieved CI > 90% and without the use also 3/7 (42.8%) patients achieved CI > 90% (p = 0. 5) Whereas without its use more patients achieved <90% CI (4/7 i.e.57.14%). Hence though the use of template can help to achieve a better CI it is not mandatory to use it because even without its use CI > 90% can be achieved (Table 5).
Table 5.
CI (Conformity Index)
| CI | Template yes | Template no |
|---|---|---|
| >90% | 5 | 3 |
| <90% | 3 | 4 |
On follow up visits patients were assessed for late (after 3 months) skin and subcutaneous tissue toxicity using RTOG criteria. The median follow up was 15 months. Seven out of 15 patients (46.66%) had Gr 1 reactions. Out of which 3 patients were treated with radical dose and 4 patients were treated with boost dose. Eight out of 15 patients (53.33%) had Gr 2–3 reactions; out of which 2 patients were treated with radical dose and 6 had undergone boost treatment (Tables 6 and 7).
Table 6.
Grade of reactions and no. of patients
| Gr of reaction | No of patients |
|---|---|
| 1 | 7 |
| 2–3 | 8 |
Table 7.
Patients groups for Gr of reactions as per intent of treatment
| Radical | Boost | |
|---|---|---|
| Gr 1 | 3 | 4 |
| Gr 2–3 | 2 | 6 |
Correlation of Volumetric Indices with Toxicity Outcome
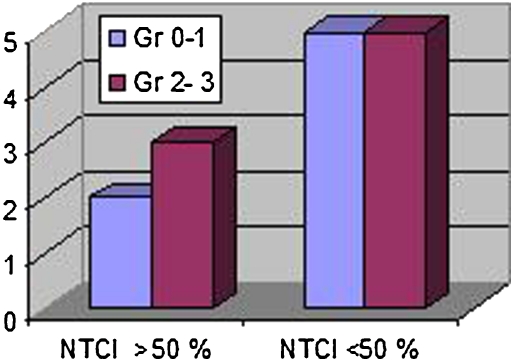
NTCI > 50% indicates that 100% isodose covers the target well. Two out of 15 (13.3%) patients had good NTCI and Gr 0–1 reaction as compared to 5/15 (33.3%) patients who had NTCI <50% & Gr 2–3 reaction; 3/15 (20.0%) patients had also Gr 2–3 reaction inspite of good NTCI. (Table 8, Fig. 3). Sixty percent of patients (3 out of 5) who had NTCI >50% had Gr 2–3 reactions, whereas 50% (5 out of 10) of patients who had NTCI <50% had Gr2-3 reactions.
Table 9.
EVI and Gr of reaction
| E.V.I | Gr 1 | Gr 2–3 |
|---|---|---|
| >50% | 5 | 6 |
| <50% | 2 | 2 |
Fig. 3.
NTCI and grade of reaction
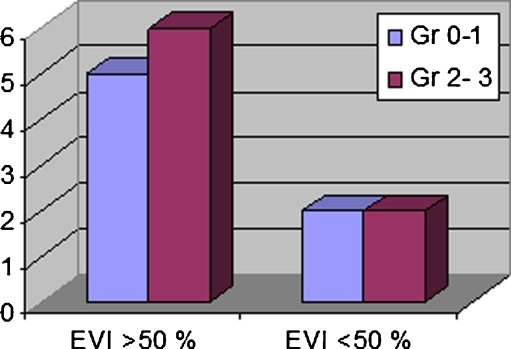
This suggests that 100% isodose coverage of target does not imply a good quality brachytherapy as because even with good coverage of target excess normal tissue toxicity may compromise on cosmetic outcome in a well preserved breast. Hence to judge normal tissue irradiation external volume index was accounted. (Table 9, Fig. 4) 6/11 (54.5%) pts had Gr 2–3 reactions when EVI was >50% whereas when EVI was <50%, 50% (2/4) patients had Gr 0–1 & also Gr 2–3 reaction. The median EVI for those who had Gr 2–3 reactions was 54% and the median EVI for those who had Gr I reactions was 44%. Hence ideally EVI should be below 50% to avoid any toxicity. However EVI <50% does not necessarily mean that there will be no grade 2 reactions.
Table 8.
NTCI and gr of reaction
| NTCI | Gr 1 | Gr 2–3 |
|---|---|---|
| >50% | 2 | 3 |
| <50% | 5 | 5 |
Fig. 4.
EVI and grade of reaction
Hence both EVI and NTCI should be used to see adequate target coverage as well as less normal tissue irradiation.
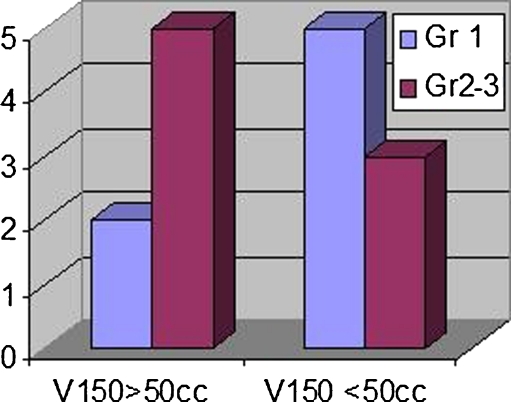
Three out of six patients i.e. 50% patients whose volume of irradiation was <100 cc had Gr 2–3 reactions whereas 7 out of 9 patients i.e 77.77% patients whose irradiation volume was >100 cc had Gr 2–3 reactions. Five out of 7 patients (71.4%) patients had Gr 2–3 reactions when V150>50% whereas 3 out of 5 patients (60%) had Gr 2–3 reactions when V150<50%. (Table 10, Fig. 5). Median value of V150 was 52 cc.
Table 10.
Gr of reaction as per V150
| Gr 1 | Gr 2–3 | |
|---|---|---|
| V150 >50 cc | 2 | 5 |
| V150 <50 cc | 5 | 3 |
Fig. 5.
V150 and grade of reaction
The median value of V200 was 18 cc. On subset analysis it was seen that when V200 was >18cc. Four out of seven (57.14%) patients who had V200 >18cc experienced Gr 2–3 toxicities whereas 4 out of 8 (50%) patients who had V200 <18 cc experienced Gr 1 toxicity (Table 11).
Table 11.
Gr of reaction as per V200
| Gr 1 | Gr 2–3 | |
|---|---|---|
| V200>18 cc | 3 | 4 |
| V200 <18cc | 4 | 4 |
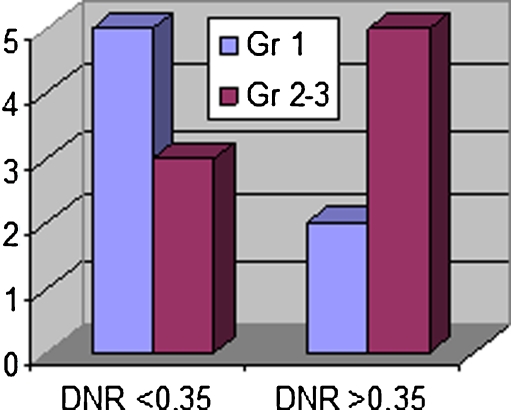
Apart from normal tissue irradiation homogenous dose distribution within the target without any hyperdose areas is also important. Dose non uniformity ratio (Saw & Suntharalingam) takes into account the ratio of hyperdose (V150) to prescribed dose (V100) area (DNR = V150/V100). The lesser the value the lesser is the amount of hyperdose area and thus greater is the homogenous dose distribution accounting for less toxicity. DHI is 1-V150/V100. Median value of DNR was 0.35 as shown in Table 5 and Fig. 6. Seven out of 15 patients (46.66%) patients had DNR <0.35, and out of which 5 patients(71.4%) had Gr 2–3 reactions. Whereas only 3 out of 8 patients (37.5%) having DNR <0.35 had Gr 2–3 reactions (Table 12).
Fig. 6.
DNR and grade of reaction
Table 12.
DNR and Gr of reaction
| DNR | Gr 1 | Gr 2–3 |
|---|---|---|
| <0.35 | 5 | 3 |
| >0.35 | 2 | 5 |
Hence on comparing the correlation of EVI, NTCI, DNR with Gr 2–3 reactions it was observed that 71.4% of patients had correlation with Grade 2–3 reactions when DNR >0.35 (Table 13).
Table 13.
Correlation of EVI, NTCI, DNR with Gr 2–3 reactions
| Grade 2–3 reactions | |||
|---|---|---|---|
| Index | Value | No. of patients | % |
| EVI | >50% | 6/11 | 54.5 |
| NTCI | <50% | 5/10 | 50.0 |
| DNR | >0.35 | 5/7 | 71.4 |
Toxicity can be better analysed by using DNR than by using other indices like EVI, NTCI. This implies that homogenous dose distribution without any large areas of hyperdose region within the target is more important than normal tissue irradiation to avoid skin toxicity.
Correlation of volumetric indices with geometry defining indices. Both distributed and contiguous volume dose histogram are difficult to interpret due to effect of inverse square law dose gradient on the dose distribution. Hence natural dose volume histogram (Lowell Anderson) which does not take into account the inverse square relationship was used in which dV/d u is plotted as a function of u, with u = D-3/2.
Assessment of correlation of geometric indices with volumetric indices done by using Spearman’s correlation coefficient.
Results of correlation of DHI with UI was 58% (variance p < 0.0001) and with QI was 36% (variance p < 0.02). Similarly DNR has also shown more correlation with UI (62% variance, p < 0.0001) than with QI (variance 41% p < 0.02).
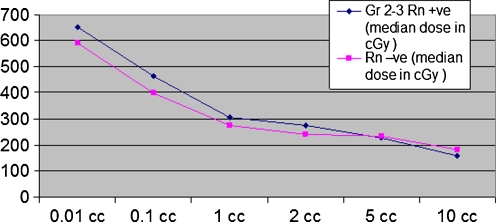
Four millimeter thick skin was contoured on CT images of each patient and using cumulative DVH for skin dose per volume for 10cc5cc,2cc,1cc,0.1cc,0.01cc was calculated. The median dose for each volume was noted separately for both groups of patients (those who had Gr 2–3 reactions and those who did not have). After doing linear plots of skin dose for various volumes and comparing between the two groups of patients it was observed that to analyse skin toxicity as a measure of skin dose per unit volume not more than 2 cc of skin volume should be considered. Beyond that as the volume of skin increases (specially >5 cc) results can be erroneous and misleading (Table 14, Fig. 7).
Table 14.
| Vol of skin | Gr 2–3 Rn +ve (median dose in cGy) | Gr 1 (median dose in cGy) |
|---|---|---|
| 10CC | 159 | 182 |
| 5CC | 227 | 234 |
| 2CC | 274 | 240 |
| 1CC | 304 | 276 |
| .1CC | 464 | 399 |
| .01CC | 653 | 589 |
Fig. 7.
Volumetric skin dose and toxicity. X axis—volume of skin. Y axis—median skin dose
Discussion
In early stage breast carcinoma, postoperative irradiation with interstitial brachytherapy has been accepted as a breast conserving procedure.
However the issue that is important in these patients is that not only adequate tumour control but also minimum normal tissue complications particularly of skin and subcutaneous tissue and thus maintaining a good cosmetic outcome is imperative. Both patient related and therapy related characteristics play an important role in the entire treatment outcome.
Since patient related characteristics like age, menopausal status, tumour size, grade, histology are unmodifiable, therapy related aspects like performing a good quality interstitial implant can be done to achieve an acceptible treatment outcome both with regard to tumour control and skin and subcutaneous tissue toxicity. Assessment of quality of interstitial implants is the fundamental issue in obtaining a desired outcome. Over the past 5 years several groups have explored this particular aspect but technical information provided on the quality assuarance of implants has been minimal [7–9].
Traditionally brachytherapy dosimetry had been based on orthogonal films after simulating a patient by insertion of dummy ribbons in catheters of implant. Studies by Das et al. and Vicini et al. have shown that pre and post implant CT based dosimetry allows a better dose volume analysis [10–13]. Hence the present study was conducted using CT based images which helped to accurately identify the lumpectomy cavity and thus define the target properly. This was further substantiated by the presence of surgical clips at the cavity margins. CT based dosimetry also helped to understand the relationship between target coverage and normal tissue irradiation and thus analyse different volumetric indices.
Different authors had used different volumetric indices to define and quantify the quality of implant. These indices are related to the homogeneity of the dose distribution resulting from a given source configuration or as it exists inside the target volume. Five quantitative parameters have been defined previously- Coverage Index (CI), External Volume Index(EVI), Normal Tissue Conformity Index(NTCI), Relative Dose Homogeneity Index (DHI )and Dose Nonuniformity Ratio(DNR).
Wu et al. defined Dose Homogeneity Index (DHI) as a ratio of volume enclosed by high dose rate i.e. dose which is 50% higher than the prescribed treatment dose rate with the total treatment volume enclosed by the prescribed treatment rate [14, 15]. The higher the DHI, the more uniform is the dose distribution within the treatment volume. Moreover this index provides a guide to suggest that as the treatment volume thickness increases it may be optimal to so far a three plane implant rather than a plane implant.
Cheng B Saw and Nagalingan Suntharalingam proposed the idea of Dose Non uniformity and defined Dose Non uniformity Ratio (DNR) as a ratio of high dose volume to the reference treatment dose rate volume [16–18]. The high dose volume referred to volume receiving dose rates equal to or greater than by a multiplicative factor (> l.0) of the reference dose rate. Thus the concept of DNR was an expansion of the concept of DHI and was applicable to various dose rates. The dose rate at which DNR shows a minimum value if selected as the treatment dose rate, gives an optimized dose distribution. DNR plots are not influenced by the extent and location of the target volume. In the present study the primary objective is to maximize both coverage index, homogeneity index and NTCI and minimize EVI. If the target volume assumes the contour of the treatment dose rate, then the CI is 100%, EI is zero and HI has the value of 100- DNR %.
American Brachytherapy Society (ABS) recommendations are- target coverage >90% of dose delivered to >/90% of the target volume; V150 -<70 cc; V200- <20 cc; DHI >/0.75 [19].
Results analysed show that the EVI had a range from 20–80% and NTCI had a range from 19.7%–80.9%. While correlating the incidence of skin and subcutaneous tissue toxicity with EVI and NTCI it has been seen that when EVI is >50% there has been a difference of 8% incidence between those having Gr1 and those having Gr 2–3 reactions and no difference in incidence when EVI <50% or when NTCI <50%.
Estimation of V150 and thus DNR results has shown that there has been a difference of incidence of 42.9% (71.4%–Gr 2–3 and 28. 5% Gr 1 reactions) when DNR >0.35.
The median volume covered by 150% isodose was 52 cc. and V200 was 18cc . On subset analysis it was seen that when V200 was >18cc. Fifty percent of patients had Gr 2–3 toxicities and when V200 was <18 cc only 57.14% patients had Gr 2–3 toxicities and thus the difference was 7.14% when V200 is considered. However when V150 was considered 71.4% patients had Gr 2–3 toxicities when V150 was >50 cc and 57.1% patients had Gr 2–3 toxicities when V150 was <50 cc and thus difference between the two groups was 14.3% which was almost double to as observed with V200 Hence V150 is a more useful tool than V200 in analysis.
For an ideal implant with a homogenous dose distribution V150 should approach zero and DHI should approach 1.0. In reality DHI of 1.0 can only be achieved with an infinite number of catheters.
Using CT image based geometric optimization and graphical optimization the median CI was 93% (range- 63%–99.3%). Moreover 62.5% patients achieved CI >90% with the use of template though 37.5% patients did not achieve CI >90% even with its use. This indicates that use of template can help to achieve CI >90% but its use may not be absolutely essential because even without its use the study has shown that CI >90% can be achieved. The ABS has also suggested that the use of template is optional.
Baltas et al. applied conformation index in brachytherapy as COIN which he defined as a product of quality of tumor irradiation, irradiation of non critical healthy tissues and irradiation of critical organs [20, 21].
This is based exclusively on global intersection in a Euclidean space geometric model and has practical limitations to use in clinical practice.
However the most useful formulation of the dose volume histogram for brachytherapy is the one which suppresses the inverse square effect while prescribing proportionality between volume and the area under the curve. Hence the concept of Natural Dose Volume Histogram (NVDH) as proposed by Lowel Anderson in 1986 expressed uniformity of an implant as the extent to which the treatment volume is concentrated between treatment dose rate and high dose rate located on the upper site of the peak of NVDH. The narrowness of the peak describes dose rate uniformity of the implant [22, 23].
In the present study there has been a better correlation of DHI with UI than with QI .Similarly DNR has also shown more correlation with UI (62% variance, p < 0.0001) than with QI (variance 41% p < 0.02)
Estimation of QI includes areas of low dose distribution. Hence there may be large areas of low dose region and yet the distribution may be homogenous. This index is dependent on catheter geometry and we cannot change it. However estimation of UI involves areas of prescribed dose region and high dose region. This gives a better dose distribution by optimisation and hence even in a bad quality implant we can achieve a good UI and this correlates more with dose homogeneity than QI. This also proves the fact that even though in our study estimation of total volume of irradiation suggested that a larger volume of irradiation leads to more toxicity but it is very much imperative that we consider the catheter geometry and analyse these indices to judge our results the best.
It is also noteworthy that correlating skin toxicity as a function of dose per unit volume and subsequently finding Dmax is important. However there has been no study in which skin is contoured and dose per unit volume is assessed.
Hence in the present study an attempt was made to correlate skin toxicity with skin dose per unit volume for various volumes of skin in order to find out in which range of volume of skin there is best association of toxicity. In this study cumulative DVH for skin dose per unit volume for 10cc, 5cc,2cc,1cc,0.1cc,0.01cc after contouring 4 mm thick skin on CT images of each patient indicated that to analyse skin toxicity as a measure of skin dose per volume not more than 2 cc of skin volume should be considered.
Conclusions
While doing brachytherapy in early stage breast cancer not only tumour control but also good cosmetic outcome is important and for achieving this assessment by using different indices is helpful. Calculation of V150 and thus estimation of DNR has been the most useful indicator of skin & subcutaneous tissue toxicity. V150 < 50 cc gives a better cosmetic outcome. Indices like EVI & NTCI may help us to know about amount normal tissue irradiation and hence serve as an useful measure for better cosmesis. Ideally EVI should be <50%. Hence homogenous dose distribution is more important than excess normal tissue irradiation to achieve better cosmetic outcome. Use of template can be helpful for getting a better target coverage. By using Anderson’s natural DVH correlation of quality index & uniformity index with volumetric indices can be done this serves as an useful surrogate of good geometry of implant. Uniformity index gives a better correlation with homogenous dose distribution than quality index. Measurement of skin dose by contouring 4 mm skin and estimating dose per unit volume particularly for 1–2 cc of skin will help us in avoid undue skin toxicity. To achieve acceptible toxicity outcome and thus avoid Gr 2 reactions the proposed dose constraints are; Skin dose should not be more than:
0.01 cc < 500 cGy
0.1 cc < 400 cGy
1 cc < 300 cGy
2 cc < 200 cGy
and to achieve this the dosimetric parameters which can be of help are as
DNR < 0.35, DHI > 0.65
V150 <50 cc
EVI <50%
Uniformity Index (UI) > 1.32
Coverage Index > 90%
The results of the present study has been pertaining to a follow up of 15 months. Though during the course of treatment everyday catheter lengths were checked, catheter shifts that might have taken place during the entire treatment course were not taken into account for treatment execution. Hence a further detailed study with more stringent measurements, more number of patients, a longer follow up and multicentric study can actually help us to evaluate our cosmetic outcome in brachytherapy done for early stage breast cancers and for this the data from this study can be of help and reference.
Acknowledgements
Mr Devraj Goel, Mrs. Girija Amma K, Mrs Meena Gupta, Mr Hardeep Singh and other technical staff of Department of Radiotherapy PGIMER, Chandigarh.
Sources of support Nil
Conflict of interest Nil
References
- 1.Kuske RR, Winter K, Arthur DW, et al. Phase IItrial of brachytherapy alone after lumpectomy for select breast cancer: toxicity analysis of RTOG 95–17. Int J Radiat Oncol Biol Phys 65:45–51 [DOI] [PubMed]
- 2.Vicini FA, Arthur DW. Breast bracytherapy: North American experience. Semin Radiat Oncol. 2015;15:108–115. doi: 10.1016/j.semradonc.2004.10.005. [DOI] [PubMed] [Google Scholar]
- 3.Baglan KL, Martinez AA, Frazier RC, et al. The use of high dose rate breast therapy alone after lumpectomy in patients with early-stage breast cancer treated with breast- conserving therapy. Int J Radiat Oncol Biol Phys. 2001;50:1003–1011. doi: 10.1016/S0360-3016(01)01547-4. [DOI] [PubMed] [Google Scholar]
- 4.Wazer DE, Kaufman S, Cuttino L, et al. Accelerated partial breast irradiation an analysis of variables associated with late toxic and by term cosmetic outcome after high-dose- rate interstitial brachytherapy. Int J Radiat Oncol Biol Phys. 2006;64:489–495. doi: 10.1016/j.ijrobp.2005.06.028. [DOI] [PubMed] [Google Scholar]
- 5.Narayan SS, Goel V, Sarin R, et al. Intraoperative high dose rate 192 Ir radical implant in early breast cancer : a quality assurance and dosimetry study. Int J Radiat Oncol Biol Phys. 2003;56:690–696. doi: 10.1016/S0360-3016(03)00005-1. [DOI] [PubMed] [Google Scholar]
- 6.Wazer DE, Arthur DW, Vicini FA. Acclerated partial breast irradiation. New York: Springer Verlag; 2006. pp. 247–261. [Google Scholar]
- 7.Lawenda BD, Taghian AG, Kachnic LA, et al. Dose volume analysis of radiotherapy for T1N0 invasive breast cancer treated by local excision and partial breast irradiation by low dose rate interstitial implant. Int J Radiat Oncol Biol Phys. 2003;56:671–680. doi: 10.1016/S0360-3016(03)00071-3. [DOI] [PubMed] [Google Scholar]
- 8.Benitez PR, Chen PY, Vicin FA, et al. Partial breast irradiation in breast conserving therapy by way of interstitial brachytherapy. Am J Surg. 2004;188:355–364. doi: 10.1016/j.amjsurg.2004.06.027. [DOI] [PubMed] [Google Scholar]
- 9.Chen PY, Vicini FA, Benitez P, et al. Long term cosmetic results and toxicity after accelerated partial—breast irradiation: a method of radiation delivery by interstitial brachytherapy for the treatment of early -stage breast carcinoma. Cancer. 2006;106:991–999. doi: 10.1002/cncr.21681. [DOI] [PubMed] [Google Scholar]
- 10.Major T, Fodor J, Takacsi-Nagy Z, et al. Evaluation of HDR interstitial breast implants planned by conventional and optimized CT- based dosimetry systems with respect to dose homogeneity and conformality. Strahlenther Onkol. 2005;181:89–96. doi: 10.1007/s00066-005-1350-6. [DOI] [PubMed] [Google Scholar]
- 11.Kestin LL, Jaffray DA, Edmundson GK, et al. Improving the dosimeteric coverage of interstitial high -dose- rate breast implants. Int J Radiat Oncol Biol Phys. 2000;46:35–43. doi: 10.1016/S0360-3016(99)00361-2. [DOI] [PubMed] [Google Scholar]
- 12.Vicini FA, Kestin LL, Edmundson GK, et al. Dose—volume analysis for quality assurance of interstitial brachytherapy for breast cancer. Int J Radiat Oncol Biol Phys. 1999;45:803–810. doi: 10.1016/S0360-3016(99)00174-1. [DOI] [PubMed] [Google Scholar]
- 13.Das KK, Patel R, Shah H, Odau H, Kuske RR. 3D CT -based high dose rate breast brachytherapy implants: treatment plan and quality assurance. Int J Radiat Oncol Biol Phys. 2004;59:1224–1228. doi: 10.1016/j.ijrobp.2004.03.030. [DOI] [PubMed] [Google Scholar]
- 14.Andrew WK, Ulin K, Sternick ES. A dose homogeneity index for evaluating. 192 Ir interstitial breast implants. Med Phys. 1988;15:104–107. doi: 10.1118/1.596242. [DOI] [PubMed] [Google Scholar]
- 15.Saw Cheng B, Nagalingam S. Reference dose rates for single -and double- plane 192Ir Implants. Med Phys. 1988;15:391–396. doi: 10.1118/1.596237. [DOI] [PubMed] [Google Scholar]
- 16.Saw Cheng B, Nagalingam S, Wu A. Concept of dose nonuniformity in interstitial brachytherapy. Int J Radiat Oncol Biol Phys. 1993;26:519–526. doi: 10.1016/0360-3016(93)90971-W. [DOI] [PubMed] [Google Scholar]
- 17.Wong VYW, Leung T, Wong C. Relative dose uniformity assessment in interstitial implant. Int J Radiat Oncol Biol Phys. 1999;44:1179–1184. doi: 10.1016/S0360-3016(99)00129-7. [DOI] [PubMed] [Google Scholar]
- 18.Saw Cheng B, Nagalingam S. Quantitative assessment of interstitial implants. Int J Radiat Oncol Biol Phys. 1991;20:135–139. doi: 10.1016/0360-3016(91)90149-X. [DOI] [PubMed] [Google Scholar]
- 19.Keisch M, Arthur D, Patel R, Rivard M, Vicini F. American brachytherapy society breast brachytherapy task group, February 2007
- 20.Feuvret L, Noel G, Mazeron JJ, et al. Conformity index: a review. Int J Radiat Oncol Biol Phys. 2006;64:333–342. doi: 10.1016/j.ijrobp.2005.09.028. [DOI] [PubMed] [Google Scholar]
- 21.Baltas D, Kolotas C, Geramani K, et al. A Conformal Index (COIN) to evaluate implant quality and dose specification in brachytherapy. Int J Radiat Oncol Biol Phys. 1998;40:515–524. doi: 10.1016/S0360-3016(97)00732-3. [DOI] [PubMed] [Google Scholar]
- 22.Anderson LA. ‘Natural dose volume histogram ’for brachytherapy. Med Phys. 1986;13:898–903. doi: 10.1118/1.595815. [DOI] [PubMed] [Google Scholar]
- 23.Joslin CA. Principles and practice of brachytherapy. Arnold, London, pp 49–80


