

Abstract
In the present study we have generated transgenic mice that express Peroxisome Proliferator-Activated Receptor-alpha (PPARα) in the proximal tubule under the control of kidney androgen-induced protein (KAP2) promoter. Up-regulation of proximal tubule PPARα expression by testosterone treatment in KAP2-PPARα female Transgenic (Tg) mice ameliorated kidney function from cisplatin (CP) or ischemia-reperfusion (I/R)-induced acute kidney injury (AKI). In addition, CP and I/R-mediated inhibition of fatty acid oxidation, and CP-mediated reduced expression of mitochondrial genes associated with oxidative phosphorylation, mitochondrial DNA, fatty acid metabolism, and tricarboxylic acid cycle were ameliorated in KAP2-PPARα Tg mice treated with testosterone. Similarly, CP and I/R-mediated increased in 4-hydroxy-2-hexenal (HHE).-derived lipid peroxidation products were reduced, and CP and I/R-induced necrosis of the proximal tubule S3 segment was reduced. These results suggest an important function of proximal tubule PPARα as a metabolic sensor, and demonstrate that its increased expression in KAP2-PPARα Tg mice, without the use of exogenous ligand, is sufficient to protect kidney function and morphology, and to prevent abnormalities in lipid metabolism associated with CP or I/R-induced AKI.
INTRODUCTION
Peroxisome proliferator-activated receptors (PPARs) are transcription factors belonging to the ligand-activated nuclear hormone receptor superfamily.1 Through heterodimerization with retinoid X receptor (RXR) and binding to the PPAR response elements (PPREs) in the promoter of target genes, PPARs have been shown to play critical roles in regulating pleiotropic biological process, including lipid and glucose metabolism, adipogenesis, immune response, and cell growth and differentiation.2, 3 There are three major subtypes: PPARα, PPARβ/δ, and PPARγ. PPARα is predominantly expressed in metabolically very active tissues, such as liver, heart, renal proximal tubular cells (kidney), skeletal muscle and brown fat.4, 5 Increased evidence suggests PPARα plays an important role in the regulation of energy homeostasis.6 PPARα activates fatty acid catabolism by induction of target genes encoding fatty acid oxidation (FAO) enzymes in mitochondria and peroxisomes, as well as proteins involved in cellular fatty acid import. In addition, PPARα also stimulates gluconeogenesis, ketone body synthesis, but also has significant anti-inflammatory activity that seems to play a protective role and suppress apoptosis.7 PPARα is a short-lived protein and is degraded by the ubiquitin-proteasome system. Its transcriptional activity is regulated by various factors at several levels. These include the regulation of its expression and stability, the nature and the level of endogenous or synthetic ligand, the coactivator and corepressor proteins, and post-translational modifications of PPARα and associated activator and repressor.
PPARα is highly expressed in the kidney, predominantly in the proximal tubule and in medullary thick ascending limb of Henle. Fatty acids constitute a major source of metabolic fuel for energy production in kidney cortex tissue and activation of PPARα by various ligands can induce the expression of genes involved in control of renal fatty acid β-oxidation. In previous studies we have observed that the inhibition of peroxisomal and mitochondrial FAO enzymes in kidney tissue of mice undergoing ischemia reperfusion (I/R), and cisplatin (CP)-induced acute kidney injury (AKI) results from reduced transcriptional activity of PPARα.8-14 Failure to oxidize long chain fatty acids and long chain acylcarnitines during AKI, results in their accumulation and cellular toxicity which further contributes to proximal tubule cell death.8, 9 We also documented that the administration of fibrate, a known PPARα ligand, prior to AKI 1) prevented the inhibition of FAO, and the accumulation of non-esterified fatty acids and triglyceride in kidney tissue, and 2) that fibrates ameliorated apoptotic and necrotic proximal tubule cell death, resulting in significant protection of renal function only in PPARα wild type mice, and not in PPARα null mice.11-15 Altogether, these observations would suggest a critical role for PPARα in regulating fatty acid β-oxidation in kidney tissue that directly correlates with preservation of kidney morphology and function during CP and I/R-induced AKI. To further investigate the physiologic role of PPARα in kidney, and to determine whether up-regulation of PPARα expression alone without the use of a synthetic ligand is sufficient to activate FAO in kidney and ameliorate renal function from CP or I/R-induced AKI, we generated transgenic mice that express mouse PPARα under the control of kidney androgen-induced protein (KAP2) promoter, which is androgen responsive. This promoter has been used with success to generate mice that exhibit proximal tubule and androgen-specific expression of human rennin.16 More recently KAP2 promoter was used to develop transgenic mice that express proximal tubule-specific Cre recombinase activity.17 In our KAP2-PPARα transgenic mice reported here, renal PPARα expression was detectable in proximal tubules of female transgenic mice, and could be induced by testosterone treatment. In comparison with wild-type mice, without synthetic ligand, up-regulation of PPARα expression by testosterone treatment in the KAP2-PPARα female transgenic mice prevented CP and I/R-induced inhibition of FAO and protected kidney function and morphology from CP or I/R-induced AKI.
RESULTS
Generation and characterization of the KAP2-PPARα transgenic mice
KAP2-PPARα transgenic mice were generated to produce a tissue specific and androgen-inducible expression of mouse PPARα in the proximal tubules of the kidney. Three founder transgenic lines were obtained and all transmitted the KAP2-PPARα transgene to their progeny. Transgene expression was evaluated in kidney, liver, heart and brain tissues. Of the three founder transgenic lines (#560, #561, and #562), all three lines were shown to express the transgene in the kidney by RT-PCR and real time RT-PCR analysis. The highest level of KAP2-PPARα transgene expression was observed with line 562, therefore the studies presented in this study were performed in line 562. However, analogous results were obtained with line 561. As shown in Figure 1A, transgene FLAG-PPARα mRNA was only detected in the kidney of KAP2-PPARα transgenic mice. In addition, when KAP2-PPARα Tg mice were given testosterone the expression of FLAG-PPARα was increased only in kidney but not on heart, liver, or brain tissue of KAP2-PPARα Tg mice as shown in Figure 1B. Since PPARα is normally expressed in heart, liver, and kidney tissue of wild type mice, we then performed real time RT-PCR analysis using total RNA isolated from kidney, heart, and liver tissues of wild type and Tg mice, and specific oligonucleotides to measure total PPARα mRNA levels (transgene+endogenous). As shown in Figure 1C, PPARα (transgene+endogenous) was increased about 2.4 fold only in kidney tissue of KAP2-PPARα Tg mice but not on the liver or heart tissue of KAP2-PPARα Tg mice. To assess the inducibility of the KAP2 promoter, Tg female mice from line 562 were implanted with a testosterone pellet. After 14 days the mice were sacrificed, and tissues were collected for further analysis of PPARα gene expression. When testosterone was given to either wild type or KAP2-PPARα Tg mice, PPARα expression was increased only in kidney but not on liver or heart tissue of KAP2-PPARα Tg mice. These results shown in Figure 1C, further support the specificity of the expression of KAP2-PPARα Tg mice in kidney tissue, as well as the inducibility of PPARα gene in kidney tissue when testosterone was given. The increased mRNA expression of PPARα in kidney tissue of KAP2-PPARα Tg mice was also correlated with increased protein levels of PPARα in kidney tissue. Our studies using anti-PPARα antibodies followed by immunoprecipitation and western blot analysis of kidney tissue obtained from KAP2-PPARα Tg mice demonstrated that testosterone induced a 3.5 -fold increase on PPARα protein levels (Figure 2).
Figure 1.


Tissue-specific induction of renal PPARα mRNA in female KAP2-PPARα transgenic mice by testosterone. A: Tissue-specific expression of Epitope (FLAG)-tagged PPARα (FPPARα). RT-PCR result of 5 μg total RNA from transgenic or wild-type female mice with specific primers to FLAG and PPARα. B: Induction of renal FLAG-tagged PPARα mRNA expression by testosterone. Total RNA was isolated from kidney, liver, heart and brain in the absence or presence of testosterone pretreatment. C. Quantitative real-time PCR of PPARα mRNA expression levels in wild-type and KAP2-PPARα transgenic mice. Bars represent mean ± SE mRNA levels for at least 4 samples in each group as determined by quantitative real time RT-PCR. Data are normalized against the housekeeping gene GAPDH.
Figure 2.


Testosterone induced PPARα protein expression in female KAP2-PPARα transgenic mice. A: A representative autoradiogram of one single experiment of Western blot analysis of immunoprecipitated PPARα from KAP2-PPARα transgenic mice kidney tissue. Immunoprecipitates (fractions F1, F2, F3) from mice kidney tissues with (+ testosterone) or without testosterone (- testosterone) treatment. B: Quantification of renal PPARα protein expression in the absence or presence of testosterone was done using kidney tissues of KAP2-PPARα transgenic mice. This figure represents a summary of three separate experiments. Bars represent means ± SE of three separate experiments.
Androgen induced PPARα in the kidney protects kidney function during cisplatin and ischemic induced ARI in KAP2-PPARα transgenic mice
To determine the role of increased expression and activity of PPARα protein in the kidney proximal tubule, kidney function was monitored by measuring serum BUN and creatinine for 2 days after single intraperitoneal injection of saline or CP. Figure 3A-B, presents the changes in BUN and serum creatinine seen in KAP2-PPARα transgenic or wild-type mice treated with saline or CP in the absence or presence of testosterone. Comparison of the renal function between wild-type mice pretreated with or without testosterone did not show differences in BUN and creatinine after saline injection (BUN 7.85 mM, 8.39 mM respectively, creatinine 23.76 μM, 22 μM respectively). Wild type mice developed significant AKI in both groups at day 2 after CP injection (BUN 100.35 mM, 94.59 mM respectively; creatinine 233.2 μM, 205.04 μM respectively). In contrast, KAP2-PPARα transgenic mice, pretreated with testosterone before CP administration, exhibited protection in renal function on day 2 (BUN 10.36 mM, creatinine 33.44 μM). However, KAP2-PPARα transgenic mice without testosterone pretreatment developed AKI at day 2 (BUN 94.15 mM, creatinine 193.6 μM) after CP injection. These observations suggest that the protective effect on renal function in KAP2-PPARα transgenic mice was dependent on testosterone mediated increased expression of proximal tubule PPARα. To investigate whether testosterone induced PPARα expression had a similar effect in protecting kidney function during acute ischemic renal failure; we used an I/R model in both wild type and KAP2-PPARα transgenic mice. As shown in Figure 3C-D, the serum BUN and creatinine levels were much higher in wild type mice (53.63 mM, 169.84 μM respectively) subjected to I/R injury when compared to KAP2-PPARα transgenic mice (13.99 mM, 49.28 μM respectively), which further supports our previous observations of amelioration of renal function by increasing the expression of proximal tubule PPARα prior to I/R injury.
Figure 3.


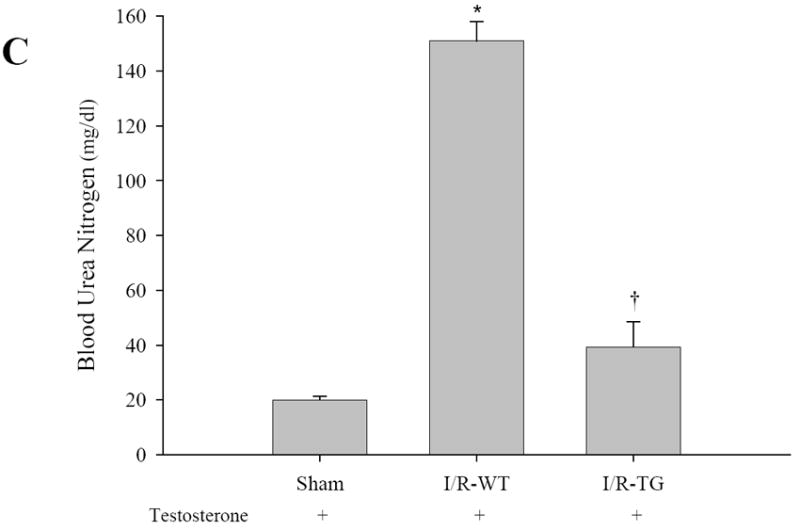
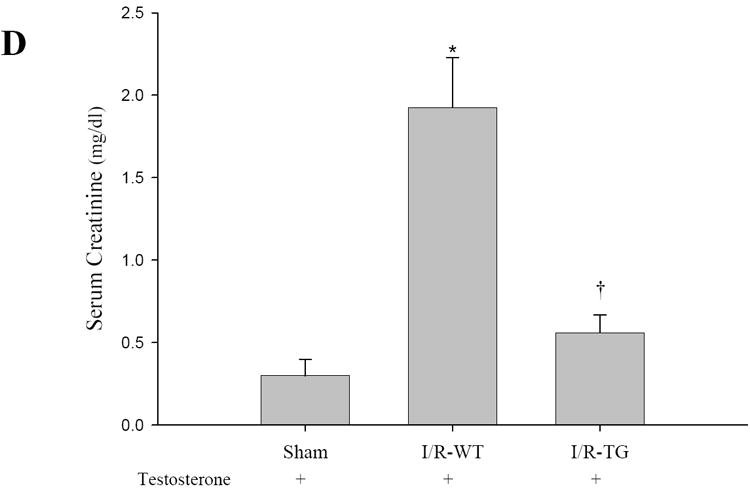
Effects of CP and I/R injury on n renal function: Pretreatment with testosterone prevented female KAP2-PPARα transgenic mice from cisplatin or I/R-induced AKI. Serum BUN (A, C) and creatinine (B, D) levels were measured at day 2 after cisplatin (Cisp) injection (A-B) in absence or in presence of 14-day testosterone pellet pretreatment or 24 hours after 50 minutes ischemia operation (C-D) in presence of 14-day testosterone pretreatment. Bars represent means ± SE of at least 4 independent experiments under each condition. * represents P < 0.05 compared with control (WT + saline without testosterone) or sham, † represents P < 0.05 compared with TG+cisp without testosterone pretreatment in unpaired Student’s t-test.
Kaplan-Meier survival curves
We have assessed survival time using the model of 50 min of ischemia followed by reperfusion injury. In this model serum blood urea nitrogen and creatinine were lower in our KAP2PPARalpha transgenic mice. at 24 hrs of reperfusion when compared to wild type mice as shown in Figures 3C and 3D. At 48 hrs of reperfusion serum BUN and serum creatinine were already improved in wild type mice when compared to sham-operated mice (results not shown). We did follow wild type and KAP2 PPARalpha transgenic mice for 5 days of reperfusion after 50 min of ischemia and we did not see an increase in mortality in wild type mice when compared to KAP2 PPARalpha transgenic mice. In contrast, in the model of cisplatin-mediated ARF we did see a significant improvement in survival rate in our KAP2 PPARalpha transgenic mice when compared to wild type mice. This data is shown in Figure 4. At 3 days after CP injection the survival rate in wild type mice was 60% when compared to 100% survival rate in KAP2 PPARalpha transgenic mice. At day 4 survival rate for wild type mice was only 28.6% when compared to 100% in KAP2 PPARalpha transgenic mice. At day 5 survival rate for wild type mice was 0% (all wild type mice were dead at day 5 after cisplatin injection) while the survival rate was reduced to 60% in KAP2 PPARalpha transgenic mice that received the same dose of cisplatin than the wild type mice (P = 0.00726). We subsequently followed KAP2 PPARalpha transgenic mice for 7 days after cisplatin injection, and the survival rate did not change and was still 60%. There was no mortality in the sham operated or saline treated control mice (data not shown). Based on these results we believe that the course of cisplatin-mediated ARF in our hands was more severe that the injury seen in ischemia-reperfusion injury, and we were able to establish significant differences in survival rate when comparing wild type mice that received testosterone and then cisplatin with KAP2 PPARalpha Tg mice that did also receive testosterone and then cisplatin. Based on these results we conclude that the observed increased survival rate in KAP2 PPARalpha Tg mice that received cisplatin and developed acute renal failure further supports a true protection against ARF.
Figure 4. Kaplan-Meier survival curve.

Comparison of the survival rate of WT and KAP2-PPARα transgenic mice after CP administration in the presence of testosterone pretreatment. Statistical significance was assessed by the log-rank test.
Immunolocalization of PPARα and morphologic alterations in kidney tissue
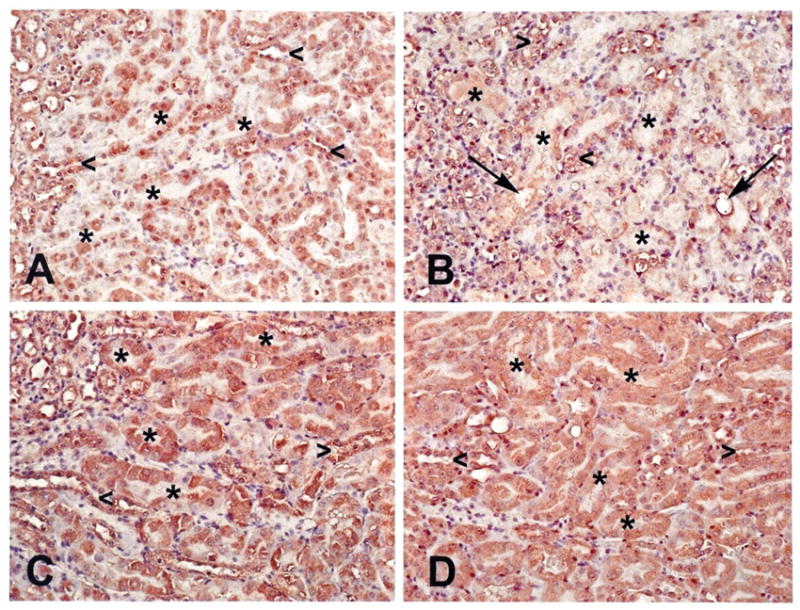
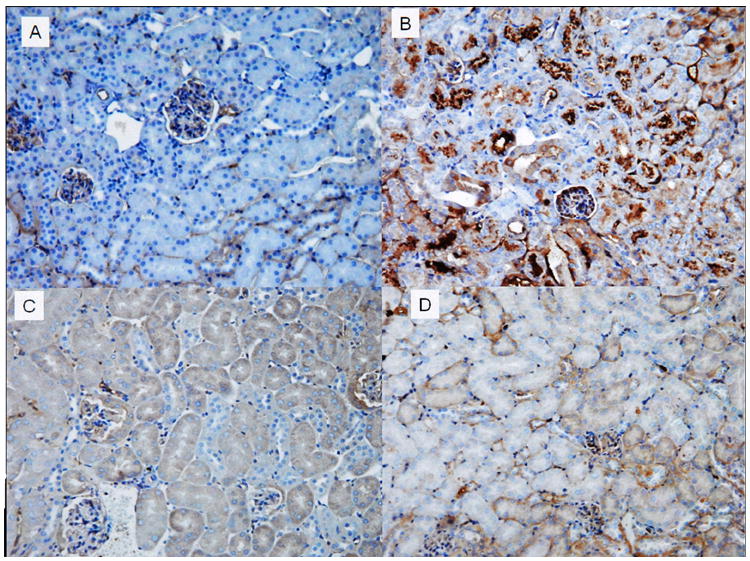
PPARα staining was primarily localized to the thick ascending limbs of loop of Henle and the early parts (S1 and S2 segments) of proximal tubules in untreated wild type animals. Also occasional positive staining with random nuclear appearance could be seen in the S3 segment of proximal tubules. PPARα staining was significantly decreased throughout the kidney 2 days after CP administration in these wild type mice (Figure 5A and 5B). In contrast, very strong diffuse staining pattern could be detected in the entire kidney cortex including the S3 segments of proximal tubules in untreated KAP2-PPARα transgenic mice after testosterone induction (Figure 5C). This positive staining remained unchanged in testosterone treated KAP2-PPARα transgenic mice 2 days after CP treatment (Figure 5D). Morphologic kidney damage was also markedly reduced in testosterone treated KAP2-PPARα transgenic mice 2 days after CP administration. Evaluation of the morphological differences (Figure 5B) showed small necrotic foci; severe degeneration accompanied by loss of brush border, tubular dilatation and cast formation in wild type mice. The analyzed parameters were significantly reduced in the KAP2-PPARα transgenic group and only mild degeneration and brush border loss could be detected in some areas of the kidney (Figure 5D) in KAP2 PPARα Tg mice treated with CP and testosterone. Similar results were also observed in the I/R-induced AKI model. The sham mouse kidneys in some instances exhibited very mild pathologic changes such as occasional loss of bush border, presence of few inflammatory cells (Figure 6A). All wild type mice undergoing ischemia/reperfusion injury had extensive tubular necrosis at the cortico-medullary junction (S3 segment of proximal tubules), loss off brush border, leukocyte infiltration, and numerous casts throughout the kidney (Figure 6B). In contrast testosterone induced PPARα transgenic ischemic kidney showed significantly improved morphology. They had only mild loss of brush border, tubular dilatation and only very few necrotic tubules were found occasionally in some kidney sections. There was only minimal leukocyte infiltrate and very few casts (Figure 6C).
Figure 5.
Immunolocalization of PPARα in the kidneys of untreated saline control (A) and CP-treated wild type (B) and testosterone induced untreated (C)and CP-treated PPARα transgenic mice (D), 2 days after CP administration. Immunostaining of kidney tissue using PPARα antibody in wild type mice showed only occasional positive staining in the S3 segment (A) that was significantly reduced in the CP-treated mice (B). Strong positive staining was detected after testosterone implantation in KAP2-PPARα transgenic mice in the S3 segment of proximal tubules (C), which remained unchanged after CP administration (D). (Asterisk: proximal tubules; arrow head: thick ascending loop of Henle; arrow: necrotic foci) Magnification: 250X.
Figure 6.

Comparison of morphologic damage in the cortico-medullary junction from control and ischemic kidneys taken 24 h after reperfusion. Representative photographs of Periodic acid-Schiff (PAS) stained sections of sham (A), testosterone pretreated wild type ischemia/reperfusion (B) and testosterone induced PPARα transgenic ischemia/reperfusion (C) mouse kidneys. The sham kidney shows normal kidney architecture (A) whereas extensive necrosis, loss of brush border, cast formation, inflammatory cells can be seen in a typical wild type ischemic kidney taken 24 h after reperfusion (B). A typical testosterone induced ischemic PPARα transgenic kidney (C) appeared to be almost normal. Only some loss of brush border, tubular dilatation and single, partially necrotic tubules could be seen occasionally. (Asterisk: proximal tubules; arrow head: thick ascending loop of Henle; arrow: necrotic foci, NT: necrotic tubule) Magnification: 125X.
The semi quantitative analysis of morphologic damages in CP-treated mice shown in Figure 7A demonstrated statistically significant changes in proximal tubule cell necrosis, and tubular degeneration when PPARα transgenic mice was induced with testosterone treatment. In the I/R model of AKI, as shown in Figure 7B, there were statistically significant changes in proximal tubule cell necrosis, cast formation, and tubular degeneration when PPARα was induced with testosterone treatment when compared to wild type mice subjected to I/R injury.
Figure 7.


Morphologic evaluation of cisplatin (CP) treated PPARα transgenic mouse kidneys with or without induction of the transgene with testosterone (A) or I/R-induced AKI (B). Bars represent means ± SE of kidney sections from at least 5 mice in each group. * represents P < 0.05 compared with control (TG + saline without testosterone) or sham, † represents P < 0.05 compared with TG+cisp without testosterone pretreatment or I/R-WT in unpaired Student’s t-test.
Inhibition of renal FAO by CP or I/R-induced AKI is prevented in KAP2-PPARα transgenic mice
To determine the mechanisms by which renal function was ameliorated in KAP2-PPARα Tg mice treated with CP, we examined the effects of CP and testosterone on the expression of PPARα target genes involved in renal FAO in both KAP2-PPARα transgenic and wild-type mice. As shown in Figure 8 and 9, the mRNA expression levels of medium chain acyl-Coenzyme A dehydrogenase (MCAD), Long Chain Acyl CoA-Dehydrogenase (LCAD), Very Long Chain Acyl CoA-Dehydrogenase (VLCAD) and L-Carnitine Palmytoyl Transferase-1 (L-CPT1) showed no significant changes (only 1.1-1.3 fold increase) in KAP2- PPARα transgenic mice when compared to levels in wild type mice. For both wild type and KAP2-PPARα transgenic mice, CP caused a significant decline (P < 0.05) in the mRNA expression of MCAD (85%, 76% respectively), LCAD (41%, 30% respectively), VLCAD (68%, 61% respectively), and L-CPT1 (79%, 62% respectively). Pretreatment with testosterone prevented CP-induced inhibition of renal FAO expression in KAP2-PPARα transgenic mice, but this effect was not observed in the wild-type mice. These results are similar to our previously published observations in which the use of PPARα ligands etomoxir and fibrates resulted in up-regulation of renal FAO during I/R and CP-induced AKI. Therefore, again these observations further support the cytoprotective role of PPARα on renal function during AKI and further underscore the importance of mitochondrial FAO on the preservation of structure and function of the proximal tubule during AKI. Since testosterone prevented CP-induced reduction of MCAD mRNA levels in the KAP2-PPARα transgenic mice but not in the wild-type mice, we next examined the effects of CP and testosterone on MCAD enzyme activity. As shown in Figure 8B, CP on day 2 caused a profound decline (P < 0.05) in the enzyme activity of renal MCAD in both wild-type and KAP2-PPARα transgenic mice (61%, 59% respectively). Pretreatment with testosterone prevented CP-induced inhibition of renal MCAD activity in KAP2-PPARα transgenic mice. In contrast to the effects of testosterone on KAP2-PPARα Tg mice, pretreatment with testosterone did not affect CP-induced reduction of MCAD activity in wild-type mice. Similar results were observed in I/R-induced AKI model, as shown in Figure 8C-D and Figure 9D. Pretreatment with testosterone prevented I/R-induced inhibition of renal FAO expression and MCAD activity in KAP2-PPARα transgenic mice, but not in the wild-type mice. These data indicate that the protective effect of testosterone on mRNA levels and activity of FAO enzyme MCAD were dependent on the activation of KAP2 promoter and the induction of PPARα expression in the proximal tubule of KAP2-PPARα Tg mice.
Figure 8.


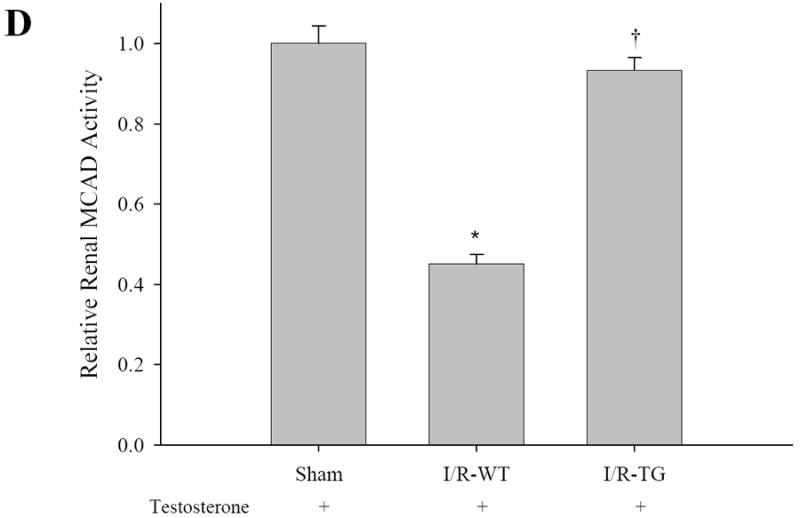
Pretreatment with testosterone prevented cisplatin or I/R-induced inhibition of renal MCAD mRNA expression (A, C) and enzyme activity of MCAD (B, D) in KAP2-PPARα transgenic mice. Wild-type (WT) or KAP2-PPARα transgenic mice (TG) female mice were administered cisplatin in the absence or presence of 14-day testosterone pretreatment or underwent 50 minutes ischemia operation in presence of 14-day testosterone pretreatment. A and C: Levels of Renal MCAD mRNA were determined by Quantitative real time RT-PCR. B and D: MCAD enzyme activity was determined as described in methods. Bars represent mean ± SE mRNA levels or MCAD enzyme activity for at least 4 mice in each group. * represents P < 0.05 compared with control (WT + saline without testosterone) or sham, † represents P < 0.05 compared with TG+cisp without testosterone pretreatment in unpaired Student’s t-test.
Figure 9.


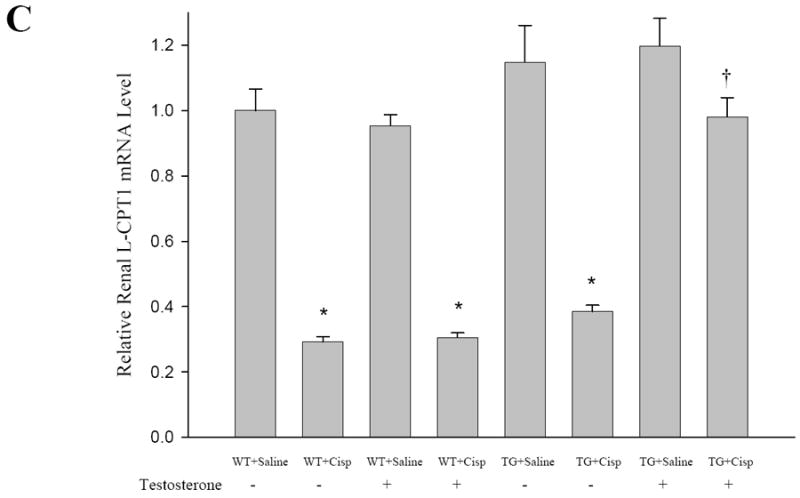
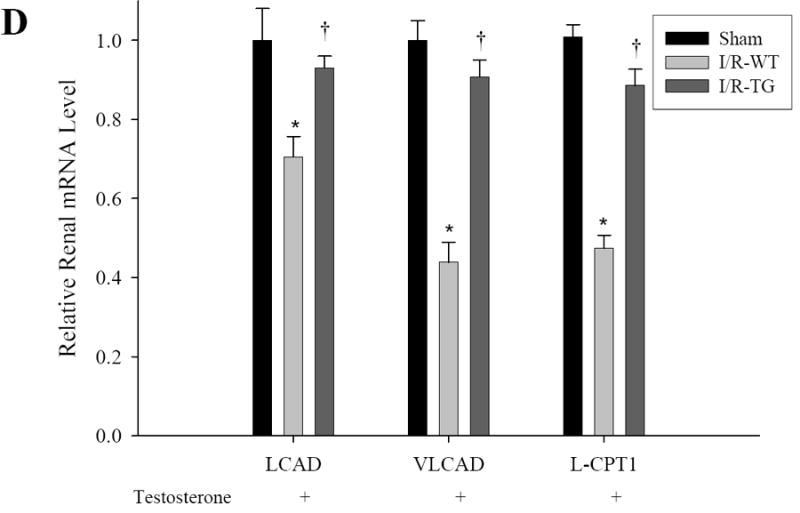
Effects of CP and I/R injury on fatty acid oxidation: Pretreatment with testosterone prevented CP (A-C) or I/R (D) induced inhibition of the mRNA levels of renal fatty acid oxidation-related genes LCAD, VLCAD and L-CPT1 in KAP2-PPARα transgenic mice. WT or KAP2-PPARα transgenic mice (TG) female mice were administered with CP in the absence or presence of 14-day testosterone pre-treatment or underwent 50 minutes ischemia operation in presence of 14-day testosterone pretreatment. Level of Renal LCAD, VLCAD and L-CPT1 were determined by quantitative real time RT-PCR. Bars represent mean ± SE mRNA levels for at least 4 mice in each group. *P < 0.05 compared with control (WT + saline without testosterone) or sham, † represents P < 0.05 compared with TG+cisp without testosterone pretreatment or I/R-WT in unpaired Student’s t-test.
Mitochondrial genes affected by CP in untreated and testosterone treated KAP2-PPARα transgenic mice
Microarray data analysis showed that CP treatment significantly reduced the expression of 454 (84%) of mitochondria-related genes with a false discovery rate of ≤ 0.05 in PPARα transgenic mice. A noteworthy observation was down-regulation of genes associated with oxidative phosphorylation (complexes I-V), mitochondrial DNA replication and repair, fatty acid metabolism, and Tricarboxylic acid (TCA) cycle (Supplemental Table 1 not shown). Interestingly however, pretreatment with testosterone of PPARα transgenic mice was protective against CP mediated inhibition of expression of mitochondria-related genes to the extent that the expression levels of the majority of mitochondrial genes inhibited by CP was almost restored to baseline levels (Figure 10 and Table 1B).
Figure 10.

(Volcano plot) Pretreatment with testosterone modulated the expression level of mitochondria-related genes that were down-regulated by CP in KAP2-PPARα transgenic mice. Red open circles indicate effect of CP in PPARα transgenic mice in absence of testosterone, and blue open circles indicate effect of CP in KAP2-PPARα transgenic mice pretreated with testosterone.
Table 1.
A. Real time PCR primers for analysis of mitochondria-associated gene expression
| Gene | Forward Primer | Reverse Primer |
|---|---|---|
| Ndufa7 | CCCAGTCACAAGCTGTCCAA | ACACCAGGGCCTTTTGTGAG |
| Mt-Nd4l | CCACATATGGAGGCATTGCT | GGCATGGGACTTAACAGGTG |
| Cox7b | GGTGGAGCCATCTTCTGTGT | CAGCTGGCACGACTACTGAT |
| Atp5b | ACCTCGGTGCAGGCTATCTA | GGATAGATGCCCAACTCAGC |
| Atp5j | TTCGGTCAGCAGTCTCTGTG | GCCTGTCGCTTTGATTTGTA |
| Polg | AAAGGCTCCTTGGAAAAACG | AAGCACATCTGAAAGCCTGAG |
| Aco2 | ACCACACCTTCAACGAGACC | GTCCAGAGTGGGTCAGGACA |
| Mfn1 | GTCAGCGGTGAAAGCAAAGT | AACCCTCTTCTCTGCTGCTG |
| Mfn2 | CTGTGCCAGCAAGTTGACAT | TTCCTGAGCAGTTTGGCTCT |
| B. Mitochondria-associated gene expression in line 562 KAP2-PPARα Tg mice | ||||
|
| ||||
| Gene | Saline | Cisplatin | Testosterone + Saline | Testosterone + Cisplatin |
| Ndufa7 | 1.000 ± 0.025 | 0.652 ± 0.023 * | 1.135 ± 0.045 | 0.926 ± 0.029 |
| Mt-Nd4l | 1.000 ± 0.011 | 0.681 ± 0.017 * | 1.054 ± 0.039 | 0.920 ± 0.054 |
| Cox7b | 1.000 ± 0.053 | 0.685 ± 0.024 * | 0.976 ± 0.022 | 0.911 ± 0.022 |
| Atp5b | 1.000 ± 0.017 | 0.667 ± 0.019 * | 1.046 ± 0.028 | 0.957 ± 0.040 |
| Atp5J | 1.000 ± 0.042 | 0.661 ± 0.016 * | 1.056 ± 0.045 | 0.926 ± 0.043 |
| Polg | 1.000 ± 0.022 | 0.634 ± 0.014 * | 1.086 ± 0.015 | 0.906 ± 0.037 |
| Aco2 | 1.000 ± 0.032 | 0.683 ± 0.034 * | 1.095 ± 0.084 | 1.011 ± 0.044 |
| Mfn1 | 1.000 ± 0.036 | 0.607 ± 0.005 * | 1.115 ± 0.090 | 1.053 ± 0.035 |
| Mfn2 | 1.000 ± 0.055 | 0.569 ± 0.014 * | 1.024 ± 0.029 | 0.894 ± 0.045 |
Values represent mean ± SE mRNA levels determined by quantitative real time RT-PCR for at least 4 mice in each group and normalized to that of control mice (= 1.0) (saline without testosterone).
P < 0.05 compared with control in unpaired Student’s t-test.
Volcano plot
To get a better insight into the effect of CP on expression levels of mitochondria-related genes in the presence and absence of testosterone in PPARα transgenic animals, microarray data from animals treated with CP and KAP2-PPARα Tg mice pre-administered testosterone followed by exposure to CP were presented in a volcano plot (Figure 10). Volcano plot is a graphic presentation of relative fold changes against false discovery rate for each gene evaluated. This allows a simultaneous intuitive assessment of the extent of fold changes and the significance associated with each gene in response to both treatments. A majority of mitochondria-related genes (84%) were down-regulated by CP treatment whereas pre-treatment with testosterone seemed to reverse CP-induced changes in expression levels of these genes (Supplemental Table 2 not shown). Supplemental tables 1 and 2 are not included in the main manuscript because of their large number of pages, however, can be made available upon request of the reviewers. As shown in Figure 10 there was a significant statistical difference in mitochondrial gene expression in kidney tissue of KAP2-PPARα Tg mice treated with CP in the absence of testosterone (red open circles) and kidney tissue of KAP2-PPARα Tg mice treated with testosterone (blue open circles) which further supports the protective effect of testosterone by increasing expression of mitochondrial genes that were downregulated by CP treatment, an effect associated with amelioration of renal function.
Effect of increased proximal tubule PPARα on AKI-mediated formation of lipid peroxidation products
Mouse kidney cortex tissue utilizes polyunsaturated fatty acids (PUFAs) as a source of energy production.18, 19 Lipid peroxidation of PUFAs leads to the formation of cytotoxic lipid-aldehyde species which includes 4-hydroxy-2-nonenal (4-HNE) and 4-hydroxy-2-hexenal (4-HHE), products derived from lipid peroxidation of n-6 and n-3 fatty acids, respectively.20 Previous studies have documented an increased formation of HHE in kidney tissue after ischemia reperfusion injury.21 In the present study we have used a primary monoclonal antibody against HHE to determine if lipid peroxidation product 4-HHE is affected by increased expression of proximal tubule PPARα in our KAP2-PPARα transgenic mice. Immunohistochemical staining using antibody against HHE-modified proteins showed that CP administration led to increased staining of cytoplasmic HHE in renal proximal tubular cells from transgenic mice without testosterone implantation. HHE staining was significantly reduced or almost absent in kidney tissue of KAP2-PPARα transgenic mice treated with testosterone and then CP (Figure 11). Western blot analysis using kidney tissue of CP or I/R-treated mice demonstrated also the increased formation of HHE-modified proteins as shown in Figure 12. CP or I/R injury led to 2.9 and 3.9-fold increase of the amount of renal HHE-modified protein respectively. Pretreatment with testosterone reduced CP and I/R injury induced renal HHE-modified protein in KAP2-PPARα transgenic mice when PPARα was induced.
Figure 11.
Immunohistochemical staining of HHE in kidney tissue of KAP2-PPARα transgenic mice. (A) Untreated saline control; (B) 2 days after CP administration; (C) Testosterone implantation with saline and (D) Testosterone implantation with CP administration. In CP-treated mice (B), more than half of the proximal tubules show acute injury with granular cytoplasmic and cast staining of HHE, whereas the HHE staining is virtually absent in kidney tissue of KAP2-PPARα transgenic mice treated with testosterone and CP (D). Magnification: 200X.
Figure 12.


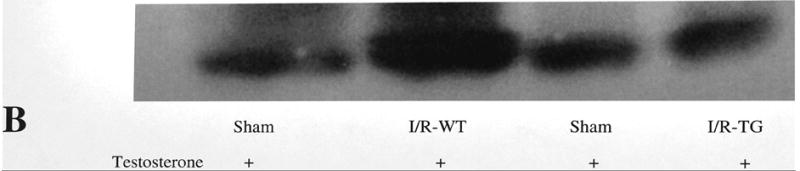
Western blot analysis of HHE-modified protein in CP-treated (A) and ischemia/reperfusion treated (B) mouse kidney. Representative autoradiogram is presented in upper panel. Histogram presents the relative amount of HHE-modified protein compared with control (saline) or sham. Bars represent mean±SE of three separate experiments. Figure 11A bottom panel shows the relative amounts of renal HHE in PPARa transgenic mice treated with cisplatin in the absence of testosterone.(* P < 0.05 comparing cisplatin with saline treated mice). In contrast PPARa transgenic mice treated with testosterone the amount of renal HHE was significantly reduced († represents P < 0.05 when PPARa Tg mice were given testosterone+ cisplatin compared to PPARa Tg mice that did not receive testosterone but received cisplatin.
Figure 11B bottom panel shows the amounts of renal HHE in wild type mice treated with testosterone and subjected to either sham or ischemia-reperfusion injury (I/R-WT). (*P < 0.05 comparing sham treated mice to I/R-treated mice). In contrast in PPARa transgenic mice treated with testosterone the amount of renal HHE was reduced when subjected to ischemia reperfusion injury (IR-TG). († represents P < 0.05 when comparing PPARa Tg mice that received testosterone and IR injury (I/R-TG) with wild type mice that also received testosterone prior to IR injury (IR-WT)
DISCUSSION
In our previous studies using fibrates and targeted disruption of the mouse PPARα gene we showed that fibrate-induced amelioration of renal function during acute kidney injury was the result of increased transcriptional activity of PPARα gene.8-15, 22-24 Other investigators have confirmed these observations about the renal protective effect of using fibrates in various animal models of acute renal failure.15,18 In the present study, we have developed and characterized transgenic mice expressing PPARα by driving expression of PPARα with a proximal tubule specific and androgen-regulated promoter,16, 17, 25, 26 to directly examine the cytoprotective effect of PPARα in kidney tissue. In these female KAP2-PPARα transgenic mice, testosterone induced the expression of PPARα in proximal tubule. We find that increased proximal tubule PPARα has a significant effect on ameliorating renal function in the models of ischemia reperfusion and CP mediated acute kidney injury. In addition, survival rate at day 5 after CP injection is significantly increased in KAP2 PPARα Tg mice that received CP when compared to wild type mice. Of importance, such an effect did not require the administration of an exogenous PPARα ligand like fibrate.
The findings in our KAP2 PPARα Tg mice are in contrast with the findings reported in a previously described transgenic mouse model (MHC-PPARα), in which PPARα was over-expressed (80-135 fold increase) in the postnatal heart driven by the α-myosin heavy chain promoter. In MHC-PPARα Tg mice fatty acid oxidation rates were increased and glucose uptake and metabolism were decreased leading to a metabolic phenotype that had remarkable similarities to diabetic heart.27, 28 In addition, older MHC-PPARα mice also exhibited features of diabetic cardiomyopathy, including activation of gene markers of pathologic hypertrophic growth and alterations in systolic an diastolic function.27 Unlike that study, the inducible and reversible expression of PPARα in kidney tissue controlled by androgen avoids the potential disadvantages caused by constitutive over-expression of PPARα in heart tissue. Therefore, we believe that when compared to the MHC-PPARα transgenic mice, the absence of phenotype in the KAP2-PPARα Tg mice could relate to the magnitude of increased expression of PPARα in kidney tissue, which corresponded only to a moderate (3.5 fold) over-expression of PPARα in kidney tissue when KAP2-PPARα Tg mice were treated with testosterone.
It is important to point out in our study, that using the two models of CP and I/R induced AKI, we find at least four independent but interrelated mechanisms that could account for the cytoprotective effects of increasing the expression of proximal tubule PPARα during AKI. We observed that CP and I/R-mediated reduced expression of mitochondrial FAO genes seen in wild type females or female transgenic mice not treated with testosterone pellet, was prevented when the expression of proximal tubule PPARα was increased with the use of testosterone. Testosterone by itself did not have any protective effect on renal function in wild type female mice. Therefore, our studies suggest that increased FAO in the proximal tubule by increased expression of PPARα represents an important mechanism by which renal function can be preserved in our KAP2-PPARα transgenic mice. A second mechanism that could explain why KAP2-PPARα Tg mice were protected during CP-mediated AKI was the observed increased expression of mitochondrial genes associated with oxidative phosphorylation (complexes I-V), mitochondrial DNA replication and repair, fatty acid metabolism, and Tricarboxylic acid (TCA) cycle as shown in table 1B. Those findings corroborate previous observations in fibrate-treated mice showing that PPARα directly modulates mitochondrial biogenesis and function 9, 29, 30 (Figure 10 and Table 1B).
A third mechanism by which increased expression of kidney tissue PPARα ameliorated AKI was a reduced formation of lipid peroxidation products. Lipid peroxidation products include hydroperoxides, aldehydes such as 4-HHE and 4-HNE, and polymeric materials. These lipid peroxidation products exert cytotoxic effects that could lead to apoptosis and proximal tubule cell death. There is increased evidence indicating the involvement of lipid peroxidation products in various disorders and diseases.31-35 Various biomarkers for lipid peroxidation have been proposed. 20, 36 HHE is a reactive byproduct derived from lipid peroxidation of n-3 fatty acids such as eicosapentaenoic and docosahexaenoic acids,20, 36 and is one of the most reliable and sensitive biomarkers of lipid peroxidation. Antibodies against HHE-modified proteins have been used to detect lipid peroxidation products in renal ischemia/reperfusion injury in rat kidney,21 in pancreatic tissues of rats with spontaneous pancreatitis,37 in light-induced retinal damage in rat retina,38 and in the biological fluids of patients with asthma and chronic obstructive pulmonary disease.39 HHE can cause mitochondrial dysfunction by enhancing calcium-mediated induction of the mitochondrial permeability transition and by inhibition of the mitochondria ATP translocator. 40, 41 HHE also was demonstrated to induce apoptosis through inducing apoptotic Bax coupled with a decrease in anti-apoptotic Bcl-2.42, 43 In addition, HHE can stimulate inducible nitric oxide synthase in the endothelium through NF-kappaB activation, which can lead to vascular dysfunction by the activation of various genes that modulate the inflammatory responses.44 Our findings showing increased staining of HHE related products in kidney cortex tissue of CP-treated mice and the absence of HHE derived lipid peroxidation products in KAP2-PPARa Tg mice treated with testosterone and CP suggest that HHE might play a key role in the pathophysiological process of CP-mediated proximal tubule cell death. In addition, we find by western blot analysis that CP or I/R-induced expression of HHE-modified protein was also reduced in KAP2-PPARα Tg mice that received testosterone. Therefore, increased expression of proximal tubule PPARα reduces the formation and /or scavenging of HHE which attenuates or prevent AKI-mediated oxidative stress, thereby ameliorating the subsequent renal injury. The fourth mechanism by which increased PPARα expression ameliorates kidney function in KAP2-PPARα Tg mice treated with CP or I/R and testosterone is the observed reduction in necrosis of the S3 segment of the proximal tubule as shown in Figure 5-7. Although the use of clearance techniques may better quantify the improvement in renal function described in our PPARalpha transgenic mice, we believe that as both serum creatinine and renal histology improve, the conclusion that the animals were protected seems firmly established.
Altogether, our study advances our knowledge regarding the physiologic role of PPARα in the kidney, and lends support to the notion that an intact function of proximal tubule PPARα is important to maintain cell viability during AKI. Our findings also suggest that proximal tubule PPARα directly modulates long chain fatty acid oxidation, regulates mitochondrial function, and prevents lipid peroxidation leading to a significant reduction in acute tubular necrosis of the proximal tubule during AKI. We believe that in addition to these proposed mechanisms, additional ones are likely to account for our observation that increased expression of PPARα in the proximal tubule results in prevention of acute tubular necrosis in the S3 segment of the proximal tubule in the models of CP and I/R injury to the kidney. For example, we believe that the observed reduction in PPARα activity in kidney tissue of mice with AKI could have similar effects to the ones seen in PPARα null mice. In those mice, the absence of PPARα was shown to be associated with reduced FAO in the proximal tubule, but also led to abnormal lysosomal biogenesis and reduced endocytosis of albumin in the proximal tubule 22, 24 In future studies we plan to isolate proximal tubules derived from KAP2-PPARα transgenic mice to further define the cellular mechanisms by which increased expression of proximal tubule PPARα modulates mitochondrial function and endocytosis resulting in prevention of proximal tubule cell death.
MATERIALS AND METHODS
Transgene construction and generation of transgenic mice
Epitope (FLAG)-tagged PPARα under control of the renal proximal tubule cell-specific and androgen-responsive promoter from the kidney androgen-regulated protein (KAP) gene was constructed from pGAL4FLAGPPARα (gift from Dr. Daniel Kelly, Washington University, St. Louis, MO) and pKAP2 (gift from Dr. Curt Sigmund, University of Iowa, Iowa City, IA). pKAP2 contains the KAP promoter driving expression of exons 2-5 of the human angiotensin (HAGT) gene (including introns and 3’ UR sequences). 44 The 1437 bp BamHI, Not I fragment of pGAL4 PPARα encoding N-terminal FLAG-tagged PPARα was ligated into BglII-, NotI-cleaved pKAP2. The resulting construct, pKAP2-FLAG-PPARα, contains 1542 bp of the KAP gene promoter immediately upstream of FLAG-PPARα followed by exons 3-5 and 3’ UT sequences of HAGT. The unique AatII and AgeI sites in pKAP2-FLAG-PPARα were utilized to liberate an 11,316 bp fragment containing the KAP promoter, FLAG-PPARα, and all HAGT sequences from essentially all vector sequences and was gel purified using Qiagen gel extraction columns per instructions by the supplier (Qiagen, Valencia, CA). Following ethanol precipitation, the fragment was resuspended in injection buffer to a final concentration of 2μg/ml and used to microinject fertilized single-cell mouse embryos. Pups were screened for the presence of the KAP2-FLAG-PPARα transgene by PCR using tail DNA as template and primers corresponding to the KAP promoter (KPTg forward, 5′-CCAACTGTGGAAAACCACCT-3’) and PPARα (KPTg reverse, 5’-GTGGGGAGAGAGGACAGATG-3’) sequences. Three founder lines (#560, #561, and #562) were identified from a total of 36 pups generated. The experiments described in the current study were done using mice corresponding to founder line #562.
Mice used for these experiments were 15–20 wk of age. Wild-type age- and sex-matched mice were used as controls in the studies described herein. Only female mice were used for experiments. There was no difference in baseline weight in a comparison of transgenic to wild-type mice. Mice were housed in a temperature- and light-controlled environment and provided food and water. To investigate the effects of PPARα induction, wild-type and KAP2-PPARα transgenic female mice were treated with testosterone by the subcutaneous administration of a 5-mg testosterone pellet designed for continuous release for 21 days (Innovative Research of American, Sarasota, FL). Blood urea nitrogen (BUN) and creatinine were measured by an enzymatic assay as previously described.8 All experimental procedures were approved by the Animal Care and Use Committee of the Central Arkansas Veterans Health Care System (Little Rock, AR) and were in accordance with the National Institutes of Health and American Physiological Society’s Guiding Principles in the Care and Use of Laboratory Animals.
In Vivo model of cisplatin-induced AKI
KAP2-PPARα transgenic mice and wild-type mice, 15–20 wk old, were assigned to treatment groups. Animals received single intraperitoneal doses of saline (control) or CP (20 mg/kg body weight). After treatment, the animals were sacrificed. Blood was collected for determining blood urea nitrogen (BUN) and creatinine and testosterone concentration in serum. Tissues were harvested and frozen in liquid nitrogen for RNA or protein isolation. For histopathological evaluation, kidneys were collected in 10% neutral buffered formalin.
In Vivo model of Ischemic/Reperfusion-induced AKI
Ischemia was induced in anesthetized (sodium pentobarbital, 50 mg/kg, IP) female mice by exposure of the kidneys under sterile conditions through a midline incision. The kidneys were decapsulated and both renal hila were clamped with small vascular clamps for 50 minutes and released. Sham operations were also performed in which the kidneys were manipulated as described, without induction of ischemia. After surgery, the animals were returned to their cages and allowed free access to food and water. Mice were sacrificed 24 hrs after ischemia. Blood was collected for determining BUN and creatinine and testosterone concentration in serum.
Survival after ischemia reperfusion or CP-induced AKI
The comparison of survival rate of WT and KAP2-PPARα transgenic mice after both groups were treated with Testosterone pellet before AKI was induced was done by the Kaplan and Meier method. Statistical significance was assessed by the log-rank test.
Analysis of gene expression by real time RT-PCR
Total RNA was extracted with TRIzol Reagent (Invitrogen, Carlsbad, CA) from both wild-type and transgenic mice (line 562) with or with testosterone pellet following saline or cisplatin intraperitoneal injection. Total RNA extract was treated with 1 U of RQ1 RNase-free DNase per microgram of total RNA, at 37°C for 1 h before Reverse transcription (RT) reaction. RT was performed at 42°C for 50 min in a total volume of 20 μl containing 1 μg RNA, 0.5 μg of oligo (dT)12-18, and 200 U of superscript II RNase H− reverse transcriptase. Subsequently, reverse transcriptase was inactivated by incubation at 70°C for 15 min, followed by treatment with RNase H at 37°C for 30 min. Real-time PCR was performed using a DNA Engine OPTICON 2 continuous fluorescence detector (MJ Research, Inc, Waltham, MA) with SYBR Green I technology. In each experiment, triplicates of 50 ng cDNA (total RNA equivalent) of samples were amplified in a 50 μl reaction containing 1× iQ™ SYBR Green Supermix (Bio-Rad, Hercules, CA). The real-time PCR conditions are: 1 cycle at 50°C for 2 min followed by 1 cycle at 95°C (10 min); 40 cycles at 95°C (15 s), 61°C (25 s), and 72°C (16 s). Specificity of the amplified product was confirmed by melting curve analysis. For relative quantification, a standard curve was generated from a six-step cDNA dilution series. Samples were amplified with primers for PPARα, medium chain acyl-Coenzyme A dehydrogenase (MCAD), long chain acyl-Coenzyme A dehydrogenase (LCAD), very-long-chain acyl-CoA dehydrogenase (VLCAD), liver carnitine palmitoyltransferase 1 (L-CPT1) and Glyceraldehyde-3-phosphate dehydrogenase (GAPDH). The relative expression of PPARα, MCAD, LCAD, L-CPT1 and GAPDH were calculated from the standard curve. Relative quantity was calculated by the ratio of the gene-specific and the appropriate GAPDH expression. The primer sequences in the real time RT-PCR were for PPARα 5′-AAAGAGGCAGAGGTCCGATT-3′ (forward), 5′-AGCAAGGTGACTTGGTCGTT-3′ (reverse); MCAD 5′-TGCCCTGGATAGGAAGACAT-3′ (forward), 5′-AGCGAGTTCAACCTTCATCG-3′ (reverse); LCAD 5′-TCTTTTCCTCGGAGCATGAC-3′ (forward), 5′-TCCAGCTTTCTCCCATTCTG-3′ (reverse); VLCAD 5′-AGGTGGAGGACGACACTTTG-3′ (forward), 5′-TCTCTGCCAAGCGAGCATAC-3′ (reverse), L-CPT1 5′-GATGTGGACCTGCATTCCTT-3′ (forward), 5′-TCCTTGTAATGTGCGAGCTG-3′ (reverse); and GAPDH 5′-CACTCTTCCACCTTCGATGC-3′ (forward), 5′-CCCTGTTGCTGTAGCCGTAT-3′ (reverse). To assess transgene expression in different tissue, RT-PCR was performed with FLAG specific primer 5′-GGATTACAAGGATGACGACGATAAG-3′ (forward) and PPARα 5′-specific primer TACACCAGCTTCAGCCGAATAGTTC-3 (reverse)
Assessment of the expression of mitochondria-associated genes by a mitochondria-specific microarray (MitoChip) and validation of microarray results by real time PCR
MitoChip is an oligonucleotide microarray developed at the National Center for Toxicological Research (NCTR). It consists of 542 genes that are associated with mitochondrial structure and functions and are encoded by both nuclear and mitochondrial genomes. The expression level of mitochondria-associated genes in the kidney of line 562 transgenic mice under 4 conditions (saline, CP, testosterone + saline, and testosterone + CP) was measured using MitoChip as described previously.45 Also, the expression level of significantly altered genes was confirmed using real-time PCR. A set of genes selected for validation included NADH dehydrogenase (ubiquinone) 1 alpha subcomplex 7 (Ndufa7), mitochondrial NADH- ubiquinone oxidoreductase chain 4L (mt-Nd4l), cytochrome c oxidase subunit VIIb (Cox7b), ATP synthase H+ transporting mitochondrial F1 complex beta subunit (Atp5b), ATP synthase H+ transporting mitochondrial F0 complex subunit F (Atp5j), aconitase 2 (Aco2), mitofusin 1 (Mfn1), and mitofusin 2 (Mfn2). The primer sequences for the real time PCR are shown in table 1A.
Statistical analysis of microarray data
The expression level of each gene in a sample was calculated by the average log2 ratio of the sample fluorescence intensity (Cy5) to reference intensity (Cy3) from two arrays printed on each slide. Universal Mouse Reference RNA was used as a reference on each array during hybridization. Average expression level of housekeeping genes and Arabidopsis genes on the array was used as a normalizing covariate. The effects associated with CP, testosterone and their interactions were evaluated under a fixed effect linear model. Analyses were carried out using the GLM procedure of SAS 8.2 (SAS Institute Inc., SAS/STAT, User’s guide, Cary, NC). The fold change in expression of each gene in samples exposed to CP was calculated by the ratio of the average of least squares means of expression level in the treatments of CP and CP + testosterone to the average of least squares means of expression level in the treatments of saline and saline + testosterone. The fold change of CP effect in presence of testosterone was calculated by the ratio of the least squares mean of expression levels of samples treated with CP + testosterone to the least squares mean of expression levels of samples treated with saline + testosterone, whereas the fold change of CP effect in absence of testosterone was calculated in the same way using the data from the samples treated with CP and saline. The interaction is the ratio of the fold change of CP effect in presence of testosterone to the fold change of CP effect in absence of testosterone. The results were further classified into different molecular functions or biological processes (Gene Ontologies) using the database from the Mouse Genome Informatics web site (www.informatics.jax.org). The overall treatment effect on expression level of a group of genes was tested using a modified meta-analysis method for combining p values.
Immunoprecipitation
Immunoprecipitation was carried out according to manufactures instructions, using Seize X Protein G Immunoprecipitation Kit (Pierce, Rockford, IL). PPAR polyclonal antibody (Santacruz, Santa Cruz, CA) was immobilized with Protein G gel using the cross-linker DSS. 3 mg of kidney tissue protein extract form the mice either treated with testosterone or no testosterone was used for the immunoprecipitation. The antigen bound to antibody-protein G gel was eluted using a primary amine elution buffer (pH 2.8) as fractions. Each fraction was the separated on SDS-PAGE and immunoblotting was performed using a dilution of 1:1000 PPARα monoclonal antibodies (Affinity bioreagents, Golden, CO).
MCAD activity analysis
MCAD activity assay was performed in kidney tissue extracts following protocol previously described by Lehman et al.46 with minor modifications. Kidneys were homogenized in cold 100 mM HEPES with 0.1 mM EDTA (pH 7.6). The homogenates were then centrifuged briefly at 4°C and the MCAD activity was measured immediately on the supernatant at 37°C. Two microliters of supernatant were added to 200 μl of reaction solution of 100 mM HEPES buffer (pH 7.6), 0.1 mM EDTA, 200 μM ferricenium hexafluorophosphate, 0.5 mM sodium tetrathionate, and 50 μM octanoyl-CoA. The absorbance decrease at 300 nm in the ferricenium ion was determined by SPECTRAmax microplate spectrophotometer (Molecular Devices, Sunnyvale, CA) over the initial 60 second period. The values were corrected by subtracting the background absorbance of a tissue blank, measured in the absence of octanoyl-CoA in the reaction solution. Results are presented as means ± SE of MCAD activity relative to that obtained for control mice, which was set arbitrary as 100% in each experiment and was calculated from at least four independent experiments.
Immunohistochemistry and histopathology
Immunohistochemical staining was performed on paraffin-embedded tissue sections from wild type and PPARα transgenic untreated and CP- treated mice as well as testosterone induced untreated and CP- treated PPARα transgenic mice using a monoclonal PPARα antibody (Affinity Bioreagents, Golden, CO) or monoclonal antibody against 4-hydroxy-2-hexenal (HHE)-modified protein (NOF Corp, Tokyo, Japan). The biotinylated anti mouse antibody was visualized using the ABC Vectastain Kit (Vector Laboratories, Burlingame, CA). We evaluated histopathological alterations in the kidneys 2 days after the mice were treated with saline or cisplatin, or 24 hrs after ischemia/reperfusion injury. Kidneys were removed, fixed in 10% neutral buffered formalin, dehydrated with serial alcohols, and embedded in paraffin. We stained 3-μm-thick paraffin sections with hematoxylin and eosin and the periodic acid-Schiff (PAS) method.47 To evaluate morphological damage to the kidney after CP injection the following parameters were graded on a scale from 0 to 4 as described previously.48 tubular necrosis, loss of brush border, tubular degeneration, cast formation, presence of neutrophils, edema, red blood cell extravasation and distal damage.
Western blot analysis
Kidney tissue was homogenized in lysis buffer (50 mM Tris (pH 7.4), 100 mM NaCl, 2.5 mM ethylenediaminetetraacetic acid, 1% Triton X-100, 0.5% NP-40, 2.5mM Na3VO4, 1 mM phenylmethylsulfonyl fluoride, 25μg/ml aprotinin and leupeptin, and 50μg/ml Soybean trypsin inhibitor) and sonicated briefly for 10s subsequently centrifuged at 11,000g for 10min at 4 C°, and the supernatant was collected. Supernatants containing 50μg of protein were separated on a 12% sodium dodecylsulfate-polyacrylamide gel electrophoresis and then electroblotted to a nitrocellulose membrane. The membrane was blocked for 1h with 5% nonfat dried milk in TBS-T buffer (20 mM Tris, pH 7.6, 100 mM NaCl, 0.1% Tween 20). Western blot was performed using monoclonal antibody to HHE (NOF Corporation, Tokyo, Japan) at 1:1000 dilution and membranes were incubated overnight in TBS-T buffer containing 5% nonfat dried milk at room temperature. After washing three times with TBS-T buffer, the membranes were incubated with a horseradish peroxidase-conjugated goat anti-rabbit IgG as a second antibody (1:5,000 dilution) for 1h at room temperature. Proteins were visualized using by enzyme-linked enhanced chemiluminescence (Amersham, Arlington Heights, IL). Signals on the blots were visualized by autoradiography and quantitated by densitometry using ImageQuant image analysis system (Molecular Dynamics, Sunnyvale, CA).
Supplementary Material
Acknowledgments
The views presented in this article do not necessarily reflect those of the US Food and Drug Administration. This work was supported by NIH/NIDDK RO1 DK075976 and a VA Merit Award to Dr Didier Portilla. We acknowledge Dr Curtis Sigmund for providing the KAP2 construct and to Dr C. Obrien and the Transgenic Mouse Facility at UAMS for their technical help with the generation of KAP2-PPARα transgenic mice. We also acknowledge Dr Neriman Gokden for her assistance with HHE staining.
Footnotes
DISCLOSURES None.
References
- 1.Issemann I, Green S. Activation of a member of the steroid hormone receptor superfamily by peroxisome proliferators. Nature. 1990;347:645–650. doi: 10.1038/347645a0. [DOI] [PubMed] [Google Scholar]
- 2.Guan Y. Peroxisome proliferator-activated receptor family and its relationship to renal complications of the metabolic syndrome. J Am Soc Nephrol. 2004;15:2801–2815. doi: 10.1097/01.ASN.0000139067.83419.46. [DOI] [PubMed] [Google Scholar]
- 3.Shearer BG, Hoekstra WJ. Recent advances in peroxisome proliferator-activated receptor science. Curr Med Chem. 2003;10:267–280. doi: 10.2174/0929867033368295. [DOI] [PubMed] [Google Scholar]
- 4.Kliewer SA, Forman BM, Blumberg B, et al. Differential expression and activation of a family of murine peroxisome proliferators-activated receptors. Proc Natl Acad Sci USA. 1994;91:7355–7359. doi: 10.1073/pnas.91.15.7355. [DOI] [PMC free article] [PubMed] [Google Scholar]
- 5.Smirnov AN. Nuclear receptors: nomenclature, ligands, mechanisms of their effects on gene expression. Biochemistry. 2002;67:957–977. doi: 10.1023/a:1020545200302. [DOI] [PubMed] [Google Scholar]
- 6.Lefebvre P, Chinetti G, Fruchart JC, et al. Sorting out the roles of PPAR alpha in energy metabolism and vascular homeostasis. J Clin Invest. 2006;116:571–580. doi: 10.1172/JCI27989. [DOI] [PMC free article] [PubMed] [Google Scholar]
- 7.Roberts RA, Chevalier S, Hasmall SC, et al. PPARα and the regulation of cell division and apoptosis. Toxicology. 2002;182:167–170. doi: 10.1016/s0300-483x(02)00275-5. [DOI] [PubMed] [Google Scholar]
- 8.Portilla D, Dai G, Peters JM, et al. Etomoxir- induced PPARalpha-modulated enzymes protect during acute renal failure. Am J Physiol Renal Physiol. 2000;278:F667–675. doi: 10.1152/ajprenal.2000.278.4.F667. [DOI] [PubMed] [Google Scholar]
- 9.Portilla D, Dai G, McClure T, et al. Alterations of PPARalpha and its coactivator PGC-1 in cisplatin-induced acute renal failure. Kidney Int. 2002;62:1208–1218. doi: 10.1111/j.1523-1755.2002.kid553.x. [DOI] [PubMed] [Google Scholar]
- 10.Li S, Wu P, Yarlagadda P, et al. PPARα ligand protects during cisplatin-induced acute renal failure by preventing inhibition of renal FAO and PDC activity. Am J Physiol Renal Physiol. 2004;286:F572–F580. doi: 10.1152/ajprenal.00190.2003. [DOI] [PubMed] [Google Scholar]
- 11.Portilla D. Energy metabolism and cytotoxicity. Semin Nephrol. 2003;23:432–438. doi: 10.1016/s0270-9295(03)00088-3. [DOI] [PubMed] [Google Scholar]
- 12.Li S, Basnakian A, Bhatt R, et al. PPAR-alpha ligand ameliorates acute renal failure by reducing cisplatin-induced increased expression of renal endonuclease G. Am J Physiol Renal Physiol. 2004;287:F990–F998. doi: 10.1152/ajprenal.00206.2004. [DOI] [PubMed] [Google Scholar]
- 13.Li S, Gokden N, Okusa MD, et al. Anti-inflammatory effect of fibrate protects from cisplatin-induced ARF. Am J Physiol Renal Physiol. 2005;289:F469–480. doi: 10.1152/ajprenal.00038.2005. [DOI] [PubMed] [Google Scholar]
- 14.Nagothu KK, Bhatt R, Kaushal GP, et al. Fibrate prevents cisplatin-induced proximal tubule cell death. Kidney Int. 2005;68:2680–2693. doi: 10.1111/j.1523-1755.2005.00739.x. [DOI] [PubMed] [Google Scholar]
- 15.Negishi K, Noiri E, Sugaya T, et al. A role of liver fatty acid-binding protein in cisplatin-induced acute renal failure. Kidney Int. 2007;72:348–358. doi: 10.1038/sj.ki.5002304. [DOI] [PubMed] [Google Scholar]
- 16.Lavoie JL, Lake-Bruse KD, et al. Increased blood pressure in transgenic mice expressing both human renin and angiotensinogen in the renal proximal tubule. Am J Physiol Renal Physiol. 2004;286:F965–971. doi: 10.1152/ajprenal.00402.2003. [DOI] [PubMed] [Google Scholar]
- 17.Li H, Zhou X, Davis DR, et al. An androgen-inducible proximal tubule-specific Cre-recombinase transgenic model. Am J Physiol Renal Physiol. 2008;294:F1481–1486. doi: 10.1152/ajprenal.00064.2008. [DOI] [PMC free article] [PubMed] [Google Scholar]
- 18.Wirthensohn G, Guder WG. Renal lipid metabolism. Miner Electrolyte Metab. 1983;9:203–211. [PubMed] [Google Scholar]
- 19.Le Hir M, Dubach UC. Peroxisomal and mitochondrial beta-oxidation in the rat kidney: distribution of fatty acyl-coenzyme A oxidase and 3-hydroxyacyl-coenzyme A dehydrogenase activities along the nephron. J Histochem Cytochem. 1982;30:441–444. doi: 10.1177/30.5.7200500. [DOI] [PubMed] [Google Scholar]
- 20.Catala A. Lipid peroxidation of membrane phospholipids generates hydroxy-alkenals and oxidized phospholipids active in physiological and/or pathological conditions. Chem Phys Lipids. 2008 Oct 14; doi: 10.1016/j.chemphyslip.2008.09.004. Epub ahead of print. [DOI] [PubMed] [Google Scholar]
- 21.Doi K, Suzuki Y, Nakao A, et al. Radical scavenger edaravone developed for clinical use ameliorates ischemia/reperfusion injury in rat kidney. Kidney Int. 2004;65:1714–1723. doi: 10.1111/j.1523-1755.2004.00567.x. [DOI] [PubMed] [Google Scholar]
- 22.Kamijo Y, Hora K, Tanaka N, et al. Identification of functions of peroxisome proliferator-activated receptor alpha in proximal tubules. J Am Soc Nephrol. 2002;13:1691–702. doi: 10.1097/01.asn.0000018403.61042.56. [DOI] [PubMed] [Google Scholar]
- 23.Patel NS, di Paola R, Mazzon E, et al. Peroxisome-proliferator activated receptor-{alpha} contributes to the resolution of inflammation following renal ischemia/reperfusion injury. J Pharmacol Exp Ther. 2008 Nov 7; doi: 10.1124/jpet.108.146191. Epub ahead of print. [DOI] [PubMed] [Google Scholar]
- 24.Aoyama T, Peters JM, Iritani N, et al. Altered constitutive expression of fatty acid-metabolizing enzymes in mice lacking the peroxisome proliferator-activated receptor alpha (PPARalpha) J Biol Chem. 1998;273:5678–5684. doi: 10.1074/jbc.273.10.5678. [DOI] [PubMed] [Google Scholar]
- 25.Soler M, Tornavaca O, Solé E, et al. Hormone-specific regulation of the kidney androgen-regulated gene promoter in cultured mouse renal proximal-tubule cells. Biochem J. 2002;366:757–766. doi: 10.1042/BJ20011807. [DOI] [PMC free article] [PubMed] [Google Scholar]
- 26.Davisson RL, Kim HS, Krege JH, et al. Complementation of reduced survival, hypotension, and renal abnormalities in angiotensinogen-deficient mice by the human renin and human angiotensinogen genes. J Clin Invest. 1997;99:1258–1264. doi: 10.1172/JCI119283. [DOI] [PMC free article] [PubMed] [Google Scholar]
- 27.Finck BN, Lehman JJ, Leone TC, et al. The cardiac phenotype induced by PPARalpha overexpression mimics that caused by diabetes mellitus. J Clin Invest. 2002;109:121–30. doi: 10.1172/JCI14080. [DOI] [PMC free article] [PubMed] [Google Scholar]
- 28.Marionneau C, Aimond F, Brunet S, et al. PPARalpha-mediated remodeling of repolarizing voltage-gated K+ (Kv) channels in a mouse model of metabolic cardiomyopathy. J Mol Cell Cardiol. 2008;44:1002–1015. doi: 10.1016/j.yjmcc.2008.03.023. [DOI] [PMC free article] [PubMed] [Google Scholar]
- 29.Duncan JG, Finck BN. The PPARalpha-PGC-1alpha Axis Controls Cardiac Energy Metabolism in Healthy and Diseased Myocardium. PPAR Res. 2008:253817. doi: 10.1155/2008/253817. [DOI] [PMC free article] [PubMed] [Google Scholar]
- 30.Wenz T, Diaz F, Spiegelman BM, et al. Activation of the PPAR/PGC-1alpha pathway prevents a bioenergetic deficit and effectively improves a mitochondrial myopathy phenotype. Cell Metab. 2008;8:249–256. doi: 10.1016/j.cmet.2008.07.006. [DOI] [PMC free article] [PubMed] [Google Scholar] [Retracted]
- 31.Łuczaj W, Skrzydlewska E. DNA damage caused by lipid peroxidation products. Cell Mol Biol Lett. 2003;8:391–413. [PubMed] [Google Scholar]
- 32.Nishikawa M, Nagatomi H, Chang BJ, et al. Targeting superoxide dismutase to renal proximal tubule cells inhibits mitochondrial injury and renal dysfunction inuduced by cisplatin. Arch Biochem Biophys. 2001;387:78–84. doi: 10.1006/abbi.2000.2237. [DOI] [PubMed] [Google Scholar]
- 33.Deigner HP, Hermetter A. Oxidized phospholipids: emerging lipid mediators in pathophysiology. Curr Opin Lipidol. 2008;19:289–294. doi: 10.1097/MOL.0b013e3282fe1d0e. [DOI] [PubMed] [Google Scholar]
- 34.Thomas SR, Witting PK, Drummond GR. Redox control of endothelial function and dysfunction: molecular mechanisms and therapeutic opportunities. Antioxid Redox Signal. 2008;10:1713–1765. doi: 10.1089/ars.2008.2027. [DOI] [PubMed] [Google Scholar]
- 35.Niki E, Yoshida Y, Saito Y, et al. Lipid peroxidation: mechanisms, inhibition, and biological effects. Biochem Biophys Res Commun. 2005;338:668–76. doi: 10.1016/j.bbrc.2005.08.072. [DOI] [PubMed] [Google Scholar]
- 36.Long EK, Murphy TC, Leiphon LJ, et al. Trans-4-hydroxy-2-hexenal is a neurotoxic product of docosahexaenoic (22:6; n-3) acid oxidation. J Neurochem. 2008;105:714–724. doi: 10.1111/j.1471-4159.2007.05175.x. [DOI] [PubMed] [Google Scholar]
- 37.Furukawa F, Nishikawa A, Kasahara K, et al. Involvement of lipid peroxidation in spontaneous pancreatitis in WBN/Kob rats. Pancreas. 2001;22:427–430. doi: 10.1097/00006676-200105000-00014. [DOI] [PubMed] [Google Scholar]
- 38.Tanito M, Elliott MH, Kotake Y, et al. Protein modifications by 4-hydroxynonenal and 4-hydroxyhexenal in light-exposed rat retina. Invest Ophthalmol Vis Sci. 2005;46:3859–3868. doi: 10.1167/iovs.05-0672. [DOI] [PubMed] [Google Scholar]
- 39.Corradi M, Pignatti P, Manini P, et al. Comparison between exhaled and sputum oxidative stress biomarkers in chronic airway inflammation. Eur Respir J. 2004;24:1011–1017. doi: 10.1183/09031936.04.00002404. [DOI] [PMC free article] [PubMed] [Google Scholar]
- 40.Kristal BS, Park BK, Yu BP. 4-Hydroxyhexenal is a potent inducer of the mitochondrial permeability transition. J Biol Chem. 1996;271:6033–6038. doi: 10.1074/jbc.271.11.6033. [DOI] [PubMed] [Google Scholar]
- 41.Chen JJ, Bertrand H, Yu BP. Inhibition of adenine nucleotide translocator by lipid peroxidation products. Free Radic Biol Med. 1995;19:583–590. doi: 10.1016/0891-5849(95)00066-7. [DOI] [PubMed] [Google Scholar]
- 42.Lee JY, Je JH, Kim DH, et al. Induction of endothelial apoptosis by 4-hydroxyhexenal. Eur J Biochem. 2004;271:1339–1347. doi: 10.1111/j.1432-1033.2004.04042.x. [DOI] [PubMed] [Google Scholar]
- 43.Choudhary S, Zhang W, Zhou F, et al. Cellular lipid peroxidation end-products induce apoptosis in human lens epithelial cells. Free Radic Biol Med. 20232:360–369. doi: 10.1016/s0891-5849(01)00810-3. [DOI] [PubMed] [Google Scholar]
- 44.Lee JY, Je JH, Jung KJ, et al. Induction of endothelial iNOS by 4-hydroxyhexenal through NF-kappaB activation. Free Radic Biol Med. 2004;37:539–548. doi: 10.1016/j.freeradbiomed.2004.05.011. [DOI] [PubMed] [Google Scholar]
- 45.Desai VG, Lee T, Delongchamp RR, et al. Development of mitochondria-specific mouse oligonucleotide microarray and validation of data by real-time PCR. Mitochondrion. 2007;7:322–329. doi: 10.1016/j.mito.2007.02.004. [DOI] [PubMed] [Google Scholar]
- 46.Lehman TC, Hale DE, Bhala A, et al. An acyl-coenzyme A dehydrogenase assay utilizing the ferricenium ion. Anal Biochem. 11990;86:280–284. doi: 10.1016/0003-2697(90)90080-s. [DOI] [PubMed] [Google Scholar]
- 47.McManus JFA. Histological and histochemical uses of periodic acid. Stain Technol. 1948;23:99–108. doi: 10.3109/10520294809106232. [DOI] [PubMed] [Google Scholar]
- 48.Megyesi J, Safirstein RL, Price PM. Induction of p21WAF1/CIP1/SDI1 in kidney tubule cells affects the course of cisplatin-induced acute renal failure. J Clin Invest. 1998;101:777–782. doi: 10.1172/JCI1497. [DOI] [PMC free article] [PubMed] [Google Scholar]
Associated Data
This section collects any data citations, data availability statements, or supplementary materials included in this article.