Abstract
Background
Estimation of an individual muscle force still remains one of the main challenges in biomechanics. In this way, the present study aimed: (1) to determine whether an elastography technique called Supersonic Shear Imaging (SSI) could be used to estimate muscle force, (2) to compare this estimation to that one provided by surface electromyography (EMG), and (3) to determine the effect of the pennation of muscle fibers on the accuracy of the estimation.
Methods and Results
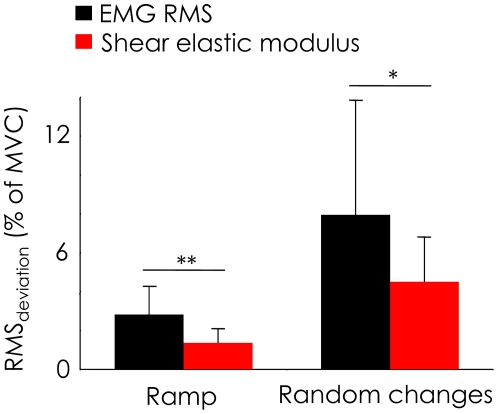
Eleven subjects participated in two experimental sessions; one was devoted to the shear elastic modulus measurements and the other was devoted to the EMG recordings. Each session consisted in: (1) two smooth linear torque ramps from 0 to 60% and from 0 to 30% of maximal voluntary contraction, for the first dorsal interosseous and the abductor digiti minimi, respectively (referred to as “ramp contraction”); (2) two contractions done with the instruction to freely change the torque (referred to as “random changes contraction”). Multi-channel surface EMG recordings were obtained from a linear array of eight electrodes and the shear elastic modulus was measured using SSI. For ramp contractions, significant linear relationships were reported between EMG activity level and torque (R2 = 0.949±0.036), and between shear elastic modulus and torque (R2 = 0.982±0.013). SSI provided significant lower RMSdeviation between measured torque and estimated torque than EMG activity level for both types of contraction (1.4±0.7 vs. 2.8±1.4% of maximal voluntary contraction for “ramp contractions”, p<0.01; 4.5±2.3 vs. 7.9±5.9% of MVC for “random changes contractions”, p<0.05). No significant difference was reported between muscles.
Conclusion
The shear elastic modulus measured using SSI can provide a more accurate estimation of individual muscle force than surface EMG. In addition, pennation of muscle fibers does not influence the accuracy of the estimation.
Introduction
Estimation of individual muscle force could provide considerable insight into neuromuscular physiology, motor control, biomechanics, and robotics. It can also contribute to improved diagnosis and management of both neurological and orthopaedic diseases [1]. However, due to muscle redundancy, this estimation represents one of the main challenges in biomechanics. Classically, muscle activity level is evaluated by surface electromyography (EMG), but several limitations inherent to this technique can preclude an accurate estimation of muscle force [2], [3]. In addition, although several modelling approaches have been proposed in the literature to estimate muscle force with or without EMG data [1], [4], [5], these models cannot be fully validated because of the lack of accurate in vivo experimental procedures [1].
Because of the non-linearity of the mechanical properties of biological tissues, muscle stress is linked to its elastic modulus [6]. In this way, a linear relationship between muscle stiffness and muscle force has been established in isolated frog muscle [7]. Ford et al. [8] considered that, for isometric contractions, the number of active cross bridges could be the source of both tension and active stiffness of the muscle. Consequently, muscle stiffness could provide an estimation of muscle force during contraction. However, classical methods used to study the elastic behavior of muscle in vivo (e.g., quick release, sinusoidal perturbation) assess the global mechanical properties at a joint level [9], [10] without any differentiation of the different structures (i.e., muscle, tendon, or joint) and of the various muscles involved in the task. This problem could be solved by using a new elastographic technique, called supersonic shear imaging (SSI) [11], [12]. This technique consists of calculating shear elastic modulus by measuring the local shear wave velocity propagation from a remote mechanical vibration. It has been shown to provide reliable measurements of shear elastic modulus at rest (Lacourpaille L. et al., submitted) and during contraction [13].
Therefore, the aim of this study was to determine whether SSI could be used to estimate individual muscle force and to compare this estimation to that obtained with surface EMG. For that purpose, it was necessary to investigate a task involving a muscle without synergist, i.e., a task in which the measured torque is produced by only one muscle. Thus, we studied isometric index abduction (mainly involving the first dorsal interosseous [14]), and isometric little finger abduction (mainly involving the abductor digiti minimi [15]). Since shear elastic modulus can be sensitive to the orientation of muscle fibers [16], the other aim of this study was to determine the effect of the pennation of muscle fibers on the relationship between shear elastic modulus and torque. Because the first dorsal interosseous is bi-pennated and the abductor digiti minimi is fusiform, these two muscles could provide interesting information on the influence of muscle architecture on the relationship between shear elastic modulus and torque.
Materials and Methods
Participants
Eleven healthy males volunteered to participate in this study (25±2.7 years; 179.3±7.9 cm; 75.4±9.1 kg). Participants were informed of the purpose of the study and methods used before providing written consent. The experimental design of the study was approved by the Ethical Committee of Nantes Ouest IV (reference: n°CPP-MIP-001) and was conducted in accordance with the Declaration of Helsinki (last modified in 2004).
Measurements
Ergometer
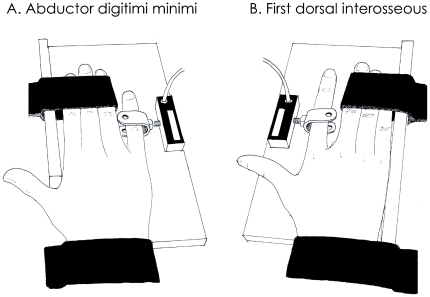
A homemade ergometer was used to measure the torque produced by index finger abduction and little finger abduction (Fig. 1). Briefly, the subjects were seated with their right elbows flexed to 120° (180° corresponds to the full extension of the elbow), and the pronated forearm was supported by a platform; all fingers were extended with the palm facing down. The hand and fingers #3 to #5 or #2 to #4 (for index abduction and little finger abduction, respectively) were immobilized with Velcro straps to prevent any movement during the contractions (Fig. 1). The lateral side of the index finger or little finger was in contact with a rigid interface, with the proximal interphalangeal joint aligned with the force sensor (SML-50, Interface, Arizona, USA). As depicted in Fig. 1, the thumb was not restrained during index abduction in order to avoid compensation with the adductor pollicis brevis involved in the closing of the index-thumb hodler. Participants were instructed to not move the thumb during the index abduction.
Figure 1. Experimental setup.
The right pronated forearm was supported on a platform and all fingers were extended with the palm facing down. The hand and fingers 2 to 4 for little finger abduction (A) or 3 to 5 for index abduction (B) were immobilized with Velcro straps to prevent any movement and compensation during contractions. The little finger (A) or lateral side of the index finger (A) was in contact with a rigid interface, with the proximal interphalangeal joint aligned with the force sensor.
Electromyography
Multi-channel surface EMG recordings were obtained from the first dorsal interosseous and the abductor digiti minimi using an adhesive linear array of eight electrodes with 5-mm inter-electrode distances (Spesmedica, Battipaglia, Italy). The electrode array was located over the muscle belly (for both muscles) and followed the direction of muscle fibers (for the fusiform muscle, the abductor digiti minimi). A reference electrode was placed at the level of the wrist. Prior to electrode placement, the skin was cleaned with alcohol in order to minimize impedance. To ensure proper skin-electrode contact, 20 µL of conductive gel were inserted into the cavities of the electrode. Signals were amplified (x 500, EMG-USB, LISIN-OttinoBiolettronica, Turin, Italy), band-pass filtered (6–400 Hz), digitized at a sampling rate of 4096 Hz, and stored by a computer.
Elastography
For measurements of shear elastic modulus, an Aixplorer ultrasonic scanner (Version 4.2, Supersonic Imagine, Aix en Provence, France) was used in the SSI mode (musculo-skeletal preset). As described by Bercoff et al. [11], the system consisted of a transient and remote mechanical vibration generated by radiation force induced by a focused ultrasonic beam (i.e., “pushing beam”). Each pushing beam generated a remote vibration that resulted in the propagation of a transient shear wave. Then, an ultrafast echographic imaging sequence was performed to acquire successive raw radio-frequency data at a very high frame rate (up to 20 kHz). A one-dimensional cross correlation of successive radio-frequency signals was used to determine the shear wave velocity (Vs) along the principle axis of the probe using a time-of-flight estimation. Then, considering a linear elastic behavior, a shear elastic modulus (µ) was calculated using Vs as follows:
| (1) |
where ρ is the density of muscle (1,000 kg/m3).
Note that the linear [11], [17]–[20] and purely elastic [18], [20] behaviors are classically considered in most of the studies of muscle elastography.
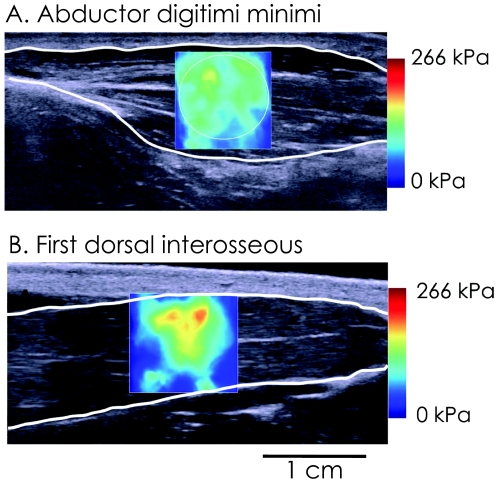
Measurements were made from the first dorsal interosseous and abductor digiti minimi muscles. For each of these muscles, the probe was aligned carefully with the direction of shortening of the muscle. Maps of the shear elastic modulus were obtained at 1 Hz (i.e., maximal sampling frequency of the device) with a spatial resolution of 1x1 mm (Fig. 2). The shear elasticity map was chosen as large as possible (about from 1×1.5 cm to 1.5×1.5 cm, depending on the muscle depth/thickness) to obtain a representative averaged shear elastic modulus value.
Figure 2. Typical example of shear elastic modulus measurement of the abductor digiti minimi (A) and the first dorsal interosseous (B).
These data were obtained in a representative subject during the “ramp contraction”. The colored region represents the shear elasticity map with the scale to the right of the figure. The shear elastic modulus (in kPa) was averaged over the greatest muscular area avoiding aponeurosis.
Protocol
The experimental protocol was divided into three sessions. The first session was devoted to the familiarization. The second and third sessions were separated by 48 hours; one was devoted to the SSI measurements, and the other was devoted to the EMG recordings (randomly assigned). Each of these two sessions proceeded in two stages (randomly assigned); one stage was devoted to index abduction (i.e., measurement of the first dorsal interosseous), the other stage was devoted to little finger abduction (i.e., measurement of the abductor digiti minimi). First, for each muscle, maximal isometric voluntary contractions (MVC) were measured during three maximal contractions lasting 3 s that were separated by 2 min of recovery. The largest of the three forces was considered as the maximum voluntary force and was used to normalize subsequent submaximal contractions. Then, participants were asked to perform one smooth linear torque ramp (refered to as “ramp contraction” in this report) of 30 s from 0 to 60% of the previously determined MVC for index abduction and from 0 to 30% of MVC for little finger abduction. These ranges were the maximal range of torque that can be developed without saturation of the SSI measurement (discussed below) assessed during a preliminary experiment. To control the ramping of the torque, the participants had to follow a visual feedback displayed on a monitor placed in front of them. After a 5-min recovery period, the subjects performed a new 30-s contraction with the instruction to randomly and slowly change the torque throughout the trial (referred to as “random changes contraction” in this report). They were instructed to develop torque within the range used during the ramp contraction (i.e., between 0 and 60% of MVC for the first dorsal interosseous and between 0 and 30% for the abductor digiti minimi), and to explore all of this range of torque. During each contraction, depending on the session, shear elastic modulus or surface EMG were recorded and synchronized with torque measurements.
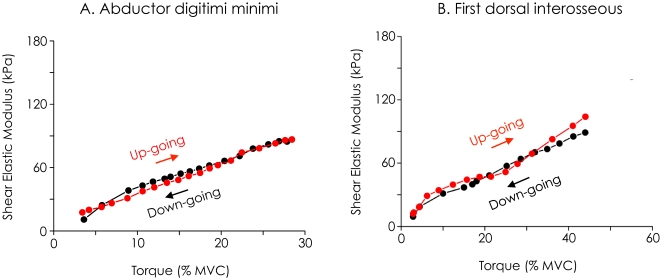
To determine whether hysteresis can interfere in the ability to accurately estimate muscle force, two participants performed an additional experiment consisting of up-going/down-going ramps cycles (i.e., 20-s linear increase of the torque until 30% (abductor digiti minimi) or 60% (first dorsal interosseous) of MVC, followed by linear 20-s decrease).
Data analysis
Data processing was performed using MATLAB® scripts (The Mathworks, Natick, USA). Prior to data analysis, the raw EMG signals were checked, and putative channels corresponding to the muscle/tendon junction were removed from further analysis (0 to 2 channels, depending on the subject/muscle). Then, for each remaining channel, EMG was Root Mean Squared (RMS) using a time-averaging period of 1 s and averaged across all the channels to obtain a representative EMG activity of the whole muscle. As recommended by Keenan et al. [21], EMG RMS was normalized to the maximal value achieved over 150 ms during MVC contractions to limit signal cancellation.
SSI recordings were exported from software (Version 4.2, Supersonic Imagine, Aix en Provence, France) in “mp4” format, sequenced in “jpeg.” An average value of shear elastic modulus over the largest muscular region available on the shear elastic modulus map, excluding aponeurosis from the analyzed region, was calculated for each map, i.e., each second (Fig. 2). Due to limitations of the current version of the ultrasonic scanner, shear elastic modulus measurements saturated at 266 kPa, limiting the range of analysis for most of the participants. If one value in the analyzed region reached 266 kPa, the mean value of this region (for both “ramp” and “random changes” contractions) and all the following values (for only “ramp contractions”) were discarded from further analysis.
According to the literature, the relationships between EMG RMS and torque obtained for “ramp contractions” were fitted using a linear model (eq. 2) [22]–[24]. Based on pilot experiments that showed an excellent correlation between the shear elastic modulus and torque, linear fits (eq. 2) were also performed for the relationship between shear elastic modulus and torque. This model was chosen because it is the simplest one that could be used in the future to assess muscle force in a redundant system. a and b coefficients were classically calculated by minimization of the squared difference between the predicted (Tpredicted) and the measured (Tmeasured) torque values during “ramp contractions”.
| (2) |
where X is the EMG RMS (in % of MVC) or the shear elastic modulus (in kPa) and i the index of the shear elastic modulus or RMS EMG sampled at 1 Hz.
The coefficient of determination (R2) and the RMSdeviation (eq. 3) were calculated to assess goodness of fit and the error of estimation for both EMG and SSI measurements.
 |
(3) |
Previously determined “a” and “b” coefficients (eq. 2) were used to estimate the torque during the “random change contractions” for both EMG and SSI measurements. RMSdeviation was also calculated (eq. 3) to quantify the error of estimation during these contractions.
To quantify hysteresis in the two tested participants, relationships between shear elastic modulus and torque were plotted for up-going and down-going conditions. Normalized area of the hysteresis defined as the normalized difference between the areas under the up-going ramp relationship and under the down-going ramp relationship was calculated.
Statistical analysis
Data distributions consistently passed the Kolmogorov-Smirnov normality test (Statistica®V6, Statsoft, Maison-Alfort, France), and thus the values are reported as mean±standard deviation throughout the text and the figures.
Two-way repeated-measure ANOVAs (random factor - participant, between subject factor – method and muscle) were used to test the effect of the method (i.e., EMG and SSI) and of the muscle (i.e., first dorsal interosseous and abductor digiti minimi) on both the coefficient of determination and RMSdeviation for “ramp” and “random changes contraction”. The level of significance was set as p < 0.05.
Results
Range of analysis
Of the 22 “ramp contractions” (2 muscles×1 ramp×11 subjects), the saturation level of the shear elastic modulus at 266 kPa was reached 15 times before the end of the ramp. Consequently, “ramp contractions” were analyzed up to 39.1±12.6% of MVC (range: 23.8-55.4% of MVC) for first dorsal interosseous and up to 25.3±4.2 % of MVC (range: 16.3-32.2% of MVC) for abductor digiti minimi.
EMG RMS/torque and shear elastic modulus/torque relationships
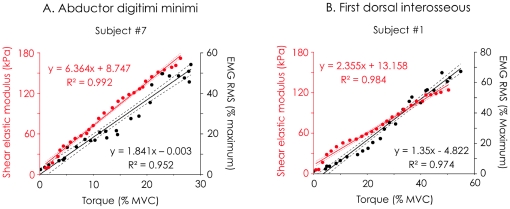
For both first dorsal interosseous and abductor digiti minimi, Fig. 3 depicts a typical example of the relationship between EMG RMS and torque and between shear elastic modulus and torque.
Figure 3. Typical EMG RMS/torque and shear elastic modulus/torque relationships calculated during “ramp contraction”.
Linear regressions (and their 95% of confidence interval in dashed lines) between normalized EMG RMS and torque (black dots/lines) and between shear elastic modulus and torque (red or grey dots/lines) are depicted for both the the abductor digiti minimi (A) and the First dorsal interosseous (A). MVC, Maximal Voluntary Contraction; EMG RMS, Root mean square value of the electromyographic signal.
Mean R2 of the linear regressions fitted to EMG RMS/torque data was 0.961±0.032 (range: 0.881–0.992) for the first dorsal interosseous and 0.936±0.036 (range: 0.847–977) for the abductor digiti minimi. The mean RMSdeviation linked to this fitting was 3.0±1.5% of MVC (range: 1.1–5.1% of MVC) for the first dorsal interosseous and 2.7±1.5% of MVC (range: 1.0–5.9% of MVC) for the abductor digiti minimi.
The linear regressions fitted to shear elastic modulus/torque data led to R2 values greater than 0.95 for both muscles of all subjects. More precisely, mean R2 was 0.986±0.007 (range: 0.976–0.997) for the first dorsal interosseous and 0.977±0.016 (range: 0.951–995) for the abductor digiti minimi. RMSdeviation was 1.7±0.8% of MVC (range: 0.4–2.9% of MVC) for the first dorsal interosseous and 1.05±0.44% of MVC (range: 0.6–1.9 % of MVC) for the abductor digiti minimi.
Accuracy of torque estimation
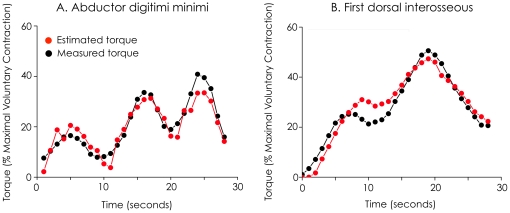
For both first dorsal interosseous and abductor digiti minimi, Fig. 4 depicts a typical example of the torque measurements and the torque estimations during “random changes contractions”.
Figure 4. Typicalexample of torque estimation using supersonic shear imaging.
Shear elastic modulus and torque (black dots/lines) measurements were obtained during “random changes contraction”. Torque estimation (red or grey dots/lines) was performed using the equation of the linear regression obtained for “ramp contraction” (Eq 2 in the manuscript). Torque measurements and torque estimations are depicted for both the abductor digiti minimi (A) and the first dorsal interosseous (B).
Estimation of torque during “random change contractions” used linear regression equations as calibrations and thus combined two sources of deviation: one from linear fitting and the other one from torque estimation. Using EMG RMS, mean RMSdeviation of the torque estimation was 7.3±3.5% of MVC (range: 4.0–13.3% of MVC) for the first dorsal interosseous and 9.2±7.7% of MVC (range: 1.9–28.2% of MVC) for the abductor digiti minimi. Using the shear elastic modulus, mean RMSdeviation of the torque estimation was 5.8±2.3% of MVC (range: 1.3–9.2% of MVC) for the first dorsal interosseous and 3.2±1.3% of MVC (range: 1.7–6.0% of MVC) for the abductor digiti minimi.
Comparison between SSI and EMG
ANOVA revealed a main effect of “method” on both the coefficient of determination and on the RMSdeviation of the linear fitting obtained during the “ramp contractions.” More precisely, we found a significantly greater R2 (p < 0.001) and a significantly lower RMSdeviation (p < 0.001) for shear elastic modulus/torque relationships compared to RMS EMG/torque relationships (Fig. 5). ANOVA also revealed a main effect of “method” on the RMSdeviation for “random changes contractions”. RMSdeviation was significantly lower (p < 0.05) for shear elastic modulus than for EMG RMS (Fig. 5).
Figure 5. Accuracy of individual muscle force estimation.
RMSdeviation between estimated torque and measured torque was calculated for “ramp contractions” and “random changes contractions” from both EMG RMS and shear elastic modulus. *: p< 0.05 **: p < 0.01 MVC, Maximal Voluntary Contraction.
Effect of the pennation of muscle fibers
ANOVA revealed no main effect of “muscle” on the coefficients of determination of the linear regressions obtained for the “ramp contractions” (p = 0.10) or on RMSdeviations for both “ramp contractions” (p = 0.17) and “random change contractions” (p = 0.61).
Hysteresis
Figure 6 depicts an individual example of the negligible hysteresis calculated for shear elastic modulus measurements. For subject #1, hysteresis was 4.15% for abductor digiti minimi and −6.87% for first dorsal interosseous; for subject #2, it was 4.3% for abductor digiti minimi and 2.8% for first dorsal interosseous.
Figure 6. Illustration of the absence of hysteresis.
Two subjects performed up-going/down-going ramps cycles (i.e., 20-s linear increase of the torque until 30% (abductor digiti minimi) or 60% (first dorsal interosseous) of maximal voluntary contraction (MVC) directly followed by linear 20-s decrease). The relationship between shear elastic modulus and torque is depicted for the abductor digiti minimi (A) and the first dorsal interosseous (A) and. The results show that there was no hysteresis effect on the relationship between shear elastic modulus and torque.
Discussion
The present study reported linear relationships between EMG activity level and torque and between shear elastic modulus and torque for both the first dorsal interosseous (from 0 to about 40% of MVC) and the abductor digiti minimi muscles (from 0 to 25% of MVC). The results also showed that estimation of individual muscle force is more accurate using shear elastic modulus measured with SSI than surface EMG.
The first dorsal interosseousis responsible of about 93% of the force produced during index finger abduction [14]. Subjects with a transfer of the abductor digiti minimi are not able to perform a little finger abduction [15]. Consequently, one could reasonably consider that the measured torque was produced by only one muscle in both tasks. In other words, the measured external torque can be considered as the individual muscle torque. This condition resolves the indeterminacy problem of load sharing (due to muscle redundancy), which usually complicates the relationship between individual muscle torque and the external global torque. For instance, Nordez and Hug [13] reported the shear elastic modulus/torque relationship during an isometric elbow flexion involving various synergist muscles. Because changes in load sharing can occur during this task (Bouillard K., et al., submitted), they were unable to establish the relationship between modulus and individual muscle torque. To the best of our knowledge, the present study is the first to report robust linear regression between the shear elastic modulus and individual muscle torque. Using magnetic resonance imaging, other authors measured the muscle shear elastic modulus during contraction [25], [26]. However, due to the long acquisition time (up to 1 min) of this technique, these studies tested only a few torque levels and thus were not able to provide robust shear elastic modulus/torque relationships. Taking into account the high coefficients of determination (i.e., R2 > 0.95 in all of the cases) and the low deviation (i.e., RMSdeviation< 2.9% of MVC in all of the cases) reported herein, the relationship between shear elastic modulus and individual muscle torque seems to be fitted correctly by linear regression. Furthermore, we can reasonably extend our results to individual muscle force, confirming expectations that a stiffness measurement can provide an estimation of muscle force [7], [8]. Thus, individual muscle force can be simply estimated using SSI and a linear calibration.
In accordance with previous studies, relationships between EMG activity level and muscle torque were fitted well by a linear model for both the first dorsal interosseous [22], [23] and the abductor digiti minimi [24], at least over the torque ranges examined in present study. However, statistical analysis showed a significantly lower RMSdeviation obtained from shear elastic modulus compared to EMG activity level for both “ramp contractions” and “random changes contractions.” This demonstrates that SSI provides a more precise estimation of muscle force than EMG.
Note that estimation of muscle force during “random changes contractions” using SSI could be affected by hysteresis on the ascending (i.e., torque increase) and descending (i.e., torque decrease) shear elastic modulus/torque relationship (i.e., higher shear elastic modulus values during the ascending phase compared to the descending phase). To determine whether this phenomenon could have influenced the measurement of shear elastic modulus, an additional experiment was performed on two subjects. Fig. 6 clearly shows that there was no hysteresis effect on the shear elastic modulus/torque relationship. This was confirmed by the calculation of the normalized area of the hysteresis. Since hysteresis was demonstrated for EMG activity level/torque relationship [27], this result can also explain the more accurate estimation of individual muscle force using SSI compared to EMG.
Regarding the influence of the angle between muscle fascicules and the SSI probe on the measurements of shear elastic modulus [16], we tested the effect of muscle architecture on the precision of the estimation of muscle torque. In this way, the present study reported data for a bi-pennated muscle (i.e., the first dorsal interosseous, pennation angle ≈15°) [28], and a fusiform muscle (i.e., the abductor digiti minimi). The accuracy of the estimation of individual muscle force using both SSI and EMG was not significantly different between muscles. It must be acknowledged that, due to saturation limitation, the experiments were not performed on the same range of torque for both muscles (i.e., 39.1±12.6% of MVC for the first dorsal interosseous vs. 25.3±4.2% of MVC for the abductor digiti minimi). However, the same range of values of the shear elastic modulus was tested. Overall, this conclusion should be confirmed in other conditions because it might be specific to the present experimental procedure (task and muscle).
Conclusions and perspectives
The present study focused on tasks involving only one synergist muscle to show that the shear elastic modulus measured using SSI can provide an accurate estimation of individual muscle force until 40% of MVC and during isometric contraction. Further investigations should associate moment arm measurements (e.g., using magnetic resonance imaging) to shear elastic modulus measurements to estimate individual muscle forces more directly during more complex movement, allowing us to precisely quantify the load sharing among all the synergists. In addition, the shear elastic modulus measurement using SSI would provide a unique way to validate the numerous models implemented to estimate muscle force [1].
Acknowledgments
The authors thank Jean Hug for drawing Fig. 1.
Footnotes
Competing Interests: The authors have declared that no competing interests exist.
Funding: This work was supported by the Association Française contre les Myopathies (AFM - contract 14597), the Région des Pays de la Loire (2010_11120), and the Fonds Européen de Développement Régional. The funders had no role in study design, data collection and analysis, decision to publish, or preparation of the manuscript.
References
- 1.Erdemir A, McLean S, Herzog W, van den Bogert AJ. Model-based estimation of muscle forces exerted during movements. ClinBiomech (Bristol, Avon) 2007;22:131–154. doi: 10.1016/j.clinbiomech.2006.09.005. [DOI] [PubMed] [Google Scholar]
- 2.Farina D, Merletti R, Enoka RM. The extraction of neural strategies from the surface EMG. J ApplPhysiol. 2004;96:1486–1495. doi: 10.1152/japplphysiol.01070.2003. [DOI] [PubMed] [Google Scholar]
- 3.Hug F. Can muscle coordination be precisely studied by surface electromyography? J ElectromyogrKinesiol. 2011;21:1–12. doi: 10.1016/j.jelekin.2010.08.009. [DOI] [PubMed] [Google Scholar]
- 4.Buchanan TS, Lloyd DG, Manal K, Besier TF. Neuromusculoskeletal modeling: estimation of muscle forces and joint moments and movements from measurements of neural command. J ApplBiomech. 2004;20:367–395. doi: 10.1123/jab.20.4.367. [DOI] [PMC free article] [PubMed] [Google Scholar]
- 5.Zajac FE, Neptune RR, Kautz SA. Biomechanics and muscle coordination of human walking: part II: lessons from dynamical simulations and clinical implications. Gait Posture. 2003;17:1–17. doi: 10.1016/s0966-6362(02)00069-3. [DOI] [PubMed] [Google Scholar]
- 6.Y-cheng Fung. Springer; 1993. Biomechanics: mechanical properties of living tissues.590 [Google Scholar]
- 7.Mason P. Dynamic stiffness and crossbridge action in muscle. BiophysStructMech. 1977;4:15–25. doi: 10.1007/BF00538837. [DOI] [PubMed] [Google Scholar]
- 8.Ford LE, Huxley AF, Simmons RM. The relation between stiffness and filament overlap in stimulated frog muscle fibres. J Physiol (Lond) 1981;311:219–249. doi: 10.1113/jphysiol.1981.sp013582. [DOI] [PMC free article] [PubMed] [Google Scholar]
- 9.Cornu C, Goubel F, Fardeau M. Muscle and joint elastic properties during elbow flexion in Duchenne muscular dystrophy. J Physiol (Lond) 2001;533:605–616. doi: 10.1111/j.1469-7793.2001.0605a.x. [DOI] [PMC free article] [PubMed] [Google Scholar]
- 10.Weiss PL, Hunter IW, Kearney RE. Human ankle joint stiffness over the full range of muscle activation levels. J Biomech. 1988;21:539–544. doi: 10.1016/0021-9290(88)90217-5. [DOI] [PubMed] [Google Scholar]
- 11.Bercoff J, Tanter M, Fink M. Supersonic shear imaging: a new technique for soft tissue elasticity mapping. IEEE Trans UltrasonFerroelectr Freq Control. 2004;51:396–409. doi: 10.1109/tuffc.2004.1295425. [DOI] [PubMed] [Google Scholar]
- 12.Shinohara M, Sabra K, Gennisson J-L, Fink M, Tanter M. Real-time visualization of muscle stiffness distribution with ultrasound shear wave imaging during muscle contraction. Muscle Nerve. 2010;42:438–441. doi: 10.1002/mus.21723. [DOI] [PubMed] [Google Scholar]
- 13.Nordez A, Hug F. Muscle shear elastic modulus measured using supersonic shear imaging is highly related to muscle activity level. J ApplPhysiol. 2010;108:1389–1394. doi: 10.1152/japplphysiol.01323.2009. [DOI] [PubMed] [Google Scholar]
- 14.Chao EY. World Scientific; 1989. Biomechanics of the hand: a basic research study.208 [Google Scholar]
- 15.Lebreton E. Hypothenar eminence. Chir Main. 2010;29:213–223. doi: 10.1016/j.main.2010.04.003. [DOI] [PubMed] [Google Scholar]
- 16.Gennisson J-L, Deffieux T, Macé E, Montaldo G, Fink M, et al. Viscoelastic and anisotropic mechanical properties of in vivo muscle tissue assessed by supersonic shear imaging. Ultrasound Med Biol. 2010;36:789–801.17. doi: 10.1016/j.ultrasmedbio.2010.02.013. [DOI] [PubMed] [Google Scholar]
- 17.Gennisson J-L, Catheline S, Chaffaï S, Fink M. Transient elastography in anisotropic medium: application to the measurement of slow and fast shear wave speeds in muscles. J Acoust Soc Am. 2003;114:536–541. doi: 10.1121/1.1579008. [DOI] [PubMed] [Google Scholar]
- 18.Catheline S, Gennisson JL, Delon G, Fink M, Sinkus R, et al. Measuring of viscoelastic properties of homogeneous soft solid using transient elastography: an inverse problem approach. J Acoust Soc Am. 2004;116:3734–3741. doi: 10.1121/1.1815075. [DOI] [PubMed] [Google Scholar]
- 19.Nordez A, Gennisson JL, Casari P, Catheline S, Cornu C. Characterization of muscle belly elastic properties during passive stretching using transient elastography. J Biomech. 2008;41:2305–2311. doi: 10.1016/j.jbiomech.2008.03.033. [DOI] [PubMed] [Google Scholar]
- 20.Deffieux T, Montaldo G, Tanter M, Fink M. Shear wave spectroscopy for in vivo quantification of human soft tissues visco-elasticity. IEEE Trans Med Imaging. 2009;28:313–322. doi: 10.1109/TMI.2008.925077. [DOI] [PubMed] [Google Scholar]
- 21.Keenan KG, Farina D, Maluf KS, Merletti R, Enoka RM. Influence of amplitude cancellation on the simulated surface electromyogram. J ApplPhysiol. 2005;98:120–131.22. doi: 10.1152/japplphysiol.00894.2004. [DOI] [PubMed] [Google Scholar]
- 22.Milner-Brown HS, Stein RB. The relation between the surface electromyogram and muscular force. J Physiol (Lond) 1975;246:549–569. doi: 10.1113/jphysiol.1975.sp010904. [DOI] [PMC free article] [PubMed] [Google Scholar]
- 23.Lawrence JH, De Luca CJ. Myoelectric signal versus force relationship in different human muscles. J ApplPhysiol. 1983;54:1653–1659. doi: 10.1152/jappl.1983.54.6.1653. [DOI] [PubMed] [Google Scholar]
- 24.Del Santo F, Gelli F, Ginanneschi F, Popa T, Rossi A. Relation between isometric muscle force and surface EMG in intrinsic hand muscles as function of the arm geometry. Brain Res. 2007;1163:79–85. doi: 10.1016/j.brainres.2007.06.012. [DOI] [PubMed] [Google Scholar]
- 25.Dresner MA, Rose GH, Rossman PJ, Muthupillai R, Manduca A, et al. Magnetic resonance elastography of skeletal muscle. J MagnReson Imaging. 2001;13:269–276. doi: 10.1002/1522-2586(200102)13:2<269::aid-jmri1039>3.0.co;2-1. [DOI] [PubMed] [Google Scholar]
- 26.Basford JR, Jenkyn TR, An K-N, Ehman RL, Heers G, et al. Evaluation of healthy and diseased muscle with magnetic resonance elastography. Arch Phys Med Rehabil. 2002;83:1530–1536. doi: 10.1053/apmr.2002.35472. [DOI] [PubMed] [Google Scholar]
- 27.Orizio C, Baruzzi E, Gaffurini P, Diemont B, Gobbo M. Electromyogram and force fluctuation during different linearly varying isometric motor tasks. J ElectromyogrKinesiol. 2010;20:732–741. doi: 10.1016/j.jelekin.2010.03.005. [DOI] [PubMed] [Google Scholar]
- 28.Infantolino BW, Challis JH. Architectural properties of the first dorsal interosseous muscle. J Anat. 2010;216:463–469. doi: 10.1111/j.1469-7580.2009.01196.x. [DOI] [PMC free article] [PubMed] [Google Scholar]


