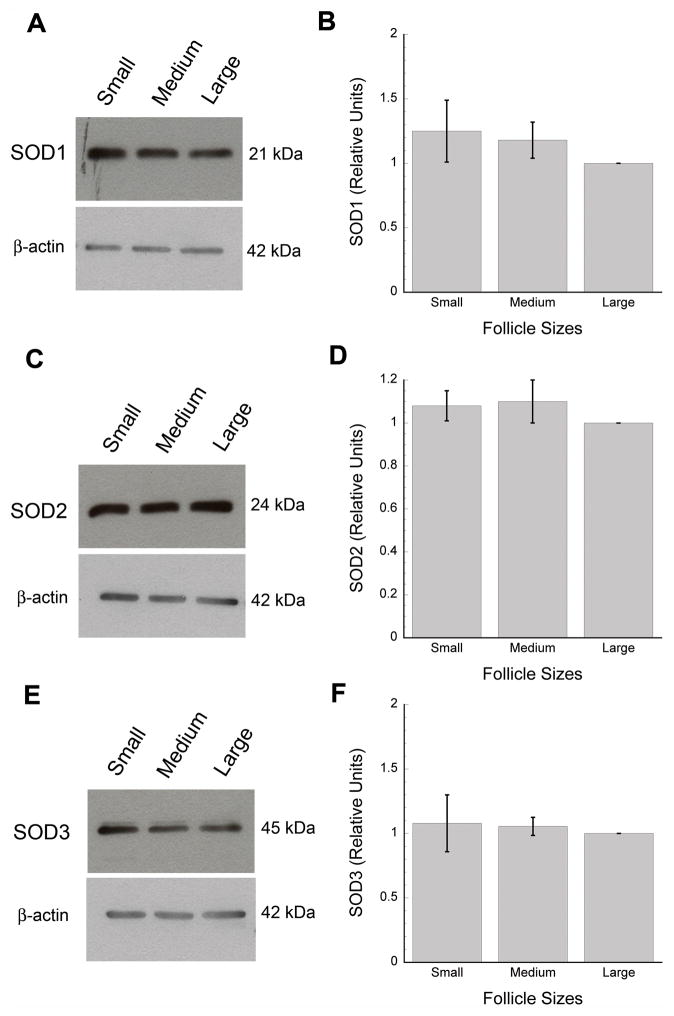
Figure 3.
Expression of SOD1 (A–B), SOD2 (C–D), and SOD3 (E–F) proteins in pooled granulosa cell lysates from small (2–5 mm), medium (6–8 mm), and large (>8 mm) antral follicles. Panels A, C, and E show representative immunoblots for each SOD isoenzyme. SOD protein concentrations were quantified and reported as arbitrary units relative to a set value of 1 for samples from large follicles (in B, D, and F, Y-axis values are expressed as means ± SD’s). β-actin was used as a loading control for each SOD blot (A, C, E).

