Abstract
Objective To examine differences in expectations for health using anchoring vignettes, which describe fixed levels of health on dimensions such as mobility.
Design Cross sectional survey of adults living in the community.
Setting China, Myanmar, Sri Lanka, Pakistan, Turkey, and United Arab Emirates.
Participants 3012 men and women aged 18 years and older (self ratings); subsample of 406 (vignette ratings).
Main outcome measures Self rated mobility levels and ratings of hypothetical vignettes using the same questions and response categories.
Results Consistent rankings of vignettes are evidence that vignettes are understood in similar ways in different settings, and internal consistency of orderings on two mobility questions indicates good comprehension. Variation in vignette ratings across age groups suggests that expectations for mobility decline with age. Comparison of responses to two different mobility questions supports the assumption that individual ratings of hypothetical vignettes relate to expectations for health in similar ways as self assessments.
Conclusions Anchoring vignettes could provide a powerful tool for understanding and adjusting for the influence of different health expectations on self ratings of health. Incorporating anchoring vignettes in surveys can improve the comparability of self reported measures.
Introduction
Valid, reliable, and comparable measures of health are critical components of the evidence base for clinical practice and health policy. Clinical trials and national surveys rely heavily on self reported measures of health,1-5 but interpretation of these measures is complicated by incomparability when different people understand and respond to a given question in different ways. Paradoxical findings have been reported in many analyses of population health surveys, suggesting that self reported measures may be misleading without adjustment for these differences.6-9
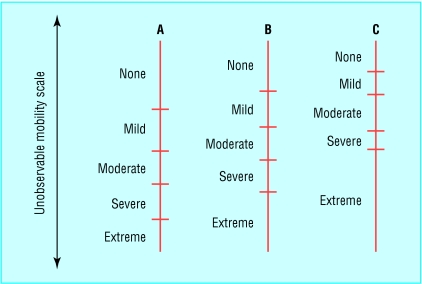
Distinguishing between differences in self ratings due to actual health differences and differences due to varying norms or expectations for health is a key challenge in interpreting self reported measures of health.10,11 We may conceptualise different dimensions of health—for example, mobility, cognition, vision—as continuous but unobserved scales. Each available response to a categorical question corresponds to a range of values on the scale that may vary across individuals (fig 1). Differing expectations for health can lead to differences in the levels at which people change from using one response category to the next—that is, differences in response category cut points. For example, a 90 year old man who struggles to climb the stairs might characterise himself as having “mild difficulties” in moving around, but a 40 year old man with the same mobility might describe himself as having “moderate difficulties.” These responses are incomparable because the individuals have different response category cut points for questions about mobility.
Fig 1.
Self assessment: how much difficulty do you have in moving around? The problems of interpersonal or cross population comparability may be conceptualised in terms of shifts in response category cut points. Different people (A, B, and C) might translate levels on an unobserved, continuous mobility scale into categorical responses in different ways, depending on the location of their cut points. Cut points define thresholds on the unobservable scale at which individuals move from one response category to another
Strategies for making self reported measures of health more comparable may require new tools for both collecting and analysing survey data.12 Standard models for ordinal data—such as the ordered probit model—do not allow for variation in response category cut points, although these models can be adapted to allow for systematic cut point shifts in relation to covariates such as country, age, and sex.13-16 Anchoring vignettes are a new component of survey instruments that can be used in conjunction with the extended statistical models to position self reported responses on a common interpersonally comparable scale. We describe an application of this strategy from a series of pilot studies for the World Health Survey.17 We give examples of how anchoring vignettes may be used to understand variation in expectations for health and discuss the implications for interpreting self ratings of health.
Methods
Components of the World Health Survey were pilot tested in 12 countries between May and June 2002, including six countries that tested the module on health measurement (China, Myanmar, Pakistan, Sri Lanka, Turkey, and the United Arab Emirates). Researchers selected a cross section of the adult population (≥ 18 years) in each country, with an emphasis on enlisting similar numbers of men and women and getting enough representation at all ages and at different levels of income and education. The samples in the six countries included 467 to 605 adults in each except in Pakistan, which surveyed 234 adults. Researchers completed face to face surveys with one respondent per household using a standardised questionnaire translated into the local language through defined protocols.17
The health module included a self assessment component consisting of one to three questions pertaining to each of 12 domains, along with 15 different anchoring vignettes per domain. In this paper, we focus on the domain of mobility as an example. An anchoring vignette is a description of a concrete level on a given domain that respondents evaluate with the same questions and response scales used for self assessments on that domain (box). Vignettes are fixed (by design) across respondents so that variation in categorical responses is attributable to differences in response category cut points. The key objective in this approach is to elicit ratings for hypothetical levels on a given domain that reflect individual norms and expectations for health in approximately the same way that the self ratings do for the individuals' own levels. Each respondent answered self assessments for all domains and rated 10 different vignettes for each of two domains, assigned at random from the 12 domains. The total set of 15 vignettes per domain included five vignettes that were common to all six countries and 10 vignettes that were common to three of the six countries.
We examined distributions of self assessments and vignette ratings for the two mobility items in the survey. An important requirement of the anchoring vignette approach is that individuals understand the actual levels described in the vignettes in the same way. Although we expect some variation in the ordering of vignettes based on stochastic measurement error (present in any survey instrument), the consistency of individual rank orderings with the overall average ordering in the pooled data set offers one indication of the degree to which vignettes are interpreted similarly in different populations. Internal consistency of the ordering of vignettes based on the two different mobility questions also allows evaluation of comprehension of vignettes. We computed rank correlations for the individual vignette ratings on both questions in reference to the average ratings in the pooled data set and for individual vignette ratings between the first and second mobility questions. Variation in the categorical vignette ratings was assessed across age groups and countries, and between the two different mobility items. We analysed data with Stata 7.0.
Results
A total of 3012 respondents completed the health survey. The mean age was 41 (standard deviation 15), with a range across countries from 33 (10) in the United Arab Emirates to 49 (15) in China. A total of 1837 (61%) respondents were younger than 45, and 478 (26%) had had less than 6 years of education (table 1). Self assessed mobility ratings varied considerably between countries, with 45% (249/555 in Sri Lanka) to 85% (431/510 in the United Arab Emirates) of respondents reporting no difficulties moving around. Of the 3012 respondents, 406 (13.5%) completed the version of the questionnaire that included mobility vignettes.
Table 1.
Distribution of sample used in pilot study of health module for the World Health Survey by age, sex, years of schooling, and country
| No (%) | |
|---|---|
| Age (years): | |
| 18-24 | 391 (13) |
| 25-34 | 680 (23) |
| 35-44 | 724 (25) |
| 45-54 | 585 (20) |
| 55-64 | 276 (9) |
| 65+ | 276 (9) |
| Sex: | |
| Male | 1296 (44) |
| Female | 1673 (56) |
| Years of schooling: | |
| 0 | 228 (8) |
| 1-5 | 503 (18) |
| 6-12 | 951 (34) |
| >12 | 1078 (39) |
| Country: | |
| China | 467 (16) |
| Myanmar | 605 (20) |
| Pakistan | 236 (8) |
| Sri Lanka | 594 (20) |
| Turkey | 600 (20) |
| United Arab Emirates | 510 (17) |
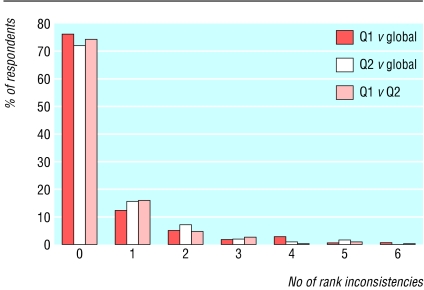
Evidence on consistency of vignette orderings across respondents and internal consistency within each individual's vignette ratings on the two mobility questions suggests that comprehension of the vignette rating task is good across all sites, and that a similar understanding of the levels described in the vignettes prevails (fig 2 and table 2). For the two global comparisons and the internal comparison, about three quarters of responses were completely consistent with an additional 18% to 22% having only one or two rank inconsistencies in each case.
Fig 2.
Distribution of respondents by number of rank inconsistencies in vignette ratings compared with global ordering and internal comparisons between two mobility questions. (Results shown for five vignettes common to all study sites. One rank inconsistency refers to cases in which the ranks of a pair of vignettes are inverted. For example, if vignettes are numbered according to the global ordering, then 12435 would be characterised by one rank inconsistency. Two rank inconsistencies would include cases in which one vignette shifts by two ranks (and displaces two adjacent vignettes accordingly)—for example, 14235—or cases in which two pairs of vignettes have inverted ranks, for example 21354. Because complete orderings may be unobserved when respondents rate more than one vignette in the same response category, we resolved ties in favour of the consistent ordering)
Table 2.
Consistency of vignette orderings and average rank correlation coefficients by country. Results are shown for the five vignettes common to all six countries
|
Proportion consistent*rankings (%)
|
Average rank correlation*
|
|||||
|---|---|---|---|---|---|---|
| Country | Q1 (v global) | Q2 (v global) | Q1 v Q2 | Q1 (v global) | Q2 (v global) | Q1 v Q2 |
| China | 83 | 76 | 76 | 0.96 | 0.97 | 0.97 |
| Myanmar | 76 | 72 | 72 | 0.93 | 0.92 | 0.91 |
| Pakistan | 71 | 81 | 76 | 0.95 | 0.94 | 0.93 |
| Sri Lanka | 71 | 70 | 79 | 0.84 | 0.85 | 0.88 |
| Turkey | 70 | 62 | 67 | 0.89 | 0.87 | 0.87 |
| United Arab Emirates | 87 | 85 | 83 | 0.96 | 0.95 | 0.95 |
| All countries | 76 | 72 | 74 | 0.90 | 0.89 | 0.92 |
Because multiple vignettes may be rated in the same category, complete orderings may not be observed. Consistency of rankings and Spearman's rank order correlation coefficients were therefore computed with ties resolved in favour of the consistent ordering.
Mobility questions in the World Health Survey pilot study
(Q1) Overall in the last 30 days, how much difficulty did [you/name] have with moving around? (a) none; (b) mild; (c) moderate; (d) severe; (e) extreme
(Q2) In the past 30 days, how much difficulty did [you/name] have in vigorous activities, such as running 3 km or cycling? (a) none; (b) mild; (c) moderate; (d) severe; (e) extreme
Mobility vignettes
Paul is an active athlete who runs long distance races of 20 km twice a week and plays soccer with no problems
Mary has no problems with walking; running; or using her hands, arms, and legs. She jogs 4 km twice a week
Adriana is quite active and does sports twice a week, such as tennis or swimming. Once a month, however, she is too tired for sports so takes a 3 km walk instead
Rob is able to walk distances of up to 200 m without any problems, but feels tired after walking one km or climbing more than one flight of stairs. He has no problems with day to day physical activities, such as carrying food from the market
Philip goes walking every day for half an hour, 1 km or 2 km. He does not practise any strenuous sports as he feels out of breath when he walks very quickly or runs
Nathan has attacks of anxiety when he goes out of his house. So he leaves his home only once a week, and never by himself
Anton does not exercise. He cannot climb stairs or do other physical activities because he is obese. He is able to carry the groceries and do some light household work
Margaret feels chest pain and gets breathless after walking distances of up to 200 m, but is able to do so without assistance. Bending and lifting objects such as groceries also cause chest pain
Rina has had a stiff neck for the last 10 days and it makes her move around slowly as any sudden movement causes pain
Jenny is an adult with an intellectual impairment and she is also obese. She struggles to get out of a chair and moves very slowly
Louis is able to move his arms and legs, but requires assistance in standing up from a chair or walking around the house. Any bending is painful, and lifting is impossible
Vincent has a lot of swelling in his legs due to his health condition. He has to make an effort to walk around his home as his legs feel heavy
Sid suffers from a mental illness and spends his days rocking in a chair. He never moves out of his chair except when physically assisted by another person
David is paralysed from the neck down. He is confined to bed and must be fed and bathed by somebody else
Gemma has a brain condition that makes her unable to move. She cannot even move her mouth to speak or smile. She can only blink her eyelids
Names are included as examples only. Each site developed separate sets of locally appropriate male and female names, and interviewers presented the set of names matched to each respondent's gender.
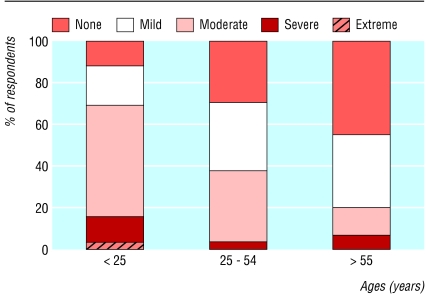
The primary purpose of including anchoring vignettes linked to self assessments is to detect and then adjust for differences in response category cut points to make categorical self reports more comparable. As an example of how vignette ratings can reveal differences in cut points that may relate to varying norms and expectations for health, fig 3 shows the distribution of ratings for one mobility vignette in different age groups for the three countries that included this vignette (Myanmar, Pakistan, and Turkey). The Kolmogorov-Smirnov test for equality of distributions confirms significant differences between the youngest and oldest age groups (P = 0.001). This example suggests that older individuals use a more lenient interpretation of the same set of response categories in describing mobility levels, which is consistent with the notion of shifting norms for health over the life course.
Fig 3.
Variation in vignette ratings across age groups in three countries (Myanmar, Pakistan, and Turkey) (N=211). Responses are shown for the question, “[Rob] is able to walk distances of up to 200 m without any problems but feels tired after walking 1 km or climbing up more than one flight of stairs. He has no problems with day to day physical activities, such as carrying food from the market. Overall, how much difficulty does [Rob] have with moving around?”
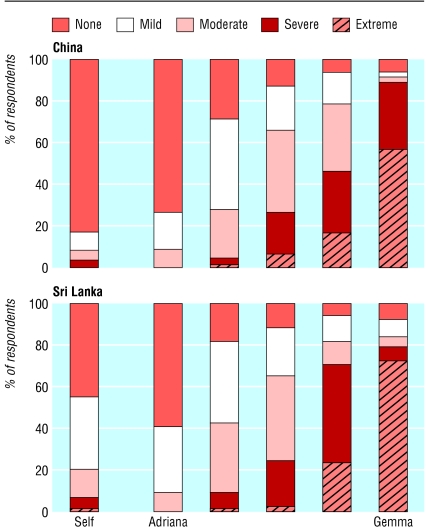
When survey respondents rate a series of vignettes on a domain, we can summarise the responses in different groups using stacked bar diagrams. For example, fig 4 compares ratings for five mobility vignettes from the samples in China and Sri Lanka. Each stacked bar shows the categorical responses for one vignette, with the vignettes ordered from higher to lower mobility levels based on average categorical scores. In these samples, respondents from Sri Lanka tend to give less favourable ratings than those from China, conditional on the fixed level of mobility described in a vignette. The differences in self rated mobility in the two samples, shown in the top bars of fig 4, may arise from a combination of variation in health experiences and variation in expectations. Given the older sample in China and the results in fig 3, part of the variation in both self assessments and vignette ratings may be explained by age related health norms. Results in these non-probabilistic samples will not necessarily be generalisable to the entire populations in each country but nevertheless provide a useful illustration of the way that ratings of anchoring vignettes can show differences in cut points across populations.
Fig 4.
Mobility ratings for self assessment and selected vignettes, China and Sri Lanka (N=1061 for self ratings, N=151 for vignettes). The survey asked, “How much difficulty did [you/name] have with moving around?” The vignettes shown, from left to right, are those labelled as Adriana, Anton, Margaret, Louis, and Gemma in the box
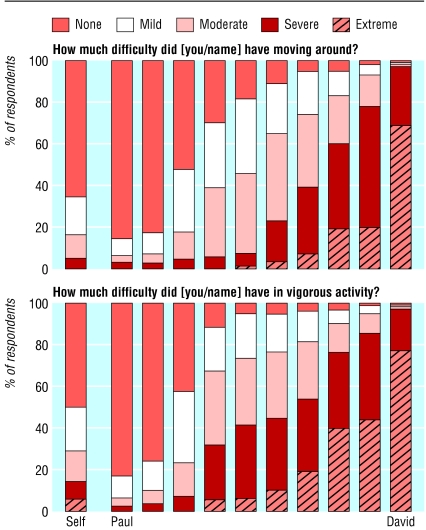
In addition to comparisons within and between countries, comparisons of vignette ratings may also show how cut points for the same person change over time, where longitudinal data are available, or place cut points for multiple questions relating to the same domain on a common scale. For example, fig 5 shows the ratings for an array of 10 vignettes using the two different mobility questions. This figure shows that the second question is “more difficult” in the sense of tapping a higher level of mobility than the first; that individuals rate themselves favourably on mobility but recognise on average that the top two vignettes describe higher levels than their own; and that respondents use the available categories similarly in providing self ratings and vignette ratings, suggested by the correspondence between the two questions on both the self assessments and vignette ratings—in both cases, individuals respond to the second question in a way that accords with tapping a higher level of difficulty.
Fig 5.
Self assessments and vignette ratings for two mobility questions (Q1: How much difficulty did [you/name] have with moving around? Q2: How much difficulty did [you/name] have in vigorous activities?). Pooled results are shown from six countries (China, Myanmar, Pakistan, Sri Lanka, Turkey, and United Arab Emirates) (N=3012 for self ratings, N=406 for vignettes). The vignettes shown, from left to right, are those labelled as Paul, Mary, Adriana, Rob, Anton, Margaret, Rina, Louis, Vincent, and David in the box.
Discussion
Inclusion of anchoring vignettes in health surveys is part of an integrated strategy of instrument design and analysis to make self reported measures more comparable between individuals, communities, and populations.12 Anchoring vignettes may be applied to many different problems in which ordered categorical self report data are collected. This approach enables examination of systematic differences in categorical cut points between populations, within populations across different socio-demographic groups, or within individuals or groups over time. The anchoring vignette method also allows comparisons between different questions relating to a common domain, enabling the interpretation of responses to these related questions on a single underlying scale, and thus providing a bridge between data collected using different instruments.
The use of vignettes has a long history in research for the social sciences, including applications in anthropology, sociology, and psychology since the 1950s18-20 and numerous applications of the factorial-survey technique.21 Recent examples of the use of vignettes in health and medicine include applications in nursing research, medical education, and research on clinical practice.22-25 Our anchoring vignette approach differs from those in previous studies in certain fundamental ways. Firstly, rather than generating random variants of the same vignette,21 our approach uses vignettes as scale anchors and therefore requires that a given vignette describes the same level to all respondents. Secondly, our strategy is based on explicit links between vignette ratings and self ratings through the use of identical questions and response categories.
Two important requirements for the use of anchoring vignettes are response consistency—which implies that an individual uses response categories for a particular question similarly when evaluating hypothetical scenarios as when providing self assessments—and vignette equivalence—which implies that the underlying domain level represented in each vignette is understood in approximately the same way by all respondents, irrespective of their age, sex, education, country of residence, or other characteristics. We note that even when vignette equivalence holds, the categorical ratings for a given vignette may vary systematically due to differences in expectations; our strategy is designed to identify these differences. Empirical investigations about the two requirements of the approach are essential elements of the research needed on anchoring vignettes. We present available evidence supporting both requirements; further research is underway to develop techniques for critically evaluating and comparing different vignettes.
Our examples show that variation in vignette ratings for mobility can reveal differences in expectations for health—for instance, between different age groups. Formal statistical models have been introduced to allow anchoring vignette data to be used in adjusting self rated measures of health,15,16 but fundamental insights can be gained into differences in the use of particular questions and their associated response categories by analysing distributions of vignette ratings, even before any models are applied. Anchoring vignettes have been developed for the World Health Survey for a range of different health domains, as well as for other areas that share similar methodological challenges, such as health system responsiveness and social capital. Although more work is needed to refine individual vignettes and identify those that work best, this study shows that the anchoring vignette strategy is feasible in a variety of settings and offers promise for more widespread application of the approach.
A number of limitations should be noted. Firstly, the sample size in this pilot study is small and cannot be assumed to represent general populations. Although we aim to show the types of empirical findings that are available through the use of anchoring vignettes, the data collected in the probability samples of the World Health Survey will allow further investigation on some of the questions that we raise. Cross validating the anchoring vignette approach will be useful—for example, using measured performance tests on selected health domains. Current understanding of the causes of differences in cut points is limited. Research on psychology and decision making has highlighted a range of biases and heuristics that shape responses to survey questions26; similar quantitative understanding of how different health expectations influence self perceptions of health and key correlates of these differences would aid interpretation of self reported measures of health.
Interest has been rising recently in the challenges of interpreting self assessments of health, relating to issues of perception versus observation and experiences versus expectations.8,10 Anchoring vignettes can provide a useful tool for standardising perceptions of health and adjusting self reported measures to account for variation in norms and expectations for health. As self assessments continue to play a central role in the measurement of health outcomes in clinical trials and summary measures of population health, a strategy of including vignettes in national surveys and clinical research can improve the utility of these measures by confronting important problems of interpersonal comparability.
What is already known on this topic
Variation in perceptions of health and self assessments of health status may be related in part to different expectations for health
Standard methods for measuring health status do not distinguish changes in health from changes in expectations. Interpretation of self reported measures of health may be improved by using new methods that account for varying expectations
What this study adds
Application of a data collection strategy based on anchoring vignettes enables the investigation of different individual expectations for health and the adjustment of self reported measures of health to account for these differences
Empirical evidence from a multi-country survey study using the anchoring vignette strategy points to differences in health expectations across age groups and countries
By mapping responses to various questions on the same health domain to a common comparable scale, anchoring vignettes can provide a bridge between data collected using different instruments for measuring health status
We thank David Cutler and Gary King for useful discussions and Dan Hogan for help with research.
Contributors: JAS, AT, and CJLM conceived and designed the study, analysed and interpreted the data, and drafted the manuscript. JAS is guarantor. The World Health Survey Pilot Study Collaborating Group is Bedirhan Ustun, Somnath Chatterji, Lydia Bendib, Can Celik, Colin Mathers, Abdelhay Mechbal, Christopher JL Murray, Emre Ozaltin, Alena Petrakova, Ritu Sadana, Joshua A Salomon, Ajay Tandon, Maria Villanueva, Jeff Xie, Cao Yang, Feng Jiang, Keqin Rao, Kyi Soe, Ashfaq Ahmed, Thushara Fernando, Kutegin Ogel, Adnan Kisa, and Gohar Wajid.
Funding: Analysis supported by National Institute on Aging (P01 AG17625).
Competing interests: None declared.
Ethical approval: Not needed.
References
- 1.Testa MA, Simonson DC. Assessment of quality-of-life outcomes. N Engl J Med 1996;334: 835-40. [DOI] [PubMed] [Google Scholar]
- 2.Kind P, Dolan P, Gudex C, Williams A. Variations in population health status: results from a United Kingdom national questionnaire survey. BMJ 1998;316: 736-41. [DOI] [PMC free article] [PubMed] [Google Scholar]
- 3.Fischer D, Stewart AL, Bloch DA, Lorig K, Laurent D, Holman H. Capturing the patient's view of change as a clinical outcome measure. JAMA 1999;282: 1157-62. [DOI] [PubMed] [Google Scholar]
- 4.Shibuya K, Hashimoto H, Yano E. Individual income, income distribution, and self rated health in Japan: cross sectional analysis of nationally representative sample. BMJ 2002;324: 16-9. [DOI] [PMC free article] [PubMed] [Google Scholar]
- 5.Garratt A, Schmidt L, Mackintosh A, Fitzpatrick R. Quality of life measurement: bibliographic study of patient assessed health outcome measures. BMJ 2002;324: 1417. [DOI] [PMC free article] [PubMed] [Google Scholar]
- 6.Murray CJL, Chen LC. Understanding morbidity change. Popul Dev Rev 1992;18: 481-503. [Google Scholar]
- 7.Mathers CD, Douglas RM. Measuring progress in population health and well-being. In: Eckersley R, ed. Measuring progress: is life getting better. Collingwood: CSIRO, 1998: 125-55.
- 8.Sen A. Health: perception versus observation. BMJ 2002;324: 860-1. [DOI] [PMC free article] [PubMed] [Google Scholar]
- 9.Sadana R, Mathers CD, Lopez AD, Murray CJL, Iburg KM. Comparative analysis of more than 50 household surveys of health status. In: Murray CJL, Salomon JA, Mathers CD, Lopez AD, eds. Summary measures of population health: concepts, ethics, measurement and applications. Geneva: World Health Organization, 2002.
- 10.Carr AJ, Gibson B, Robinson PG. Measuring quality of life: is quality of life determined by expectations or experience? BMJ 2001;322: 1240-3. [DOI] [PMC free article] [PubMed] [Google Scholar]
- 11.Freedman VA, Martin LG. Understanding trends in functional limitations among older Americans. Am J Public Health 1998;88: 1457-62. [DOI] [PMC free article] [PubMed] [Google Scholar]
- 12.Murray CJL, Tandon A, Salomon JA, Mathers CD, Sadana R. Cross-population comparability of evidence for health policy. In: Murray CJL, Salomon JA, Mathers CD, Lopez AD, eds. Summary measures of population health: concepts, ethics, measurement and applications. Geneva: World Health Organization, 2002.
- 13.Groot W. Adaptation and scale of reference bias in self-assessments of quality of life. J Health Econ 2000;19: 403-20. [DOI] [PubMed] [Google Scholar]
- 14.Wolfe R, Firth D. Modelling subjective use of an ordinal response scale in a many period crossover experiment. Appl Stat 2002;51: 245-55. [Google Scholar]
- 15.Tandon A, Murray CJL, Salomon JA, King G. Statistical models for enhancing cross-population comparability. In: Murray CJL, Evans DB, eds. Health systems performance assessment: debates, methods and empiricism. Geneva: World Health Organization, 2003: 727-46.
- 16.King G, Murray CJL, Salomon JA, Tandon A. Enhancing the validity and cross-population comparability of measurement in survey research. Am Polit Sci Rev 2004; 98. (In press.)
- 17.World Health Organization. World Health Survey. www.who.int/whs (accessed 6 Jan 2004).
- 18.Herskovits MJ. The hypothetical situation: a technique of field research. Southwest J Anthropol 1950;6: 32-40. [Google Scholar]
- 19.Anderson HH, Anderson GL. An introduction to projective techniques and other devices for understanding human behavior. Englewood Cliffs: Prentice Hall, 1951.
- 20.Walster E. Assignment of responsibility for an accident. J Pers Soc Psychol 1966;3: 73-9. [DOI] [PubMed] [Google Scholar]
- 21.Rossi PH, Nock SL. Measuring social judgments: the factorial survey approach. Beverly Hills: Sage, 1982.
- 22.Koedoot CG, De Haes JC, Heisterkamp SH, Bakker PJ, De Graeff A, De Haan RJ. Palliative chemotherapy or watchful waiting? A vignettes study among oncologists. J Clin Oncol 2002;20: 3658-64. [DOI] [PubMed] [Google Scholar]
- 23.Goldie J, Schwartz L, McConnachie A, Morrison J. The impact of three years' ethics teaching, in an integrated medical curriculum, on students' proposed behaviour on meeting ethical dilemmas. Med Educ 2002;36: 489-97. [DOI] [PubMed] [Google Scholar]
- 24.Kelly WF, Eliasson AH, Stocker DJ, Hnatiuk OW. Do specialists differ on do-not-resuscitate decisions? Chest 2002;121: 957-63. [DOI] [PubMed] [Google Scholar]
- 25.Hughes R, Huby M. The application of vignettes in social and nursing research. J Adv Nurs 2002;37: 382-6. [DOI] [PubMed] [Google Scholar]
- 26.Tversky A, Kahneman D. The framing of decisions and the psychology of choice. Science 1981;211: 453-8. [DOI] [PubMed] [Google Scholar]


