

Abstract
Purpose
To investigate the relationship between drusen extent and foveolar choroidal blood flow in non-exudative AMD.
Methods
Total drusen area, average druse area, and total drusen number were determined using a computer program developed to quantify the extent of manually outlined drusen from fundus photographs of 157 patients (239 eyes) with non-exudative AMD. Laser Doppler flowmetry was used to assess relative choroidal blood velocity (ChBVel), volume (ChBVol), and flow (ChBFlow) in the center of the fovea.
Results
We found a significant inverse relationship between total drusen area and ChBVol or ChBFlow. For every 1 mm2 increase in total drusen area, ChBVol decreased by 0.0061 arbitrary units (AU; p=0.03) and ChBFlow decreased by 0.23 AU (p=0.049). Average druse area was also significantly inversely related to ChBVol and ChBFlow. For every 0.01 mm2 increase in average druse area, the ChBVol decreased by 0.0149 AU (p=0.001) and the ChBFlow decreased by 0.4951 AU (p=0.003). Adjustment for age weakened the significance, though it remained strong for average druse area versus ChBFlow (p=0.017) and ChBVol (p=0.004). The computer-aided quantification of drusen used in this study showed high intra- and inter-grader agreement.
Conclusion
In patients with non-exudative AMD, there is an association between increased drusen extent and decreased ChBVol and ChBFlow. This suggests the presence of ischemia and possibly the reason why patients with high risk drusen are prone to advanced disease.
INTRODUCTION
Age-Related Macular Degeneration (AMD) is the most common cause of irreversible vision loss in the developed world in people 50 years of age or older. A hallmark of the disease is the development of extracellular deposits, drusen, in the outer retina. The presence of drusen in the macula is a known risk factor for progression of the disease. Previous studies in our laboratory have suggested that decreased foveolar choroidal blood flow is associated with AMD1,2 and, moreover, abnormal choroidal circulatory measurements predict risk of progression of the disease.3
Since the choroidal circulation is the sole supply of nutrients to the outer retina and the only means of metabolic waste removal, any reduction in blood flow to the area would have important effects. One of these negative consequences might be the accumulation of drusen.
The purpose of this study was to investigate the relationship between extent of drusen and choroidal blood flow. To achieve this goal we performed a cross-sectional study in which we quantified the extent of drusen in the macula and we measured foveolar choroidal blood flow.
METHODS
Subjects and Study Eye Characteristics
Two-hundred and thirty-nine eyes of 157 patients with AMD, VA of 20/40 or better, no evidence of choroidal neovascularization (CNV) in the study eye, and no other intraocular disease were included in the study. All study eyes had steady fixation, clear ocular media, and pupillary dilation of 5 mm or more. All study patients signed a written consent form that had been approved by the IRB of our institution. The tenets of the Declaration of Helsinki were followed in this investigation.
Measurements
At the initial visit, all patients had choroidal circulation measurements taken. Determinations of relative foveolar choroidal blood velocity (ChBVel), volume (ChBVol), and flow (ChBFlow) were obtained with the laser Doppler flowmetry (LDF) technique (Oculix instrument). ChBVel is proportional to the mean velocity of the RBCs within the volume sampled by the laser light and ChBVol is proportional to the number of RBCs. Both ChBVel and ChBVol are independent measurements. ChBFlow was calculated by the instrument from these two parameters according to the following formula: ChBFlow = Constant x ChBVel x ChBVol.4 Detailed descriptions of the method have been published.5,6,7,8 A diode laser beam (670 nm) with an intensity of 20 mW was delivered through a fundus camera (model TRC; Topcon, Tokyo, Japan). The diameter of the probing laser beam was approximately 200 μm.
During blood flow measurements, an area of the posterior retina (30° in diameter) was illuminated at a wavelength of 570 nm with a retinal irradiance of approximately 0.03 mW/cm2. This light enabled the observation of the position of the laser on the foveola. Subjects were asked to fixate on the probing laser beam. Measurements obtained in this fashion correspond mainly to determinations of choriocapillaris flow, as discussed previously by Riva et al.5 Proper fixation during the measurements was ascertained by direct observation of the foveola through the fundus camera. All measurements were performed with the subjects seated in a darkened room.
In each subject, three continuous 30-second measurements of the choroidal circulation were obtained. Analysis of these data was performed by a masked observer using a NeXT computer (Redwood, CA) with software specifically developed for the analysis of Doppler signals from ocular tissues.6 The masked observer selected for analysis parts of the recordings that showed stable circulatory parameters. On average, approximately 12 seconds of stable measurements were selected for analysis in each eye.
Fundus photographs were taken at the initial visit using a Zeiss FF-4 fundus camera (Germany). The software for drusen quantification was custom designed at the University of Pennsylvania using fast programming languages. Facile graphical user interface was designed to aid in the drusen grading. The software allowed for placement of a digital Wisconsin grading template. Grading of fundus photographs was performed in a masked fashion by a trained grader. Drusen within 3000 microns from the center of the foveola were manually outlined by the trained grader using a laser-guided computer mouse. The number of drusen, individual druse area, total drusen area, and the shortest distance between the druse edge and the foveal center were automatically recorded by the software into a database and exported into Microsoft Excel spreadsheets. Pixel calibration was based on the Wisconsin grading template for the Zeiss FF-4 fundus camera (Germany). The software program further allowed saving the outlined drusen as part of the original fundus image for documentation purposes. Figures 1A and B show fundus images pre-analysis and post-analysis, respectively.
Figure 1.
A, Image of fundus, pre-analysis; b, Image of fundus of same eye, post-analysis
Of the 255 images for which we had LDF blood flow data and fundus photographs, we were unable to perform an analysis of drusen extent in 6 eyes because of poor image quality or obscured view of the macula and in 10 eyes because the fovea was not at the center of the image and part of the Wisconsin template was out of bounds of the image.
During the study, a random sample of 20 images were graded twice, 6 months apart by a grader (TB) to assess the intra-grader agreement of drusen grading, and another random sample of 24 images were independently graded by two graders (TB and LG), 9 months apart to assess the inter-grader agreement of drusen grading.
Statistical Analysis
Descriptive analyses were performed for the patient characteristics and drusen parameters (total drusen area, total drusen number, average druse area) by using mean, standard deviation (SD), median and range values. Linear regression and Pearson correlation analyses were used to assess the relationship between drusen extent and foveolar choroidal circulatory measurements. Because drusen extent and foveolar choroidal circulatory measurements from both eyes were measured in some patients, and measurements from paired eyes of a patient are likely to be highly correlated, we used generalized estimating equation (GEE) to adjust the inter-eye correlation between paired eyes of patients.9
The inter- and intra-grader agreement for drusen grading was assessed using Bland-Altman plots and intra-class correlations (ICC).10 ICC values equal to 0 represent agreement equivalent to that expected by chance, while 1 represents perfect agreement. All calculations were performed using SAS 9.1 (SAS Institute, Inc., Cary, NC).
RESULTS
The baseline characteristics of the 157 subjects include a mean age of patients of 71 years, mean systolic blood pressure of 137 mmHg, mean diastolic blood pressure of 75 mmHg, mean intraocular pressure (IOP) of 15.3 mmHg, and mean spherical equivalent of 0.55 diopters. The majority of patients were white (98.1%), 55.4% were female, 7% were current smokers, and 45.9% were normotensive.
In 239 study eyes, total number of drusen within 3000 microns from the center of the foveola ranged from 1 to 846 (median=126), total drusen area ranged from 0.001 to 9.62 mm2 (median=1.65 mm2), and average druse area ranged from 0.001 to 0.097 mm2 (median=0.01 mm2).
Blood flow parameters were measured in 239 study eyes. The mean (SD) was 0.23 (0.10) AU for ChBVol, 0.38 (0.09) AU for ChBVel, and 7.4 (3.1) AU for ChBFlow.
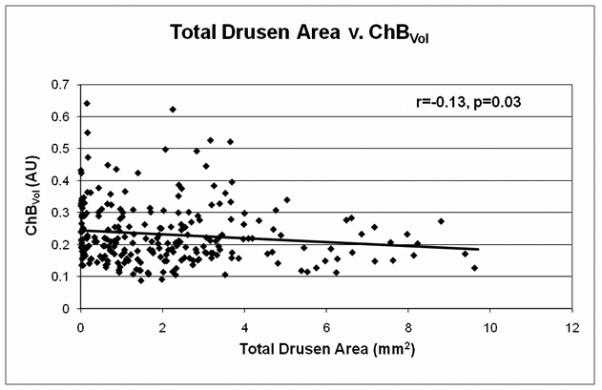
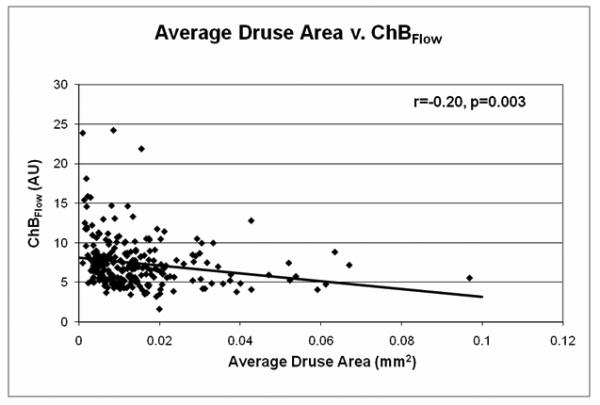
The relationship between drusen extent and choroidal blood flow parameters is shown in Table 1 and Figures 2-3. A significant inverse relationship between total drusen area and ChBVol or ChBFlow was found (Table 1). For every 1 mm2 increase in total drusen area, ChBVol decreased by 0.0061 arbitrary units (AU; p=0.03) and ChBFlow decreased by 0.23 AU (p=0.049). The inverse relationship between total drusen area and ChBVol (r=−0.13, p=0.03) or ChBFlow (r=−0.15, p=0.049) can be seen in graphical form in Figures 2A and 2B. Average druse area was also significantly inversely related to ChBVol and ChBFlow (Table 1). For every 0.01 mm2 increase in average druse area, the ChBVoldecreased by 0.0149 AU (p=0.001), and the ChBFlow decreased by 0.495 AU (p=0.003). The inverse relationship between average druse area and ChBVol (r=−0.20, p=0.001) or ChBFlow (r=−0.20, p=0.003) can be seen in Figures 3A and 3B. Number of drusen was not significantly associated with choroidal circulatory measurements (Table 1). Age-adjusted analysis of the data is also shown in Table 1. After adjustment for age, larger average druse area remained significantly associated with decreased ChBVol (p=0.004) and ChBFlow (p=0.017).
Table 1.
The association of drusen number and drusen area with blood flow parameters
| Drusen measure | Volume | Velocity | Flow | |||
|---|---|---|---|---|---|---|
| Linear Regression Coefficient (SE) |
P Value |
Linear Regression Coefficient (SE) |
P Value |
Linear Regression Coefficient (SE) |
P Value | |
|
Total Drusen Number
(every 10 drusen) |
||||||
| Unadjusted | −0.0001 (0.0006) |
0.80 | −0.0005 (0.0005) |
0.30 | −0.022 (0.021) |
0.29 |
| Adjusted by age | −0.0001 (0.0006) |
0.85 | −0.0005 (0.0005) |
0.30 | −0.021 (0.021) |
0.31 |
| Total Drusen Area | ||||||
| Unadjusted | −0.0061 (0.0029) |
0.03 | 0.0011(0.005) | 0.83 | −0.23 (0.12) | 0.049 |
| Adjusted by age | −0.0047 (0.0028) |
0.09 | 0.0011(0.005) | 0.83 | −0.19 (0.12) | 0.13 |
| Average Druse Area | ||||||
| Unadjusted | −1.49 (0.45) | 0.001 | 0.43 (0.70) | 0.53 | −49.51 (16.84) |
0.003 |
| Adjusted by age | −1.19 (0.42) | 0.004 | 0.45 (0.69) | 0.52 | −38.07 (16.02) |
0.017 |
Figure 2.
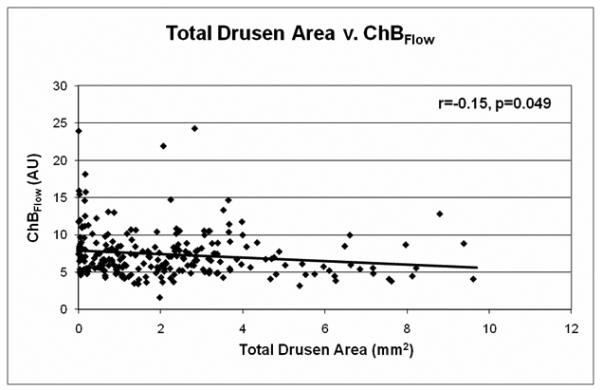
A, Total drusen area v. ChBVol (r=−0.13, p=0.03); B, Total drusen area v. ChBFlow (r=−0.15, p=0.049)
Figure 3.
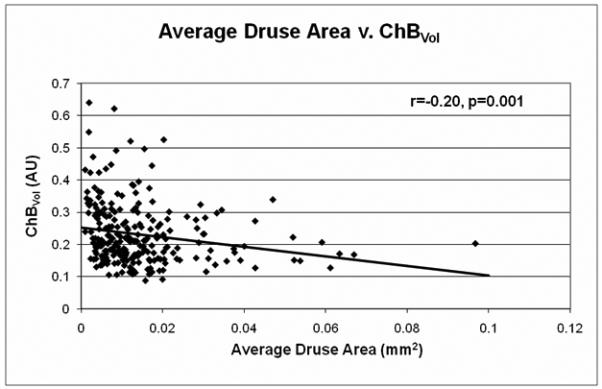
A, Average druse area v. ChBVol (r=−0.20, p=0.001); B, Average druse area v. ChBFlow (r=−0.20, p=0.003)
Grade-regrade comparisons were based on measurements of 20 eyes repeated twice by the same grader for intra-grader reliability and 24 eyes repeated twice by different graders for inter-grader reliability. Both analyses showed high grade-regrade reliability. Intra-grader reliability measurements had an intraclass correlation of 0.93 (0.84-0.97, 95% CI) for total drusen area, 0.88 (0.73-0.95) for average druse area, and 0.91 (0.80-0.96) for total drusen number. Inter-grader reliability measurements had an intraclass correlation of 0.85 (0.69-0.93, 95% CI) for total drusen area, 0.86 (0.71-0.94) for average druse area, and 0.93 (0.85-0.97) for total drusen number.
As grade-regrade reliability was similar for all measurements, a representative Bland Altman plot of grade-regrade agreement was chosen (Figure 4), showing the intra-grader grade-regrade agreement for total drusen area.
Figure 4.
Representative Bland-Altman plot for the grade-regrade agreement of total drusen area measurements, intra-grader analysis. Each point represents a measured value from an image. The middle dashed line represents the mean of the grade-regrade differences. The upper and lower dashed lines represent the mean ± 2 SDs of grade-regrade differences
DISCUSSION
Our results suggest that in patients with non-exudative AMD, eyes with a larger extent of drusen, as measured by total drusen area and average druse area, tend to have decreased ChBVol and ChBFlow. The development of drusen is a characteristic sign in the clinical presentation of AMD. Drusen are extracellular deposits located in the outer retina between Bruch’s membrane and the retinal pigment epithelium (RPE). Conventionally, drusen are categorized as small (<63 μm in diameter), medium (63 to 124 μm), or large (>124 μm) on the basis of studies that classified the grade of age-related macular degeneration.11 Large drusen are associated with increased severity of the disease. This suggests that area covered by drusen may be an important determinant of disease risk. The gold standard used for measuring drusen size in many of the largest studies to date relies on trained graders using pre-formed plastic cards containing open circles of set diameter.12,13,14 Drusen are then grouped into one of the three size categories. However, such a technique requires that drusen extent be estimated by human graders in terms of percent of total area covered by drusen rather than calculated quantitatively.
The advantages of manual grading include better discernment of drusen versus non-drusen, decreased false positives and false negatives, and a known standardization scale. As the technology of computer programs and retinal imaging has improved, many labs have investigated automated or semi-automated means of quantifying drusen.15,16,17 The advantages of computer-assisted measurements include reduced grading time, improved quantitative data, and utilization of technical advances in digital image manipulation. These technologies, however, have not become the standard means of quantification for large-scale studies. Some labs have recognized the disadvantages of fully automatic quantification, such as over- or underestimation of drusen, and have included means of selective observer intervention in the computer program.14,15
For the current study, we used a computer program designed to provide specific, quantitative data on drusen characteristics while maintaining the accuracy and reproducibility of manual identification techniques. Such a combination utilizes the computer’s superior ability to quantify information and a human grader’s superior ability to distinguish and accurately outline drusen. As our results reveal, the computer program used had high inter- and intra-grader reliability with intraclass correlations ≥ 0.85 for both inter-grader and intra-grader agreement, thereby confirming the reproducibility of these measurements. By using the computer program, we were able to quantitate the actual size of individual drusen, rather than estimate their diameter. As a result, we were able to determine area measurements of drusen extent. This allowed us to investigate circulatory measurements as they relate to drusen extent in individual eyes. The disadvantage of the current technique was the time- and labor-intensive qualities inherent in manual drusen identification.
Our results revealed an inverse relationship between choroidal blood flow and extent of drusen. This association remained significant for average druse area even after adjustment for age, a known independent risk factor associated with drusen development and decreased choroidal blood flow.18 The fact that the average druse area, independent of age-related factors, was associated with circulatory abnormalities further supports the use of advanced computer-assisted quantitative measurement techniques that allow for precise rather than estimated measurements of drusen size.
While the association between average druse size and choroidal blood flow and volume was strong (p-values of 0.001 and 0.003, respectively) and remained strong after age-adjustment (p=0.004 and 0.017), the association between total drusen area and choroidal blood flow and volume was less strong (p-values of 0.03 and 0.049) and became weaker after age-adjustment (p=0.13 and 0.09). As stated above, large drusen have long been recognized as a risk factor for AMD progression. Possibly, a reason for a stronger association with average druse size than total drusen area may be that in cases of advanced AMD some drusen start coalescing into a few very large drusen and that may skew the association with blood flow. Because a few drusen of large size may have a larger effect on the total drusen area than on average druse size, total drusen area may not be as strongly associated with decreased choroidal blood flow as average druse size.
A decrease in choroidal blood flow may lead to a decrease in the removal of waste material from the RPE-Bruch’s membrane complex, which in turn, may lead to the accumulation of drusen in this disease. However, our cross-sectional study cannot answer with certainty the question of cause-effect relationship. In other words, we cannot conclude whether the decrease of choroidal blood flow causes the development of drusen or whether the presence of drusen leads to decreased blood flow by perhaps causing a barrier to the free distribution of trophic substances that may be needed to maintain a normal, viable choriocapillaris network. Further studies are needed to clarify this question.
Interestingly, our results showing that the number of drusen was not significantly correlated with circulatory parameters suggest that the total area of drusen is more correlated with decreased flow than the actual number of drusen. The possibility that outliers in the data affected the statistical significance of the associations between blood flow parameters and drusen extent was analyzed and found to have a very marginal influence.
Potential confounding factors in this study include the possibility that choroidal blood flow measurements are affected by the presence of drusen. A previous study, however, suggested that drusen may not interfere with LDF blood flow measurements.1 In that study, comparison of blood flow between eyes with foveal drusen and extrafoveal drusen showed no significant differences in any of the circulatory parameters. In addition, there was increased flow pulsatility in eyes with AMD as compared to normal eyes. One would expect pulsatility to be decreased if blood flow measurements were influenced by AMD-related change. These findings suggest that AMD-related change in the outer retina may not have a very large effect on choroidal circulatory measurements in eyes with AMD.
In summary, our study demonstrates an association between decreased choroidal circulation and increased drusen extent. Further longitudinal studies are required to determine whether decreases in choroidal blood flow over time precede the increase in the extent of drusen. Such findings would support the hypothesis that decreases in choroidal blood flow may have an etiologic role in the accumulation of drusen.
Figure 5.
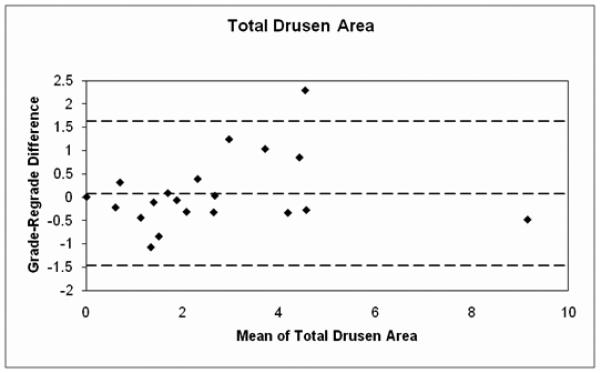
Figure 6.

Figure 7.

Acknowledgments
Support: Supported by National Eye Institute Grant EY12769, the Vivian Simkins Lasko Research Fund, the Nina C. Mackall Trust, and an unrestricted grant from Research to Prevent Blindness.
Footnotes
Disclosures: None of the above authors have any proprietary interest related to this study.
This is a PDF file of an unedited manuscript that has been accepted for publication. As a service to our customers we are providing this early version of the manuscript. The manuscript will undergo copyediting, typesetting, and review of the resulting proof before it is published in its final citable form. Please note that during the production process errors may be discovered which could affect the content, and all legal disclaimers that apply to the journal pertain.
References
- 1.Grunwald JE, Hariprasad SM, DuPont J, et al. Foveolar choroidal blood flow in age-related macular degeneration. Invest Ophthalmol Vis Sci. 1998;39:385–390. [PubMed] [Google Scholar]
- 2.Grunwald JE, Metelitsina TI, Dupont JC, et al. Reduced foveolar choroidal blood flow in eyes with increasing AMD severity. Invest Ophthalmol Vis Sci. 2005 Mar;46(3):1033–8. doi: 10.1167/iovs.04-1050. [DOI] [PubMed] [Google Scholar]
- 3.Metelitsina TI, Grunwald JE, DuPont JC, et al. Foveolar choroidal circulation and choroidal neovascularization in age-related macular degeneration. Invest Ophthalmol Vis Sci. 2008;49(1):358–63. doi: 10.1167/iovs.07-0526. [DOI] [PMC free article] [PubMed] [Google Scholar]
- 4.Riva CE. Basic principles of laser Doppler flowmetry and application to the ocular circulation. Int Ophthalmol. 2001;23:183–189. doi: 10.1023/a:1014433913240. [DOI] [PubMed] [Google Scholar]
- 5.Riva CE, Cranstoun SD, Grunwald JE, Petrig BL. Choroidal blood flow in the foveal region of the human ocular fundus. Invest Ophthalmol Vis Sci. 1994;35:4273–4281. [PubMed] [Google Scholar]
- 6.Riva CE, Harino S, Petrig BL, Shonat RD. Laser-Doppler flowmetry in the optic nerve. Exp Eye Res. 1992;55:499–506. doi: 10.1016/0014-4835(92)90123-a. [DOI] [PubMed] [Google Scholar]
- 7.Petrig BL, Riva CE. Optic nerve head laser Doppler flowmetry: principles and computer analysis. In: Kaiser HJ, Flammer J, Hendrickson P, editors. Ocular Blood Flow. 1996. pp. 120–127. [Google Scholar]
- 8.Riva CE, Mendel M, Petrig BL. Flicker-induced optic nerve blood flow change. In: Kaiser HJ, Flammer J, Hendrickson P, editors. Ocular Blood Flow. 1996. pp. 128–137. [Google Scholar]
- 9.Liang K, Zeger S. Longitudinal data analysis using generalized linear models. Biometrika. 1986;73:13–22. [Google Scholar]
- 10.Bland JM, Altman DG. A note on the use of the intraclass correlation coefficient in the evaluation of agreement between two methods of measurement. Comput Biol Med. 1990;20:337–340. doi: 10.1016/0010-4825(90)90013-f. [DOI] [PubMed] [Google Scholar]
- 11.Jager RD, Mieler WF, Miller JW. Age-related macular degeneration. N Engl J Med. 2008;358:2606–17. doi: 10.1056/NEJMra0801537. [DOI] [PubMed] [Google Scholar]
- 12.The AREDS Research Group The age-related eye disease study (AREDS): Design implications AREDS report no. 1. Control Clin Trial. 1999;20:573–600. doi: 10.1016/s0197-2456(99)00031-8. [DOI] [PMC free article] [PubMed] [Google Scholar]
- 13.Seddon J, Cote J, Rosner B. Progression of age-related macular degeneration association with dietary fat, transunsaturated fat, nuts, and fish intake. Arch Ophthalmol. 2003;121:1728–37. doi: 10.1001/archopht.121.12.1728. [DOI] [PMC free article] [PubMed] [Google Scholar]
- 14.The choroidal neovascularization prevention trial research group laser treatment in eyes with large drusen: short term effects seen in a pilot randomized clinical trial. Ophthalmology. 1997;105:11–23. [PubMed] [Google Scholar]
- 15.Bartlett H, Eperjesi F. Use of Fundus Imaging in Quantification of Age-related Macular Change. Survey of Ophthalmology. 2007;52(6):655–671. doi: 10.1016/j.survophthal.2007.08.022. [DOI] [PubMed] [Google Scholar]
- 16.Shin DS, Jovornik NB, Berger JW. Computer-assisted, interactive fundus image processing for macular drusen quantitation. Ophthalmology. 1999;106(6):1119–1125. doi: 10.1016/S0161-6420(99)90257-9. [DOI] [PubMed] [Google Scholar]
- 17.Friberg TR, Huang L, Palaiou M, Bremer R. Computerized detection and measurement of drusen in age-related macular degeneration. Ophthalmic Surgery, Lasers & Imaging. 2007;38(2):126–134. doi: 10.3928/15428877-20070301-07. [DOI] [PubMed] [Google Scholar]
- 18.Grunwald JE, Hariprasad SM, DuPont J. Effect of aging on foveolar choroidal circulation. Arch. Ophthalmol. 1998;116:150–154. doi: 10.1001/archopht.116.2.150. [DOI] [PubMed] [Google Scholar]