

The data presented in this work suggest that the combined use of R2* and phase data may allow distinction between changes in tissue myelin and iron associated with multiple sclerosis (MS), and that this distinction, combined with the increased resolution and contrast available with high-field-strength MR imaging, may help in characterizing the disease process underlying MS lesions.
Abstract
Purpose:
To elucidate the mechanism of magnetic resonance (MR) imaging contrast in multiple sclerosis (MS) lesion appearance by using susceptibility-weighted imaging and to assess with histologic correlation the role of iron and myelin in generating this MR imaging contrast.
Materials and Methods:
Each patient provided written consent to a human subject protocol approved by an institutional review board. High-spatial-resolution susceptibility-weighted 7.0-T MR images were obtained in 21 patients with MS. Contrast patterns in quantitative phase and R2* images, derived from 7.0-T data, were investigated in 220 areas defined as chronic MS lesions on conventional T2-weighted fluid-attenuated inversion recovery, T2-weighted, and T1-weighted spin-echo images. The presence of positive or negative phase shifts (ie, decreased or increased MR frequency, respectively) was assessed in each lesion. In addition, postmortem MR imaging was performed at 7.0 T and 11.7 T, and its results were correlated with those of immunohistochemical staining specific for myelin, iron, and ferritin.
Results:
The majority (133 [60.5%] of 220) of the identified lesions had a normal phase and reduced R2*. A substantial fraction of the lesions (84 [38.2%] of 220) had negative phase shift, either uniformly or at their rim, and a variety of appearances on R2* maps. These two lesion contrast patterns were reproduced in the postmortem MR imaging study. Comparison with histologic findings showed that, while R2* reduction corresponded to severe loss of both iron and myelin, negative phase shift corresponded to focal iron deposits with myelin loss.
Conclusion:
Combined analysis of 7.0-T R2* and phase data may help in characterizing the pathologic features of MS lesions. The observed R2* decreases suggest profound myelin loss, whereas negative phase shifts suggest a focal iron accumulation.
© RSNA, 2011
Supplemental material: http://radiology.rsna.org/lookup/suppl/doi:10.1148/radiol.11110601/-/DC1
Introduction
Magnetic resonance (MR) imaging is the most powerful preclinical tool for diagnosing and monitoring over time patients with multiple sclerosis (MS). MR imaging is particularly sensitive to the white matter (WM) disease associated with MS because WM changes affect many measurable MR imaging parameters, including proton density (1,2), water diffusion (3), T1 and T2 relaxation times (4–6), and cross relaxation (7,8). Changes in these parameters are interpreted as indicators of myelin and axon loss, which may follow the initial inflammatory process in MS-induced WM lesions.
Over the past few years, ultra-high-field-strength MR imaging systems have become available for clinical research. Owing to combined gains in image contrast and spatial resolution as compared with lower field strength systems, imaging at ultra high fields, including 7.0 T, has the potential to improve the understanding of diseases such as MS. Recent work (9,10) has shown that high-field-strength MR imaging based on magnetic susceptibility contrast may be exquisitely sensitive to MS pathologic features, offering the possibility of improved detection and characterization of the disease. Specifically, strong contrast has been observed in magnitude and phase images of susceptibility-weighted (so-called T2*-weighted) MR imaging examinations. Contrast in susceptibility-weighted images is sensitive to the apparent transverse relaxation time constant (ie, T2*) and resonance frequency shifts of the MR imaging signal induced by local variations in parenchymal magnetic susceptibility. Such susceptibility-weighted contrast has been shown to be highly variable, both within lesions and among different MS lesions in the same patient. This variability may reflect distinct pathologic processes.
Recent studies (11–20) of healthy brains both in vivo and postmortem suggest that magnetic susceptibility contrast may have a number of contributors, including myelin and both heme iron (deoxyhemoglobin) and nonheme iron. The tissue concentration of nonheme iron and myelin are particularly relevant to MS as they may be reflective of the underlying disease process (21). However, it is not clear to what extent iron and myelin contribute to the variable contrast seen in susceptibility-weighted MR imaging. To investigate this, we studied the in vivo and postmortem appearance of MS lesions in susceptibility-weighted high-field-strength MR imaging and compared the findings with those of histochemical staining for iron and myelin.
The purpose of the present study was to elucidate the mechanism of contrast underlying MS lesion appearance at susceptibility-weighted MR imaging and to assess, with histologic demonstration, the role of iron and myelin in generating this MR imaging contrast.
Materials and Methods
In Vivo Study
Study design and patients.—Twenty-four patients (12 men and 12 women; mean age, 46.2 years; range, 28–60 years) with clinically definite MS in accordance with the revised McDonald criteria (22) were included in the study. Each patient provided written consent to a human subject protocol approved by the National Institute of Neurological Disorders and Stroke review board. Detailed patient demographic information is provided in Table 1 (note that three patients were excluded from the patient statistics owing to poor data quality). This retrospective study was performed between January 2009 and December 2010. Within 3 weeks (range, 1–3 weeks), each patient underwent 7.0-T MR imaging and a physical examination to rate disability by using the EDSS (23). Together with the 7.0-T examination, 3.0-T MR imaging was also performed to provide an independent standard for definition of lesions. Patient inclusion and exclusion criteria are as follows: Patients had to be 18–65 years old (inclusive) and free of clinical relapse for at least 3 months at the time of the study. Patients with an EDSS score greater than 6.5 were not included owing to limitations of access to the MR imaging table. Further details of the exclusion criteria are provided in Appendix E1 (online).
Table 1.
Demographic, Clinical, and MR Imaging Characteristics in 21 Patients
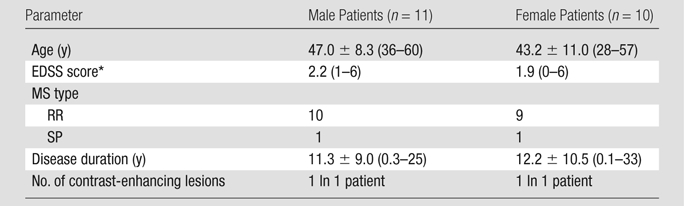
Note.—Unless otherwise specified, data are means ± standard deviations, with ranges in parentheses. EDSS = Expanded Disability Status Scale, RR = relapsing-remitting, SP = secondary progressive.
Data are medians, with ranges in parentheses.
MR imaging.—MR imaging acquisition was performed by two authors (B.Y., with 8 years of experience in MR imaging, and F.B., with 15 years of experience in MR imaging and MS). The 7.0-T examination was performed with an MR imaging unit (GE Medical Systems, Milwaukee, Wis) equipped with a 32-channel detector array (Nova Medical, Wilmington, Mass). To improve temporal signal stability, a real-time modulation of magnetic field shims (up to second order) was performed to compensate for respiration-induced magnetic field changes in the brain (24).
MR imaging with magnetic susceptibility contrast was performed by using a high-spatial-resolution two-dimensional multiecho gradient-echo sequence with the parameters in Table 2. A sensitivity encoding acceleration rate of two was used to minimize the imaging time.
Table 2.
MR Imaging Parameters
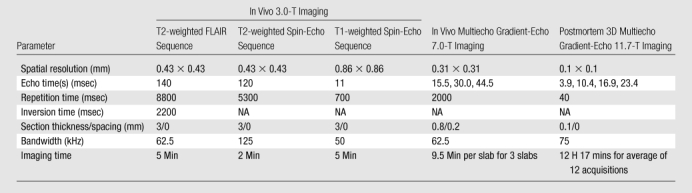
Note.—FLAIR = fluid-attenuated inversion recovery, NA = not applicable, 3D = three-dimensional.
The 3.0-T examination was performed with an MR imaging unit (GE Medical Systems) equipped with an eight-channel head coil. The acquisitions included the following two-dimensional sequences: T2-weighted FLAIR, T2-weighted spin echo, and T1-weighted spin echo, performed before and 10 minutes after the intravenous injection of 0.1 mmol of gadopentetate dimeglumine (Magnevist; Schering, Berlin, Germany) per kilogram of body weight. The imaging parameters are listed in Table 2.
Image analysis.—Image analysis was performed by one author (B.Y.). The 7.0-T images for each echo time were reconstructed by using a phase-sensitive noise-weighted channel combination (25). Quantitative R2* maps were obtained by using exponential fitting to the images acquired at a range of echo times. To remove phase wraps, the complex data were first smoothed by a Gaussian filter (full width at half maximum, 30 voxels) to determine the macroscopic background phase. Continuous phase maps were then generated after subtraction of the phase background from the original data. Negative phase shifts (darkening in the maps) corresponded to increased MR imaging resonance frequency, generally indicating paramagnetic susceptibility shifts. Data processing was performed with software code created in house by using Interactive Data Language, version 7.0 (ITT Visual Information Solutions, White Plains, NY).
In each patient, 3.0-T images (T1-weighted spin echo, T2-weighted spin echo, and FLAIR) were registered to the 7.0-T gradient-echo image by using the coregistration algorithm implemented in SPM8 (Wellcome Trust Centre for Neuroimaging, London, England). Detailed procedures are discussed in Appendix E1 (online).
Lesion identification and classification.—The lesions were identified on 7.0-T R2* and phase maps. To ensure that only lesions defined at conventional 3.0-T MR imaging were included in the study, all the lesions identified at 7.0 T were counted as lesions if they were confirmed as hyperintense WM lesions on T2-weighted spin-echo and T2-weighted FLAIR images at 3.0 T (26). Lesion identification at 7.0 T was performed by two authors (B.Y. and F.B.). In case of disagreement, the opinion of an expert senior investigator (J.H.D., with 29 years of experience in MR imaging) was sought and followed. On the basis of their appearance in the 7.0-T phase and R2* images, and as in previous work (9), a distinction was made between lesions that had uniform intensity and lesions that had pronounced rim contrast. For both R2* and phase maps, the lesions were classified into the following five categories: (a) Hypointense lesions, which showed hypointense signal throughout the lesion compared with the surrounding normal-appearing WM (NAWM); (b) hyperintense lesions, which showed hyperintense signal throughout the lesion compared with the surrounding NAWM; (c) hypointense-rim lesions, which showed a hypointense rim signal while being either hyper- or isointense in their inner portion; (d) hyperintense-rim lesions, which showed hyperintense rim signal while being either hypo- or isointense in their inner portion; and (e) isointense lesions, which showed normal contrast compared with the surrounding tissue.
Postmortem Study
The postmortem MS specimen used in this study was obtained from a 70-year-old man, who died of pneumonia linked to secondary progressive MS. Details of his clinical history have been described previously (2). Briefly, at the time of his death, the patient was bedridden (EDSS score, 8.5) and had had MS for more than 30 years.
Within a few hours after death, the cadaver was brought for autopsy. The brain was removed and immediately fixed in 4% formalin for 2 weeks; it was then cut into 10-mm-thick coronal slices. Each slice was fixed in 4% formalin until imaging. MR images were obtained 36 months after death.
Postmortem MR imaging.—Each brain slice was placed into flat, cylindric, custom-fabricated tissue containers (2) and was imaged in 4% formalin solution. The MR imaging examination was performed with the human 7.0-T imaging unit, which was equipped with a 24-channel receive-only detector array specifically designed for imaging these tissue slabs. A three-dimensional multiecho gradient-echo sequence was performed with the following parameters: echo times, 8.7, 25.2, 41.7, and 58.2 msec; repetition time, 200 msec; spatial resolution, 0.2-mm isotropic; and flip angle = 20°. After inspection of the reconstructed images, a few characteristic lesion areas were cut into 2 × 2 × 1-cm3 pieces and imaged with the 11.7-T MR imaging unit (Bruker BioSpin, Ettlingen, Germany) with 0.1 mm isotropic resolution and echo times of 3.9, 10.4, 16.9, and 23.4 msec (see Table 2 for detailed imaging parameters). The R2* and phase maps were calculated by using the same methods used in the in vivo experiments.
Immunohistochemistry.—After MR imaging, the brain was embedded in paraffin. Small segments (2 × 4 × 3 mm3 each) were cut in 10-μm-thick serial slices with a microtome (Carl Zeiss MicroImaging, Thornwood, NY) and mounted onto Superfrost glass slides (Thermo Fisher Scientific, Waltham, Mass). Sections were deparaffinized prior to histologic staining. Perls staining for iron and standard Luxol fast blue staining for myelin, as well as immunochemical antibody staining for ferritin, were performed on consecutive slices, and the results were compared with MR images. Control stains were also performed with each type of stain. Details of the staining procedures used in this study are discussed in Appendix E1 (online).
Results
In Vivo Results
Data in three patients had to be excluded from the analysis because of severe image artifacts related to head movements during the acquisition. Good-quality susceptibility-weighted MR imaging data were obtained in the remaining 21 patients with MS. The majority of the patients had RR MS in a stable phase (ie, no active lesions). A total of two contrast-enhancing lesions were seen in two patients after gadopentetate dimeglumine injection, suggesting acute lesions. These two lesions were excluded from our analysis, which focused only on chronic lesions.
Both magnitude and phase images showed a varied appearance of MS lesions within and across patients. This variation was also observed in the R2* data and, to a lesser extent, in the conventional T1- and T2-weighted data obtained at 3.0 T (Figs 1–3). Table 3 reports the details of the chronic lesion classification, including the distinction between lesions with and lesions without rim contrast on the 7.0-T images. A total of 220 sharp and demarcated focal lesions were counted on the 7.0-T R2* and phase images in all the patients. All of these lesions were hyperintense on the T2-weighted spin-echo and FLAIR images.
Figure 1:

Transverse MR images in 50-year-old woman with RR MS, an EDSS score of 1.0, and 22 years of disease show nodular lesions with uniform interior. Lesion contrast varies across various image types, including susceptibility-weighted magnitude, phase, and R2* images obtained at 7.0 T and FLAIR, T2-weighted spin-echo (T2SE), and T1-weighted spin-echo (T1SE) images obtained at 3.0 T. Intensity scaling of each image was adjusted to accentuate the lesions. Three lesions (solid arrows) appear in all image types; a fourth one (dotted arrow) appears in all images except the phase image.
Figure 3:

Transverse MR images in 49-year-old woman with RR MS, an EDSS score of 4, and 20.2 years of disease show ring-type lesions. Lesion contrast varies across various image types, including susceptibility-weighted magnitude, phase, and R2* images obtained at 7.0 T and FLAIR, T2-weighted spin-echo (T2SE), and T1-weighted spin-echo (T1SE) images obtained at 3.0 T. Intensity scaling of each image was adjusted to accentuate the lesions.
Table 3.
Lesion Appearance at 7.0 T
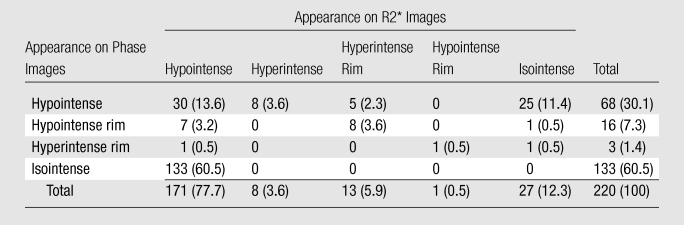
Note.—Data are numbers of lesions, with percentages in parentheses.
Most lesions had a reduced R2* and normal phase (133 [60.5%] of 220) or a reduced R2* and negative phase shift (30 [13.6%] of 220 [Table 3]). Of the 171 lesions with reduced R2*, 130 (76.0%) appeared as hypointense lesions on 3.0-T T1-weighted images; these are also known as “T1 black hole” lesions (27). A substantial fraction of the lesions (total, 84 [38.2%] of 220) had negative phase shift, either uniformly (68 [30.1%] of 220) or at their rim (16 [7.3%] of 220), and a variety of appearances on R2* maps. Twenty-five (11.4%) of the 220 lesions had a normal R2* and negative phase shift. Sixteen (7.3%) of the 220 lesions showed negative phase shift at their periphery (ring-type lesions). This lesion type occurred in 10 of the 21 patients. The negative phase shift coincided with either a normal or an increased R2* at the rim. Of the 16 lesions with rim contrast, 15 (93.8%) had reduced intensity (ie, were T1 black holes) on T1-weighted spin-echo images. No positive phase shift lesions were found among the 220 total lesions; therefore, there is no “hyperintense” row in Table 3.
Examples of these most prevalent lesion types are shown in Figures 1–3. Figure 1 shows examples of four typical lesions with R2* decrease, three of which also had negative phase shift. The lesions are visible on the 3.0-T FLAIR and T2-weighted spin-echo images as well and are faintly visible on the T1-weighted spin-echo image. Figure 2 shows an example of lesion whose signal is relatively uniform on the T2-weighted spin-echo image but has a decreased R2* in the inner portion and a negative phase shift at its rim. A hyperintense rim is also visible on the T1-weighted spin-echo image. On the FLAIR image, the lesion appears larger. Figure 3 shows another example of a lesion with a thin rim of negative phase shift and increased R2*. This rim is not visible on the 3.0-T T1-weighted spin-echo and T2-weighted spin-echo images, possibly because of the reduced contrast and/or the inferior spatial resolution. Another detail lost on the 3.0-T images is the conspicuous veins that appear to traverse many of the lesions on the 7.0-T magnitude and phase images.
Figure 2:

Transverse MR images in 40-year-old man with RR MS, an EDSS score of 2.5, and 7.5 years of disease show lesion with inhomogeneous intensity and contrast at its rim. Lesion contrast varies across various image types, including susceptibility-weighted magnitude, phase, and R2* images obtained at 7.0 T and FLAIR, T2-weighted spin-echo (T2SE), and T1-weighted spin-echo (T1SE) images obtained at 3.0 T. Intensity scaling of each image was adjusted to accentuate the lesions.
Postmortem MR Imaging and Immunohistochemical Analysis
The postmortem study reproduced several of the lesion types seen in vivo (Figs 4–6). As shown in Figure 4, excellent MR imaging quality was obtained in the tissue slabs at 7.0 T, facilitating lesion detection. Two lesion areas selected from these MR images (white rectangles in Fig 4) were further processed for imaging at 11.7 T to obtain the highest contrast and spatial resolution (Figs 5 and 6).
Figure 4:
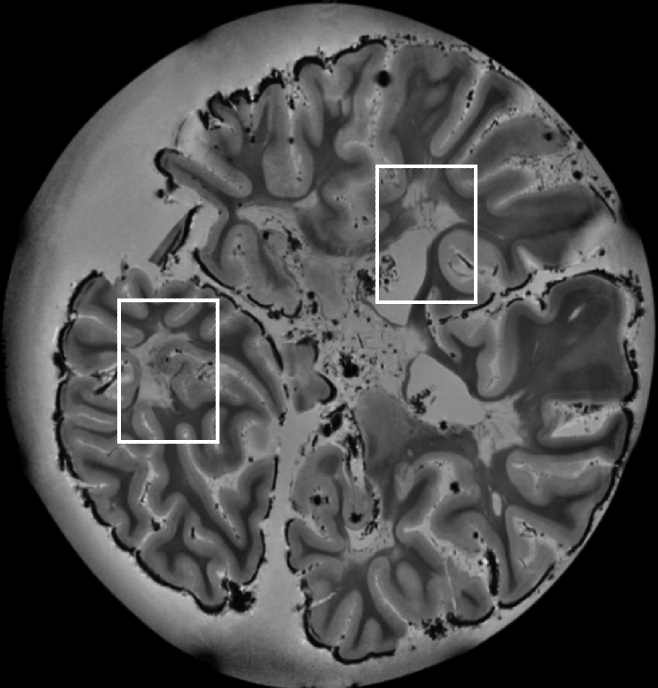
7.0-T MR image (reconstructed from a three-dimensional gradient-echo image with 0.2-mm isotropic resolution, an echo time of 25.2 msec, and a repetition time of 200 msec) of postmortem tissue sample used for histologic comparison. Rectangles = areas selected for further analysis, results of which are shown in Figures 5 and 6.
Figure 6:

Comparison of 11.7-T MR images (magnitude, phase, and R2*) with results of histochemical stains for myelin, iron, and ferritin in postmortem MS tissue with lesions in the temporal lobe. MR imaging parameters were as follows: echo time, 10.4 msec; and spatial resolution, 0.1-mm isotropic. C = cortical gray matter, L = MS lesion plaque, W = WM. Yellow arrows = areas of large iron deposits at the edge of the lesion. Red arrow = area with preserved iron and myelin inside the lesion.
Figure 5:

Comparison of 11.7-T MR images (magnitude, phase, and R2*) with results of histochemical stains for myelin, iron, and ferritin in postmortem MS tissue with periventricular lesions. MR imaging parameters were as follows: echo time, 10.4 msec; and spatial resolution, 0.1-mm isotropic. C = cortical gray matter, L = MS lesion plaque, W = WM.
Figure 5 shows a periventricular lesion with strong R2* reduction but close-to-normal phase. This contrast pattern matches that of the dominant in vivo lesion group reported in Table 3, as well as that of the lesions shown in Figure 1. Histochemical staining showed that the R2* reduction was matched by a low content of iron and myelin in the presence of ferritin. Outside the lesions, MR imaging magnitude and R2* showed a robust contrast between gray matter and WM. The histologic stains indicated that both iron and myelin were more concentrated in WM than in gray matter, consistent with the notion that both myelin and iron increase R2*. Ferritin also had a higher concentration in WM, consistent with the distribution of iron. However, this consistency was not seen in the lesion area, where there was reduced iron content but little change in the ferritin content.
In Figure 6, a large MS plaque in the WM between cortical gyri in the temporal lobe can be seen in the magnitude MR image. Negative phase shift and R2* increase are seen at the rim of the lesion, while the lesion center has normal phase and reduced R2*. This rim contrast matches the in vivo finding presented in Figures 2 and 3. Comparison with results of histochemical staining shows that the rim contrast is coincident with a positive Perls stain, suggesting the presence of iron. Notably, the reduced R2* in the center of the lesions coincides with reduced myelin staining and, to a lesser extent, reduced iron staining. This inner portion of the lesion appears to have a thin section of almost normal iron and myelin, which is visible on the R2* map but not in the phase map. Ferritin appears to be increased in the rim and variable in the center of the lesion.
Discussion
Susceptibility-weighted 7.0-T MR imaging data (R2* and phase images) obtained in 21 patients with MS demonstrated highly heterogeneous lesion contrast and revealed lesion details not seen with conventional MR imaging. This heterogeneity was present across and in some cases within lesions. Consistent with previous work (9), lesions with and without pronounced rim contrast were observed. These lesion aspects were reproduced at MR imaging of postmortem tissues. The correlation between MR images and the iron and myelin stains suggests that the varying MR imaging phase and R2* contrast is due to varying levels of iron and myelin.
The appearance of MS lesions often differed between phase and R2* images in our study. Notably, in both in vivo and postmortem images, regions with substantial R2* reduction often had normal phase. Our interpretation is that myelin and iron have a different effect on R2* and phase contrasts. While both iron and myelin increase R2* relaxation rate, myelin may counteract the paramagnetic susceptibility shift associated with iron. This hypothesized diamagnetic shift associated with myelin proposed in our model is consistent with recent high-field-strength MR imaging observations in the line of Gennari, a myelin-rich layer in human primary visual cortex (28), and the absence of phase contrast between cerebrospinal fluid and WM in this and previous work (11), despite the strongly different iron and myelin concentrations of the two substances.
Results of number of recent studies, including iron extraction studies (28,29), demyelinating animal models with shiverer mice (30) and cuprizone-treated mice (31), and correlative studies between MR imaging and histochemically derived measures of tissue iron (12,20), have suggested that iron and myelin are the main compounds that contribute to the R2* and phase contrast in WM and cortical gray matter. In particular, in the iron extraction experiment, Fukunaga and colleagues (28) reported subtle signs of contrast reversal after iron extraction in postmortem brain tissue, suggesting a small opposing frequency shift caused by the remaining myelin. Furthermore, the sensitivity of MR imaging is adequate to depict even small variations in iron levels. For example, iron levels well below the naturally occurring levels of about 40 μg per gram of tissue in gray matter and WM can be detected, as described previously (28). Therefore, tissue iron increases suggested by the staining data will invariably lead to increases in R2*, except in cases where the iron increase is accompanied by myelin decrease. Conversely, R2* increases, as seen in the rims of ring lesions, result from either iron increases or myelin increases. The latter is highly unlikely, given that MS is a demyelinating disease, and the staining results in our study do not show a myelin increase in the rim.
On the basis of this phenomenon, our tentative interpretation of the MR imaging findings is summarized in Table 4, which describes the results we obtained in the postmortem experiment. In the example of non-ring lesions, reduced R2* and phase cancellation effect were observed inside the lesions because both iron and myelin concentration were low. In the other example, we have found that iron accumulated at the rim of the ring type of lesion, where no prominent myelin deposition was observed. The MR imaging result showed that in this area (high iron, normal myelin), both phase and R2* had a prominent contrast (high R2* values and negative frequency shift). However, in the inner part of the lesion, where iron and myelin were both preserved, an increased R2* but little frequency shift was observed.
Table 4.
Hypothetical Influence of Tissue Content Change on MR Images
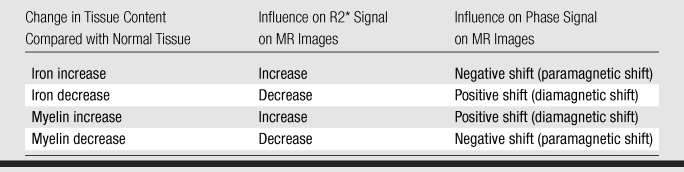
The results described in Table 4 allow us to further analyze the in vivo findings summarized in Table 3. Lesions with reduced R2* and normal phase may have substantial reduction in myelin. This tissue loss may lead to a concomitant increase in extracellular space and water accumulation, leading to an increase in T1. This would explain the presence of reduced T1-hypointense signal often associated with these lesions.
Conversely, areas of negative phase shift and normal or increased R2*, often found at the rim and periphery of lesions, may indicate increased iron with relatively preserved myelin content. This is in line with an earlier observation of iron accumulation at the periphery of chronic MS lesions and may indicate ongoing demyelination in the absence of inflammation (21). The methods used in the current study offer the opportunity of detecting this particular disease process in vivo, which may lead to improved characterization of MS in individual patients.
There may be contributions from other compounds as well, but these are most likely to be secondary. One way to establish quantitatively the contribution of iron would be to perform MR imaging before and after chemical extraction of iron. We and others have done this in normal tissue for gray matter and WM (28,29). Despite the lack of these data in the present experiment, the several pieces of circumstantial evidence that we have make it highly likely that iron is the dominant source of the rim contrast.
The precise cellular localization of the iron is an intriguing question and the topic of an ongoing investigation in our group. Several hypotheses may be postulated. First, one can postulate that iron is within macrophage and microglia cells, surrounding the lesions in a ring-like fashion. Second, one can argue that oligodendrocytes are an important source of iron (32–34). Iron in microglia may indicate chronic inflammation, whereas iron in oligodendrocytes has been suggested to support myelin production, as it is a required cofactor for cholesterol and lipid biosynthesis, as well as for support of the oxidative metabolism, which occurs in oligodendrocytes at a higher rate than in other brain cells (35).
In normal brain, much of the nonheme iron that supports oligodendrocytes is stored in ferritin. From our immunochemical ferritin stain results, we could not firmly establish whether this also holds true in MS, as the presence of iron was not always mirrored by that of ferritin and vice versa. The data presented in the current study suggest that in many lesions, ferritin iron may have been effectively removed from the tissue. We explain this finding by hypothesizing that the amount of iron per ferritin molecule may vary and cannot be deduced from the MR imaging data. It is possible that the abnormal iron observed may partly reflect free iron released during either inflammation or demyelination (36).
The formaldehyde fixation process may have effects on the transition metal contents in the brain tissues and has the potential to leach the content of iron. The degree of leaching is time dependent and very different for different elements. A study (37) that used high-spatial-resolution inductively coupled plasma mass spectrometry to measure 19 metal elements in the human brain showed that there was moderate iron leaching after long-term storage (about 20 years), compared with other metal elements. The concentration of iron in the stored formalin in which the human brains had been stored for years was about 20 times larger than that in the fresh formalin (565 vs 31 μg/L). However, the amount of leached iron was still small compared with the total iron content in the brain (313 000 μg/kg dry weight). Another study (38) investigated iron-loaded spleen tissue immersed over a period of 200 days. The result showed that over the first 60 days, there was a steady leakage from the tissue until 3% of the iron had been lost, but thereafter no further leaching was detected. However, a recent experimental approach using atomic absorption spectroscopy (39) revealed that formalin fixation lasting 4 years leads to 43% of the average brain iron reduction. Nevertheless, since the leaching effect is a global effect to the tissue, it may cause some bias but is unlikely to affect the conclusion of our study.
A few limitations of our study need to be addressed. An important one is the fact that only one postmortem brain was available for investigation, which somewhat limits the generalizability of the result. And although multiple lesion areas were examined in the postmortem experiment, not all lesion types seen in vivo were seen in the tissue samples. Thus, questions remain regarding the other lesion types not present in the postmortem data. Second, it is important to consider that besides iron and myelin, other factors such as fiber orientation and tissue microstructure may play a role in contribution to the image contrast. A third limitation was the current lack of information about the cellular localization of the iron. Although it is generally assumed that most iron in normal brain is present in the form of storage iron in hemosiderin and ferritin molecules (40), it would be interesting to find out whether this continues to be the case in diseases such as MS and whether this storage occurs in microglia, astrocytes, or other cell types. The latter was outside the focus of the present investigation, which was limited to establishing the role of iron and myelin in the generation of susceptibility contrast in MS tissues.
In conclusion, the data presented in this work suggest that the combined use of R2* and phase data may allow distinction between changes in tissue myelin and iron associated with MS, and this distinction, combined with the increased spatial resolution and contrast available with high-field-strength MR imaging, may provide great help in characterizing the disease process underlying MS lesions.
Advances in Knowledge.
The majority (133 [60.5%] of 220) of identified white matter lesions in patients with multiple sclerosis (MS) at 7.0-T MR imaging have a normal resonance frequency and a reduced R2* value.
A substantial fraction of MS lesions (84 [38.2%] 220) show increased MR imaging resonance frequency either uniformly or at their periphery, as well as variable R2* values.
Comparison with histologic findings showed that R2* reduction corresponded to severe loss of both iron and myelin, while resonance frequency increases corresponded to focal iron deposits with myelin loss.
Implication for Patient Care.
Combined analysis of R2* and phase data at 7.0 T may help in characterizing the pathologic features of MS lesions.
Disclosures of Potential Conflicts of Interest: B.Y. No potential conflicts of interest to disclose. F.B. No potential conflicts of interest to disclose. E.M. No potential conflicts of interest to disclose. H.M. No potential conflicts of interest to disclose. P.v.G. No potential conflicts of interest to disclose. F.K.C. No potential conflicts of interest to disclose.
Supplementary Material
Acknowledgments
We thank Drs Xin Yu and Steve Dodd for their assistances with the imaging at 11.7 T. We thank Joan Ohayon, CRNP, and Helen Griffith, RN, as well as our patient coordinator, Melissa Goldstein, BS, for assistance with patients.
Received March 22, 2011; revision requested June 1; revision received July 27; accepted August 3; final version accepted August 15.
Funding: This research was supported by the intramural program of the National Institute of Neurological Disorders and Stroke at the National Institutes of Health.
Abbreviations:
- EDSS
- Expanded Disability Status Scale
- FLAIR
- fluid-attenuated inversion recovery
- MS
- multiple sclerosis
- RR
- relapsing-remitting
- WM
- white matter
References
- 1.Gilmore CP, DeLuca GC, Bö L, et al. Spinal cord neuronal pathology in multiple sclerosis. Brain Pathol 2009;19(4):642–649 [DOI] [PMC free article] [PubMed] [Google Scholar]
- 2.Bagnato F, Yao B, Cantor F, et al. Multisequence-imaging protocols to detect cortical lesions of patients with multiple sclerosis: observations from a post-mortem 3 Tesla imaging study. J Neurol Sci 2009;282(1-2):80–85 [DOI] [PMC free article] [PubMed] [Google Scholar]
- 3.Goldberg-Zimring D, Mewes AU, Maddah M, Warfield SK. Diffusion tensor magnetic resonance imaging in multiple sclerosis. J Neuroimaging 2005;15(4,Suppl):68S–81S [DOI] [PubMed] [Google Scholar]
- 4.Parry A, Clare S, Jenkinson M, Smith S, Palace J, Matthews PM. White matter and lesion T1 relaxation times increase in parallel and correlate with disability in multiple sclerosis. J Neurol 2002;249(9):1279–1286 [DOI] [PubMed] [Google Scholar]
- 5.Bakshi R, Benedict RH, Bermel RA, et al. T2 hypointensity in the deep gray matter of patients with multiple sclerosis: a quantitative magnetic resonance imaging study. Arch Neurol 2002;59(1):62–68 [DOI] [PubMed] [Google Scholar]
- 6.Laule C, Vavasour IM, Moore GR, et al. Water content and myelin water fraction in multiple sclerosis: a T2 relaxation study. J Neurol 2004;251(3):284–293 [DOI] [PubMed] [Google Scholar]
- 7.Karampekios S, Papanikolaou N, Papadaki E, et al. Quantification of magnetization transfer rate and native T1 relaxation time of the brain: correlation with magnetization transfer ratio measurements in patients with multiple sclerosis. Neuroradiology 2005;47(3):189–196 [DOI] [PubMed] [Google Scholar]
- 8.Chen JT, Kuhlmann T, Jansen GH, et al. Voxel-based analysis of the evolution of magnetization transfer ratio to quantify remyelination and demyelination with histopathological validation in a multiple sclerosis lesion. Neuroimage 2007;36(4):1152–1158 [DOI] [PubMed] [Google Scholar]
- 9.Hammond KE, Metcalf M, Carvajal L, et al. Quantitative in vivo magnetic resonance imaging of multiple sclerosis at 7 Tesla with sensitivity to iron. Ann Neurol 2008;64(6):707–713 [DOI] [PubMed] [Google Scholar]
- 10.Haacke EM, Makki M, Ge Y, et al. Characterizing iron deposition in multiple sclerosis lesions using susceptibility weighted imaging. J Magn Reson Imaging 2009;29(3):537–544 [DOI] [PMC free article] [PubMed] [Google Scholar]
- 11.Duyn JH, van Gelderen P, Li TQ, de Zwart JA, Koretsky AP, Fukunaga M. High-field MRI of brain cortical substructure based on signal phase. Proc Natl Acad Sci U S A 2007;104(28):11796–11801 [DOI] [PMC free article] [PubMed] [Google Scholar]
- 12.Li TQ, Yao B, van Gelderen P, et al. Characterization of T(2)* heterogeneity in human brain white matter. Magn Reson Med 2009;62(6):1652–1657 [DOI] [PMC free article] [PubMed] [Google Scholar]
- 13.Haacke EM, Cheng NY, House MJ, et al. Imaging iron stores in the brain using magnetic resonance imaging. Magn Reson Imaging 2005;23(1):1–25 [DOI] [PubMed] [Google Scholar]
- 14.Ogg RJ, Langston JW, Haacke EM, Steen RG, Taylor JS. The correlation between phase shifts in gradient-echo MR images and regional brain iron concentration. Magn Reson Imaging 1999;17(8):1141–1148 [DOI] [PubMed] [Google Scholar]
- 15.Sedlacik J, Helm K, Rauscher A, Stadler J, Mentzel HJ, Reichenbach JR. Investigations on the effect of caffeine on cerebral venous vessel contrast by using susceptibility-weighted imaging (SWI) at 1.5, 3 and 7 T. Neuroimage 2008;40(1):11–18 [DOI] [PubMed] [Google Scholar]
- 16.Zhong K, Leupold J, von Elverfeldt D, Speck O. The molecular basis for gray and white matter contrast in phase imaging. Neuroimage 2008;40(4):1561–1566 [DOI] [PubMed] [Google Scholar]
- 17.He X, Yablonskiy DA. Biophysical mechanisms of phase contrast in gradient echo MRI. Proc Natl Acad Sci U S A 2009;106(32):13558–13563 [DOI] [PMC free article] [PubMed] [Google Scholar]
- 18.Schäfer A, Wharton S, Gowland P, Bowtell R. Using magnetic field simulation to study susceptibility-related phase contrast in gradient echo MRI. Neuroimage 2009;48(1):126–137 [DOI] [PubMed] [Google Scholar]
- 19.Lee J, Hirano Y, Fukunaga M, Silva AC, Duyn JH. On the contribution of deoxy-hemoglobin to MRI gray-white matter phase contrast at high field. Neuroimage 2010;49(1):193–198 [DOI] [PMC free article] [PubMed] [Google Scholar]
- 20.Yao B, Li TQ, Gelderen P, Shmueli K, de Zwart JA, Duyn JH. Susceptibility contrast in high field MRI of human brain as a function of tissue iron content. Neuroimage 2009;44(4):1259–1266 [DOI] [PMC free article] [PubMed] [Google Scholar]
- 21.Craelius W, Migdal MW, Luessenhop CP, Sugar A, Mihalakis I. Iron deposits surrounding multiple sclerosis plaques. Arch Pathol Lab Med 1982;106(8):397–399 [PubMed] [Google Scholar]
- 22.Polman CH, Reingold SC, Edan G, et al. Diagnostic criteria for multiple sclerosis: 2005 revisions to the “McDonald Criteria”. Ann Neurol 2005;58(6):840–846 [DOI] [PubMed] [Google Scholar]
- 23.Kurtzke JF. Rating neurologic impairment in multiple sclerosis: an expanded disability status scale (EDSS). Neurology 1983;33(11):1444–1452 [DOI] [PubMed] [Google Scholar]
- 24.van Gelderen P, de Zwart JA, Starewicz P, Hinks RS, Duyn JH. Real-time shimming to compensate for respiration-induced B0 fluctuations. Magn Reson Med 2007;57(2):362–368 [DOI] [PubMed] [Google Scholar]
- 25.de Zwart JA, Ledden PJ, van Gelderen P, Bodurka J, Chu R, Duyn JH. Signal-to-noise ratio and parallel imaging performance of a 16-channel receive-only brain coil array at 3.0 Tesla. Magn Reson Med 2004;51(1):22–26 [DOI] [PubMed] [Google Scholar]
- 26.Filippi M, Gawne-Cain ML, Gasperini C, et al. Effect of training and different measurement strategies on the reproducibility of brain MRI lesion load measurements in multiple sclerosis. Neurology 1998;50(1):238–244 [DOI] [PubMed] [Google Scholar]
- 27.Bagnato F, Jeffries N, Richert ND, et al. Evolution of T1 black holes in patients with multiple sclerosis imaged monthly for 4 years. Brain 2003;126(Pt 8):1782–1789 [DOI] [PubMed] [Google Scholar]
- 28.Fukunaga M, Li TQ, van Gelderen P, et al. Layer-specific variation of iron content in cerebral cortex as a source of MRI contrast. Proc Natl Acad Sci U S A 2010;107(8):3834–3839 [DOI] [PMC free article] [PubMed] [Google Scholar]
- 29.Schenck JF, Zimmerman EA, Li Z, et al. High-field magnetic resonance imaging of brain iron in Alzheimer disease. Top Magn Reson Imaging 2006;17(1):41–50 [DOI] [PubMed] [Google Scholar]
- 30.Liu C, Li W, Johnson GA, Wu B. High-field (9.4 T) MRI of brain dysmyelination by quantitative mapping of magnetic susceptibility. Neuroimage 2011;56(3):930–938 [DOI] [PMC free article] [PubMed] [Google Scholar]
- 31.Lee J, Yao B, Palumbo S, et al. MRI T2* relaxation and frequency contrast changes in cuprizone-fed mice. 17th Organization for Human Brain Mapping Annual Meeting, Quebec City, Canada, 2011 [Google Scholar]
- 32.Dietrich RB, Bradley WG., Jr Iron accumulation in the basal ganglia following severe ischemic-anoxic insults in children. Radiology 1988;168(1):203–206 [DOI] [PubMed] [Google Scholar]
- 33.Schenck JF. Imaging of brain iron by magnetic resonance: T2 relaxation at different field strengths. J Neurol Sci 1995;134(Suppl):10–18 [DOI] [PubMed] [Google Scholar]
- 34.Connor JR, Menzies SL, St Martin SM, Mufson EJ. A histochemical study of iron, transferrin, and ferritin in Alzheimer’s diseased brains. J Neurosci Res 1992;31(1):75–83 [DOI] [PubMed] [Google Scholar]
- 35.Connor JR, Menzies SL. Relationship of iron to oligodendrocytes and myelination. Glia 1996;17(2):83–93 [DOI] [PubMed] [Google Scholar]
- 36.Levine SM, Chakrabarty A. The role of iron in the pathogenesis of experimental allergic encephalomyelitis and multiple sclerosis. Ann N Y Acad Sci 2004;1012:252–266 [DOI] [PubMed] [Google Scholar]
- 37.Gellein K, Flaten TP, Erikson KM, Aschner M, Syversen T. Leaching of trace elements from biological tissue by formalin fixation. Biol Trace Elem Res 2008;121(3):221–225 [DOI] [PubMed] [Google Scholar]
- 38.Chua-anusorn W, Webb J, Macey DJ, Pootrakul P, St Pierre TG. The effect of histological processing on the form of iron in iron-loaded human tissues. Biochim Biophys Acta 1997;1360(3):255–261 [DOI] [PubMed] [Google Scholar]
- 39.Schrag M, Dickson A, Jiffry A, Kirsch D, Vinters HV, Kirsch W. The effect of formalin fixation on the levels of brain transition metals in archived samples. Biometals 2010;23(6):1123–1127 [DOI] [PMC free article] [PubMed] [Google Scholar]
- 40.Schenck JF. Magnetic resonance imaging of brain iron. J Neurol Sci 2003;207(1-2):99–102 [DOI] [PubMed] [Google Scholar]
Associated Data
This section collects any data citations, data availability statements, or supplementary materials included in this article.