

Results suggest that digital breast tomosynthesis may be comparable to clinical mammographic spot views for breast mass characterization.
Abstract
Purpose:
To determine if digital breast tomosynthesis (DBT) performs comparably to mammographic spot views (MSVs) in characterizing breast masses as benign or malignant.
Materials and Methods:
This IRB-approved, HIPAA-compliant reader study obtained informed consent from all subjects. Four blinded Mammography Quality Standards Act–certified academic radiologists individually evaluated DBT images and MSVs of 67 masses (30 malignant, 37 benign) in 67 women (age range, 34–88 years). Images were viewed in random order at separate counterbalanced sessions and were rated for visibility (10-point scale), likelihood of malignancy (12-point scale), and Breast Imaging Reporting and Data System (BI-RADS) classification. Differences in mass visibility were analyzed by using the Wilcoxon matched-pairs signed-ranks test. Reader performance was measured by calculating the area under the receiver operating characteristic curve (Az) and partial area index above a sensitivity threshold of 0.90 (Az0.90) by using likelihood of malignancy ratings. Masses categorized as BI-RADS 4 or 5 were compared with histopathologic analysis to determine true-positive results for each modality.
Results:
Mean mass visibility ratings were slightly better with DBT (range, 3.2–4.4) than with MSV (range, 3.8–4.8) for all four readers, with one reader’s improvement achieving statistical significance (P = .001). The Az ranged 0.89–0.93 for DBT and 0.88–0.93 for MSV (P ≥ .23). The Az(0.90) ranged 0.36–0.52 for DBT and 0.25–0.40 for MSV (P ≥ .20). The readers characterized seven additional malignant masses as BI-RADS 4 or 5 with DBT than with MSV, at a cost of five false-positive biopsy recommendations, with a mean of 1.8 true-positive (range, 0–3) and 1.3 false-positive (range, −1 to 4) assessments per reader.
Conclusion:
In this small study, mass characterization in terms of visibility ratings, reader performance, and BI-RADS assessment with DBT was similar to that with MSVs. Preliminary findings suggest that MSV might not be necessary for mass characterization when performing DBT.
© RSNA, 2011
Introduction
Mammographic spot compression views, with or without magnification, are a mainstay of diagnostic breast imaging for mass characterization. They reduce noise from scattered radiation, reduce superimposition of overlapping tissue, and improve the effective spatial resolution of the detector to enhance tissue contrast, margin visibility, and image detail (1). The utility of these views was first established in the literature in the late 1980s. It was shown that these views improved mammographic specificity by providing additional characterization of 73 of 75 (97%) equivocal mammographic lesions (1). The efficacy of spot compression magnification views and tangential views was prospectively demonstrated when these additional views depicted an additional 9% of palpable breast masses and helped better predict their benign or malignant nature in 77% (23 of 30) of cases compared with 69% (18 of 26) of cases with standard views (2).
In the late 1990s, the advent of digital mammography allowed the introduction of breast tomosynthesis as a potential clinical imaging modality. In an early reader study, in which two phantoms and four mastectomy specimens were used, the authors (3) reported that tomosynthesis images were superior to conventional images in classifying five of six lesions. As was done with spot images a decade earlier, it was suggested that tomosynthesis might improve mammographic specificity by eliminating overlapping tissues, thereby enhancing margin visibility, particularly in dense breasts (3). Findings of additional studies have shown the potential benefit of digital breast tomosynthesis (DBT) (4–11). Authors (12) of one preliminary retrospective study (n = 25) have reported readers’ subjective preference for using DBT versus additional mammographic views for diagnosis of 17 masses, one architectural distortion, four asymmetries, and three cases of multiple cysts. Our purpose was to determine if DBT performs comparably to mammographic spot views (MSVs) in characterizing breast masses as benign or malignant.
Materials and Methods
Study Population
Institutional review board approval was obtained for this Health Insurance Portability and Accountability Act–compliant protocol, with written informed consent for DBT or combined DBT and whole-breast ultrasonography (US). Consecutive consenting female patients were enrolled after clinical recommendation for a breast interventional procedure (Breast Imaging Reporting and Data System [BI-RADS] category 4 or 5) had been made based on clinical diagnostic breast imaging findings beginning March 2006.
A Mammography Quality Standards Act–certified radiologist (M.A.R.) with 18 years of breast imaging and 5 years of tomosynthesis experience, who had knowledge of clinical data and did not participate in the reader study, determined the study population. First, of the 260 consecutive cases in the DBT projects between July 20, 2006 and May 28, 2008, 108 benign cases were randomly not selected for review to accrue a cancer-enriched study group and 31 cases with only microcalcifications were not selected for review because this study focused on characterization of masses. Next, review of the medical records and clinically acquired images excluded 31 of the remaining 121 cases (mammographic and/or US masses) for the following reasons: (a) outside institution films were returned (no MSV) (n = 5); (b) analog spot views were not obtained or were missing from the clinical jacket (n = 5); (c) prior surgical site or marker from core biopsy was located in the same quadrant as the mass being assessed (n = 8); (d) indeterminate correlation of mass location on the MSV and at US-guided biopsy due to the presence of multiple masses on the MSV (n = 6) or differing quadrants of MSV and US-guided biopsy (n = 2); or (e) biopsy was not performed within 4 weeks of imaging or follow-up was unavailable for benign cases (n = 5). Finally, on review of the DBT images, 23 of the 90 remaining cases were excluded for the following reasons: (a) DBT was performed in a single projection for which a matching MSV did not exist, precluding formation of a matched image set (n = 1); (b) truncated projection artifacts (13) (n = 6); (c) mass not included in the field of view due to its location (far medial, lateral, or posterior) (n = 13); (d) technical failure, DBT images were inadequate (n = 1); and (e) DBT images were incorrectly misclassified as unusable during the case selection process (n = 2). The remaining 67 masses in 67 women (mean age, 55 years; median, 54 years; range, 34–88 years) constituted the study population. This case selection process produced a cancer-enriched study population, of which 45% (30 of 67) of masses were malignant and 55% (37 of 67) were benign. Two of the 37 benign masses (a simple cyst diagnosed with strict US criteria and a lipoma) were masses other than those for which the patient was enrolled in the DBT project; these masses had benign follow-up imaging findings for more than 2 years. Mass dimensions and descriptors, based on the judgment of one radiologist (M.A.R.) who was not a reader, are provided in Table 1.
Table 1.
Characteristics of 93 Masses Based on Their Appearance on MSV
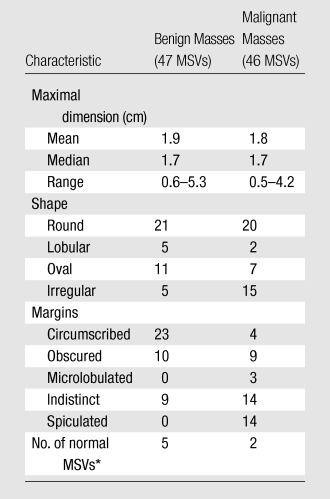
The radiologist assessed seven of 93 MSVs and five of 93 DBT images as normal (mass not visible).
DBT Image Acquisition
The DBT images were acquired from a combined DBT and whole-breast US research system (14) developed with GE Global Research (Niskayuna, NY). Cases from two different projects were available for inclusion: one that collected only DBT images (DBT-only project) (n = 193) and another that collected combined DBT and whole-breast US images (combined DBT-US project) (n = 67).
The DBT system uses Rh-Rh target-filter combination x-ray source with 26–33 kVp and a CsI/a:Si detector of 0.1 × 0.1-mm pixel pitch covering 19.20 × 23.04 cm. No antiscatter grid is used. In less than 8 seconds, 21 images over a 60° angular range are obtained. The step-and-shoot design of this system reduces focal spot blur during exposure, while the relatively large tomographic scan angle reduces artifacts and effective section thickness (15,16). System settings for a single-view DBT scan for the American College of Radiology mammography phantom yielded a mean glandular dose of 2.5 mGy, or approximately 1.4 times that of a single-view screen-film image of the same phantom. A simultaneous algebraic reconstruction algorithm reconstructed the volume with a 0.1 × 0.1-mm pixel size and 1-mm section interval (17).
A certified mammography technologist, trained to operate the system by our staff and GE Global Research, positioned the subjects. The prototype DBT system was designed to image women in a seated position, which with the DBT cowling, restricted imaging near the chest wall such that approximately 1.5 cm less of posterior breast tissue was captured on the craniocaudal view (18). The technologist applied breast compression similar to that for conventional mammography and obtained DBT image volumes in craniocaudal and mediolateral oblique or lateral views. In the DBT-only project, craniocaudal and mediolateral oblique views were obtained. In the combined DBT-US project, two orthogonal DBT acquisitions were attempted; in 12 patients, only a single view could be obtained due to one or more factors, such as limitations of the DBT cowling with the seated position, time constraints, or body habitus.
Matched Image Sets
A matched image set was defined as one MSV and one DBT image acquired in the same mammographic position. For example, an MSV and DBT image that were both acquired in craniocaudal projections constituted one matched image set. The MSV was defined as a clinically obtained spot compression or spot magnification view, acquired either with digital or analog technique. The number of spot compression (n = 65), spot magnification (n = 28), digital (n = 22), and analog (n = 71) views was determined by the images available in the clinical breast imaging files. If multiple MSVs in the same projection were available, the single best view was selected. DBT images were acquired in either one or two orthogonal planes. Therefore, a given case could yield either one or two matched image sets, depending on the DBT views and MSVs that had been acquired. Overall, the 67 masses yielded 93 matched image sets for review. Sixteen of 30 (53%) malignant and 10 of 37 (27%) benign masses provided two matched image sets each.
The radiologist who did not participate as a reader (M.A.R.) cropped the DBT images to display a volume of tissue that approximated the tissue visible on the matched MSV. The cropped DBT images were viewed at a research workstation by using a 9-megapixel (3480 × 2400 pixels), 22.2-inch diagonal, liquid crystal display monitor (model T221; IBM, Armonk, NY). A graphical user interface developed by the Computer-Aided Diagnosis Research Laboratory at our institution was used to display the DBT images. The graphical user interface provided adjustable contrast and brightness and zooming and roaming capability and allowed the user to scroll through the cropped DBT sections (approximately 20–30) with a slide bar or mouse wheel (Fig 1a). The readers assessed MSVs (analog and printed films of digital MSVs) using a light-box or hot-light with or without a magnifying glass, as they might in clinical practice (Fig 1b). The graphical user interface required readers to electronically mark or reference the mass on the image before allowing them to record their assessments. Thus, for data acquisition purposes, analog MSVs had to be digitized (by using previously described method [19]) and digital MSVs were made available on the graphical user interface (Fig 1c). If a mass was not visible on the MSV or DBT image volume, the reader marked “normal” on the graphical user interface.
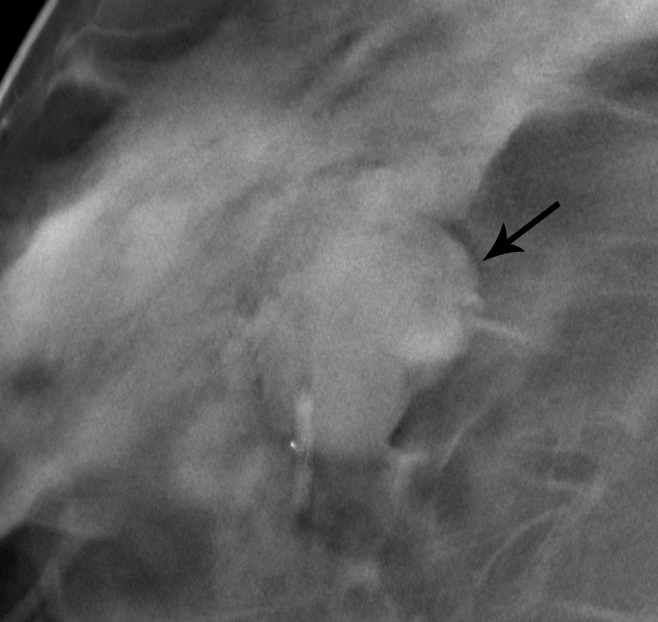
Figure 1a:

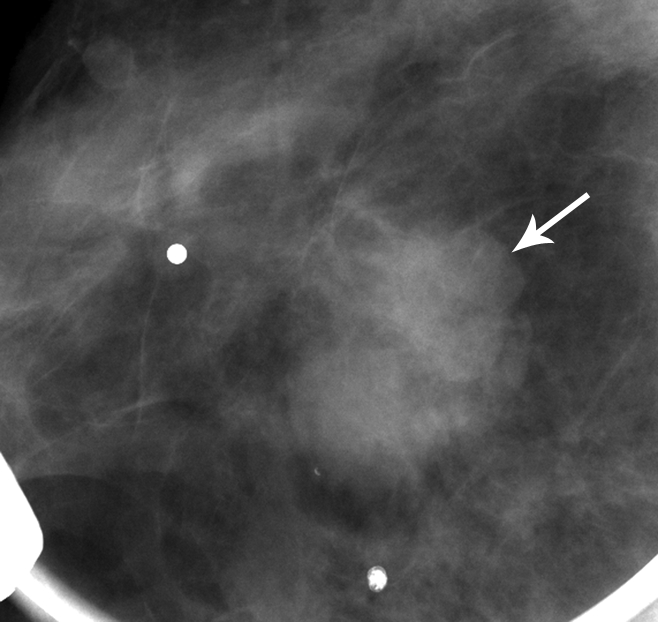
Images in 71-year-old woman with 1.9-cm invasive ductal carcinoma. (a) Cropped mediolateral oblique DBT image (arrow) displayed on the graphical user interface, which allowed readers to electronically enter their assessment of mass visibility, likelihood of malignancy, and BI-RADS category. This interface facilitated DBT image review by allowing readers to scroll through the image volume and adjust contrast and brightness as necessary. (b) MSV available on the graphical user interface to allow readers to electronically mark or reference the mass and (c) digital mediolateral oblique MSV (spot compression) reviewed by using a light-box or hot-light.
Figure 1b:

Images in 71-year-old woman with 1.9-cm invasive ductal carcinoma. (a) Cropped mediolateral oblique DBT image (arrow) displayed on the graphical user interface, which allowed readers to electronically enter their assessment of mass visibility, likelihood of malignancy, and BI-RADS category. This interface facilitated DBT image review by allowing readers to scroll through the image volume and adjust contrast and brightness as necessary. (b) MSV available on the graphical user interface to allow readers to electronically mark or reference the mass and (c) digital mediolateral oblique MSV (spot compression) reviewed by using a light-box or hot-light.
Figure 1c:

Images in 71-year-old woman with 1.9-cm invasive ductal carcinoma. (a) Cropped mediolateral oblique DBT image (arrow) displayed on the graphical user interface, which allowed readers to electronically enter their assessment of mass visibility, likelihood of malignancy, and BI-RADS category. This interface facilitated DBT image review by allowing readers to scroll through the image volume and adjust contrast and brightness as necessary. (b) MSV available on the graphical user interface to allow readers to electronically mark or reference the mass and (c) digital mediolateral oblique MSV (spot compression) reviewed by using a light-box or hot-light.
Observer Performance Study
The four readers (D.O.J., K.A.K., M.N., R.W.P.) from a single academic institution were Mammography Quality Standards Act–certified radiologists with a median of 13.5 years (range, 3–20 years) experience in breast imaging. One reader had no experience with DBT image interpretation, while the other three had gained experience in one previous reader study that had used a different study population (20). Study aims and instructions on image viewing and assessment entry into the graphical user interface were provided to readers by a researcher who was present during every reading session to answer any technical queries.
Readers were blinded to all clinical information. Each radiologist reviewed approximately 31 images per session during six separate reading sessions: three dedicated to DBT images alternated with three dedicated to MSVs (19). The order of the reading sessions among the readers was counterbalanced such that, for example, reader 1 started with MSV group 2 and then a month later read DBT group 1, whereas reader 2 started with DBT group 3 and then progressed to MSV group 1, and so on (21). Reading sessions occurred approximately 1 month apart from one another. The cases within each session were randomized differently. These methods reduced effects of reading order, fatigue, and memorization bias (21).
Readers rated mass visibility on a 10-point scale (1 = obvious, 10 = subtle) and likelihood of malignancy on a 12-point scale (0% = normal/benign, >94% = highly suggestive of malignancy) and determined the BI-RADS categories (1, 2, 3, 4a, 4b, 4c, or 5).
Statistical Analysis
Analysis was performed on data obtained from the matched image sets (n = 93). The visibility ratings of each reader were averaged and analyzed by using the Wilcoxon matched-pairs signed-rank test. Using the likelihood of malignancy ratings, reader performance was determined by fitting receiver operating characteristic (ROC) curves and calculating the area under the ROC curve (Az) as the performance index by applying the Dorfman-Berbaum-Metz multireader multicase method with PROPROC (22) fit (DBM-MRMC 2.2 software; University of Iowa, Iowa City, Iowa) (23). In addition, the partial area index above a sensitivity threshold of 0.90 (Az(0.90)) was calculated to obtain a more relevant assessment of accuracy in the setting of a high-sensitivity diagnostic test, such as mammography (24). The statistical significance for the ROC performance (differences in Az and Az(0.90)) with DBT and MSVs for the four readers as a group and as individuals was calculated. Readers’ BI-RADS 4a, 4b, 4c, and 5 assessments were separated from BI-RADS 1, 2, and 3 assessments to indicate the number of masses for which the readers would have recommended biopsy. These assessments were compared with histopathologic results. The true- and false-positive and true- and false-negative findings for each reader were calculated. The McNemar test was used to estimate whether there was a statistically significant difference in the number of correctly characterized malignancies and benign findings when using DBT or MSVs. A P value of .05 or less was considered to indicate a significant difference. A post hoc power analysis was performed based on the methods by Obuchowski (25) and Eng (26).
Results
All readers reported that, on average, masses appeared more obvious on DBT images, although only one reader achieved a statistically significant difference (P = .001, Figures 2–4).
Figure 2:

Box plot of each reader’s visibility ratings (1 = obvious; 10 = subtle) for masses on MSVs and DBT images. The boundary of the box closest to zero indicates 25th percentile and the boundary of the box farthest from zero indicates 75th percentile. Dashed and solid lines within each box indicate mean and median ratings, respectively. For reader 3 (R3) DBT, the median line coincides with 25th percentile. Whiskers above and below each box indicate 95th and 5th percentiles, respectively. The dots represent outliers. The P values for readers 1 (R1), 2 (R2), 3, and 4 (R4) were .19, .53, .13, and .001, respectively.
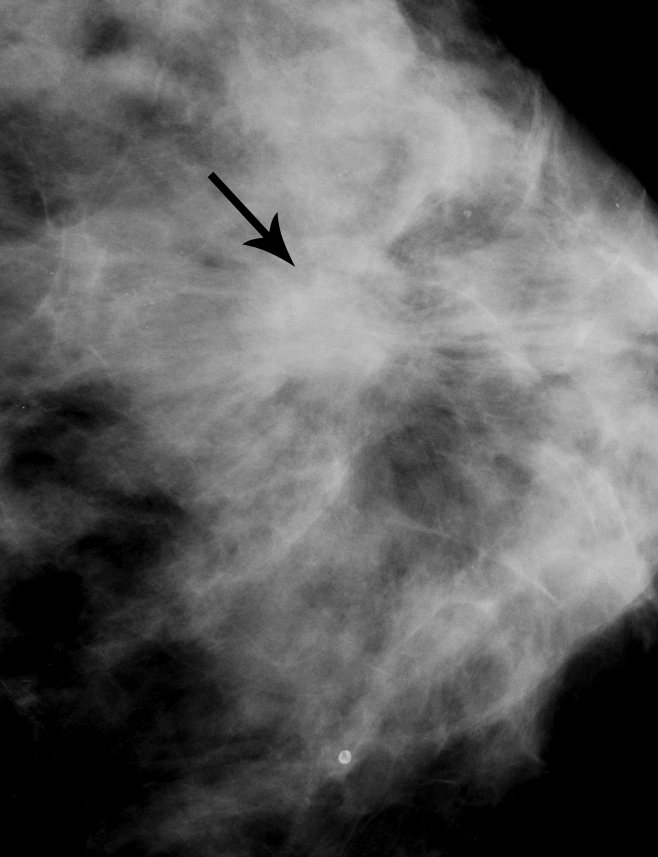
Figure 4a:
Matched image set of 1.2-cm fibroadenoma (arrow) in 29-year-old woman. (a) Mediolateral oblique DBT image (1-mm section from a volume of 20–30 sections) and (b) digital mediolateral oblique MSV (spot compression). The images were viewed and assessed during separate reader sessions. The readers’ mean and median visibility ratings, respectively, were 4.8 and 5.0 on DBT image and 5.5 and 4.5 on MSV (1 = obvious, 10 = subtle).
Figure 3a:
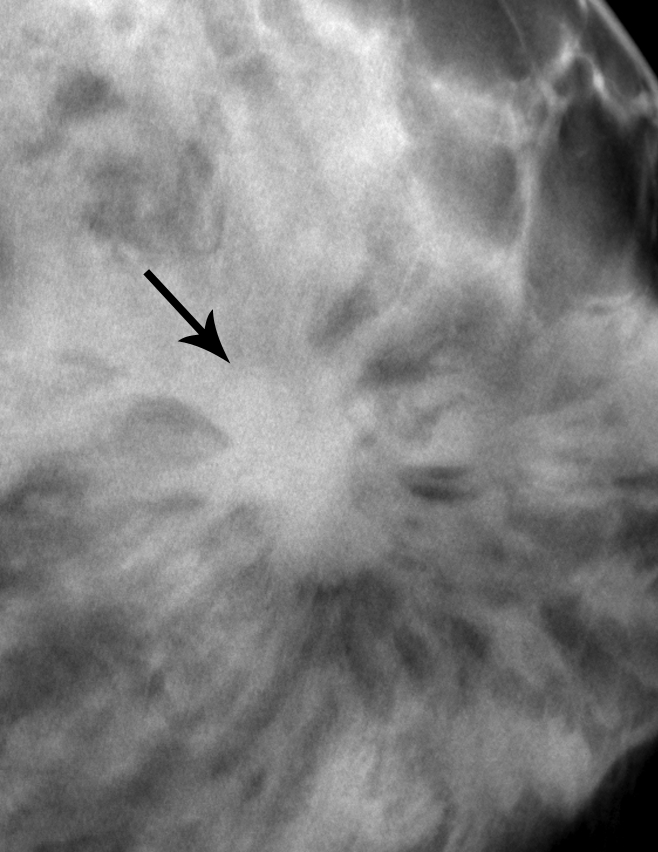
Matched image set of 2.3-cm invasive ductal carcinoma (arrow) in 56-year-old woman. (a) Craniocaudal DBT image (1-mm section from a volume of 20–30 sections) and (b) analog craniocaudal MSV (spot magnification). The images were viewed and assessed during separate reader sessions. Spiculated margins are visible on both images. The readers’ mean and median visibility ratings, respectively, were 3.5 and 4.0 on DBT image and 3.3 and 2.0 on MSV (1 = obvious, 10 = subtle).
Figure 3b:
Matched image set of 2.3-cm invasive ductal carcinoma (arrow) in 56-year-old woman. (a) Craniocaudal DBT image (1-mm section from a volume of 20–30 sections) and (b) analog craniocaudal MSV (spot magnification). The images were viewed and assessed during separate reader sessions. Spiculated margins are visible on both images. The readers’ mean and median visibility ratings, respectively, were 3.5 and 4.0 on DBT image and 3.3 and 2.0 on MSV (1 = obvious, 10 = subtle).
Figure 4b:
Matched image set of 1.2-cm fibroadenoma (arrow) in 29-year-old woman. (a) Mediolateral oblique DBT image (1-mm section from a volume of 20–30 sections) and (b) digital mediolateral oblique MSV (spot compression). The images were viewed and assessed during separate reader sessions. The readers’ mean and median visibility ratings, respectively, were 4.8 and 5.0 on DBT image and 5.5 and 4.5 on MSV (1 = obvious, 10 = subtle).
Neither differences in Az nor in Az(0.90) values achieved statistical significance for any of the individual readers when interpreting DBT images compared with MSVs (Table 2, Fig 5). However, for two readers, the Az was better with DBT, for one reader it remained similar with both modalities, and for one reader it was better with MSV. The average Az for all four readers’ estimates of the likelihood of malignancy was 0.91 and 0.90 for DBT and MSV, respectively (P = .60; 95% CI: −0.7, 0.04). Post hoc analysis indicated that the statistical power to detect a difference in Az between DBT and MSV was 27% at a type I error rate of 5%. The corresponding Az(0.90) was 0.42 and 0.31, respectively, (P = .28; 95% CI: −0.03, 0.01).
Table 2.
Reader Performance
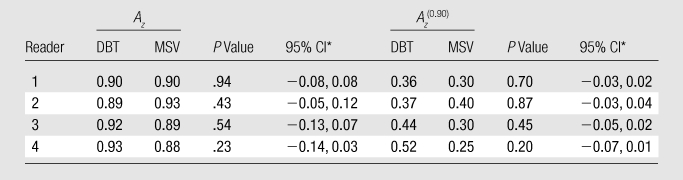
CI = confidence interval for the difference between DBT and MSV.
Figure 5:

ROC curves for all four readers. The Az and the Az(0.90) show no significant difference in reader performance when interpreting DBT images versus MSVs (see Table 2) . R1 = reader 1, R2 = reader 2, R3 = reader 3, R4 = reader 4.
Analysis of histopathologic results and each reader’s biopsy recommendations (BI-RADS 4a, 4b, 4c, and 5 group) showed that together, the four readers would have recommended biopsy for an additional seven cancers and five benign masses using DBT compared with MSV (Table 3). Therefore, DBT yielded a mean increase of 1.8 (7/4) true-positive assessments (range, 0– 3) for every 1.3 (5/4) false-positive assessments (range, −1 to 4) per reader. Positive or negative changes in biopsy recommendations with DBT compared with MSV did not achieve statistical significance for any reader (P ≥ .37).
Table 3.
Changes in Biopsy Recommendations (BI-RADS 4a, 4b, 4c, and 5) When Interpreting DBT Images Relative to Interpreting MSVs
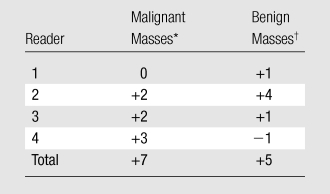
Positive numbers indicate correct increase in biopsy recommendation. This represents additional true-positive results (increased cancer diagnosis) with DBT relative to those estimated with MSVs.
Positive numbers indicate incorrect increase in biopsy recommendation. This represents additional false-positive results for benign masses when interpreting DBT images, relative to that estimated when interpreting MSVs. Negative number indicates correct decrease in biopsy recommendations.
Discussion
The results suggest that the performance of DBT may be comparable to that of clinical MSV for breast mass characterization. On average, all four readers observed slightly better mass visibility when viewing DBT images compared with MSVs, with only one reader’s difference achieving statistical significance. According to ROC analysis and Az(0.90), reader performance did not achieve statistically significant differences when interpreting DBT images or MSVs. Analysis of the number of biopsy recommendations that would have been made with DBT relative to MSV indicated that, on average, 1.8 additional cancers would be diagnosed with DBT at the cost of 1.3 additional false-positive biopsy results per reader. While this also did not achieve statistical significance, it supports the hypothesis that DBT performs comparably to MSV for characterizing a breast mass as benign or malignant.
Authors of several previous studies have reported comparable or improved cancer detection with DBT when compared with standard mammographic views in the screening or diagnostic setting (4–6,8,10). Our mass visibility ratings with DBT are in accordance with these early reports. Our similar reader performance when viewing DBT images or mammographic views is also in keeping with that reported by previous research (5,10). Only one study (4) reported a statistically significant upgrade rate of BI-RADS assessments when 40 cancers were viewed on DBT images compared with one- or two-view full-field digital mammograms. Our comparable mean biopsy recommendation rate for cancer with DBT compared with MSV supports results reported by other investigators (5,10).
Other than one study that reported four readers’ subjective preference for full-field digital mammography with DBT over that with additional mammographic views in the diagnostic setting (n = 25; 17 of 25 masses; 21 of 25 with histopathologic proof) (12), there are no reports, to our knowledge, objectively comparing the performance of DBT with MSV for breast mass characterization. Our study substantiates their subjective report that DBT may be an alternative to obtaining additional mammographic views.
Our results imply that when DBT becomes integrated into clinical breast imaging practice, MSVs might not be necessary for mass assessment. Vendors of clinical DBT prototypes have achieved or will achieve radiation doses similar to that of screening mammography. Different proposals for utilizing DBT in clinical practice are being investigated. If future studies confirm that DBT can be integrated into screening protocols and that DBT can substitute for MSVs to characterize masses, then women may be spared from being recalled for diagnostic views and from the associated incremental radiation exposure.
This study had the following limitations: The number of masses (n = 67) and corresponding matched image sets (n = 93) was small. Limited number of readers (n = 4) with variable experience using the two imaging modalities may have influenced the results. The post hoc power analysis and wide 95% CIs for reader performance indicated insufficient statistical power for our study. Additionally, the unavailability of a published method to adjust for multiple observations from the same patients when using PROPROC fit with DBM-MRMC 2.2 software is a limitation of our statistical analysis of reader performance. Having said that, if the adjustment could have been made, the results would have been even less significant (larger P values and wider 95% CI), thereby not changing our study conclusion. The mix of MSVs (such as digital, analog, spot compression, and spot magnification views) resulted in a nonuniform comparison between the modalities. This limitation could not be avoided in the study design due to the availability of variable diagnostic views obtained during clinical breast imaging care. This admixture of MSV likely reflects clinical practice in the United States during the study period. Finally, our study was confined to comparing DBT and MSV performance in mass characterization (or diagnosis) rather than in mass detection. Therefore, these results cannot be used to infer anything about the detection capability of DBT.
In conclusion, in this small reader study, differences in mass visibility, reader performance, or biopsy recommendations did not achieve statistical significance when interpreting DBT images or MSVs. DBT may or may not obviate MSVs in the diagnostic work-up of a breast mass. Larger studies with more diverse mammographic findings and full sets of diagnostic mammographic images may better define the emerging role that DBT might play in clinical breast imaging practice.
Advance in Knowledge.
In a study of 30 malignant and 37 benign masses, differences in mass visibility, reader performance, or biopsy recommendations did not achieve statistical significance when interpreting digital breast tomosynthesis images or mammographic spot views.
Implication for Patient Care.
Additional spot compression or magnification views might not be necessary to characterize masses when tomosynthesis becomes clinically integrated.
Disclosures of Potential Conflicts of Interest: M.N. No potential conflicts of interest to disclose. L.H. No potential conflicts of interest to disclose. S.R.M. No potential conflicts of interest to disclose. K.A.K. No potential conflicts of interest to disclose. D.O.J. No potential conflicts of interest to disclose. R.W.P. No potential conflicts of interest to disclose. H.P.C. No potential conflicts of interest to disclose. P.L.C. Financial activities related to the present article: none to disclose. Financial activities not related to the present article: Author was paid by NIH for grant reviews, received money from Nanjing University for travel reimbursement and was an invited speaker at International Congress of Medical Physics, author and institution have several patents/application on this work, some may be joint with GE. Other relationships: Subcontract from GE Global Research on an NIH grant to GE on US imaging of the breast. M.A.H. Financial activities related to the present article: institution received money from GE HealthCare. Financial activities not related to the present article: Author received a consulting fee from GE HealthCare. Other relationships: none to disclose. M.A.R. No potential conflicts of interest to disclose.
Acknowledgments
The authors thank K. Thomenius, PhD, initial principal investigator of the GE subcontract; J. Eberhard, PhD, DBT system development; A. Schmitz, MS, current principal investigator and project manager of the GE subcontract; M. Goodsitt, PhD, and G. LeCarpentier, PhD, for their contributions. The authors also thank statisticians James Myles, PhD, and Nahid R. Keshavarzi, MS, for their contributions.
Received September 2, 2010; revision requested October 21; revision received April 28, 2011; accepted May 24; final version accepted July 20.
Supported by GE Global Research (Niskayuna, NY), GE Healthcare, and University of Michigan Health Care System.
Funding: This research was supported by the National Institutes of Health (grants RO1 CA91713 and R33 CA120234).
Abbreviations:
- Az
- area under the ROC curve
- Az(0.90)
- partial area index above a sensitivity threshold of 0.90
- BI-RADS
- Breast Imaging Reporting and Data System
- CI
- confidence interval
- DBT
- digital breast tomosynthesis
- MSV
- mammographic spot view
- ROC
- receiver operating characteristic
References
- 1.Berkowitz JE, Gatewood OM, Gayler BW. Equivocal mammographic findings: evaluation with spot compression. Radiology 1989;171(2):369–371 [DOI] [PubMed] [Google Scholar]
- 2.Faulk RM, Sickles EA. Efficacy of spot compression-magnification and tangential views in mammographic evaluation of palpable breast masses. Radiology 1992;185(1):87–90 [DOI] [PubMed] [Google Scholar]
- 3.Niklason LT, Christian BT, Niklason LE, et al. Digital tomosynthesis in breast imaging. Radiology 1997;205(2):399–406 [DOI] [PubMed] [Google Scholar]
- 4.Andersson I, Ikeda DM, Zackrisson S, et al. Breast tomosynthesis and digital mammography: a comparison of breast cancer visibility and BIRADS classification in a population of cancers with subtle mammographic findings. Eur Radiol 2008;18(12):2817–2825 [DOI] [PubMed] [Google Scholar]
- 5.Gennaro G, Toledano A, di Maggio C, et al. Digital breast tomosynthesis versus digital mammography: a clinical performance study. Eur Radiol 2010;20(7):1545–1553 [DOI] [PubMed] [Google Scholar]
- 6.Good WF, Abrams GS, Catullo VJ, et al. Digital breast tomosynthesis: a pilot observer study. AJR Am J Roentgenol 2008;190(4):865–869 [DOI] [PubMed] [Google Scholar]
- 7.Gur D, Abrams GS, Chough DM, et al. Digital breast tomosynthesis: observer performance study. AJR Am J Roentgenol 2009;193(2):586–591 [DOI] [PubMed] [Google Scholar]
- 8.Poplack SP, Tosteson TD, Kogel CA, Nagy HM. Digital breast tomosynthesis: initial experience in 98 women with abnormal digital screening mammography. AJR Am J Roentgenol 2007;189(3):616–623 [DOI] [PubMed] [Google Scholar]
- 9.Svahn T, Andersson I, Chakraborty D, et al. The diagnostic accuracy of dual-view digital mammography, single-view breast tomosynthesis and a dual-view combination of breast tomosynthesis and digital mammography in a free-response observer performance study. Radiat Prot Dosimetry 2010;139(1-3):113–117 [DOI] [PMC free article] [PubMed] [Google Scholar]
- 10.Teertstra HJ, Loo CE, van den Bosch MA, et al. Breast tomosynthesis in clinical practice: initial results. Eur Radiol 2010;20(1):16–24 [DOI] [PubMed] [Google Scholar]
- 11.Zuley ML, Bandos AI, Abrams GS, et al. Time to diagnosis and performance levels during repeat interpretations of digital breast tomosynthesis: preliminary observations. Acad Radiol 2010;17(4):450–455 [DOI] [PubMed] [Google Scholar]
- 12.Hakim CM, Chough DM, Ganott MA, Sumkin JH, Zuley ML, Gur D. Digital breast tomosynthesis in the diagnostic environment: a subjective side-by-side review. AJR Am J Roentgenol 2010;195(2):W172–W176 [DOI] [PubMed] [Google Scholar]
- 13.Zhang Y, Chan HP, Sahiner B, Wei J, Zhou C, Hadjiiski LM. Artifact reduction methods for truncated projections in iterative breast tomosynthesis reconstruction. J Comput Assist Tomogr 2009;33(3):426–435 [DOI] [PMC free article] [PubMed] [Google Scholar]
- 14.Kapur A, Carson PL, Thomenius K, et al. Co-registered breast imaging with 3D X-ray and 3D ultrasound. In: Procs Digital Mammography: International Workshop on Digital Mammography. Bremen, Germany: Springer-Verlag, Berlin, 2003; 38–42 [Google Scholar]
- 15.Eberhard J, Staudinger P, Smolenski J, et al. High-speed large-angle mammography tomosynthesis system. In: Flynn MJ, Hsieh J, eds. Proceedings of SPIE: medical imaging 2006—physics of medical imaging. Vol 6142 Bellingham, Wash: SPIE–The International Society for Optical Engineering, 2006; 1420C1–1420C11 [Google Scholar]
- 16.Lu Y, Chan HP, Goodsitt MM, et al. Effects of projection-view distributions on image quality of calcifications in digital breast tomosynthesis (DBT) reconstruction. In: Samei E, Pelc NJ, eds. Proceedings of SPIE: medical imaging 2010—physics of medical imaging. Vol 7622 Bellingham, Wash: SPIE–The International Society for Optical Engineering, 2010; 76220D1–76220D8 [Google Scholar]
- 17.Zhang Y, Chan HP, Sahiner B, et al. A comparative study of limited-angle cone-beam reconstruction methods for breast tomosynthesis. Med Phys 2006;33(10):3781–3795 [DOI] [PMC free article] [PubMed] [Google Scholar]
- 18.Roubidoux MA, Helvie MA, Lecarpentier G, et al. A combined tomosynthesis-breast ultrasound system: initial results regarding coverage and mass visibility [abstr]. In: Radiological Society of North America Scientific Assembly and Annual Meeting Program. Oak Brook, Ill: Radiological Society of North America, 2006; 484 [Google Scholar]
- 19.Hadjiiski L, Chan HP, Sahiner B, et al. Improvement in radiologists’ characterization of malignant and benign breast masses on serial mammograms with computer-aided diagnosis: an ROC study. Radiology 2004;233(1):255–265 [DOI] [PubMed] [Google Scholar]
- 20.Sinha SP, Roubidoux MA, Helvie MA, et al. Multi-modality 3D breast imaging with x-ray tomosynthesis and automated ultrasound. Conf Proc IEEE Eng Med Biol Soc 2007;2007:1335–1338 [DOI] [PubMed] [Google Scholar]
- 21.Metz CE. Some practical issues of experimental design and data analysis in radiological ROC studies. Invest Radiol 1989;24(3):234–245 [DOI] [PubMed] [Google Scholar]
- 22.Metz CE, Pan X. “Proper” binormal ROC curves: theory and maximum-likelihood estimation. J Math Psychol 1999;43(1):1–33 [DOI] [PubMed] [Google Scholar]
- 23.Dorfman DD, Berbaum KS, Metz CE. Receiver operating characteristic rating analysis: generalization to the population of readers and patients with the jackknife method. Invest Radiol 1992;27(9):723–731 [PubMed] [Google Scholar]
- 24.Jiang Y, Metz CE, Nishikawa RM. A receiver operating characteristic partial area index for highly sensitive diagnostic tests. Radiology 1996;201(3):745–750 [DOI] [PubMed] [Google Scholar]
- 25.Obuchowski NA. Sample size tables for receiver operating characteristic studies. AJR Am J Roentgenol 2000;175(3):603–608 [DOI] [PubMed] [Google Scholar]
- 26.Eng J. Sample size estimation: a glimpse beyond simple formulas. Radiology 2004;230(3):606–612 [DOI] [PubMed] [Google Scholar]