

Abstract
Adapting to blurred or sharpened images alters the perceived focus of subsequently viewed images. We examined whether these adaptation effects could arise from actual sphero-cylindrical refractive errors, by testing aftereffects in images simulating second-order astigmatism. Image blur was varied from negative (vertical) through isotropic to positive (horizontal) astigmatism while maintaining constant blur strength. A 2AFC staircase was used to estimate the stimulus that appeared isotropically blurred before or after adapting to images with astigmatism. Adaptation to horizontal blur caused isotropically blurred images to appear vertically biased and vice versa, shifting the perceived isotropic point toward the adapting level. Aftereffects were similar for different types of images and showed partial selectivity so that strongest effects generally occurred when testing and adapting images were the same. Further experiments explored whether the adaptation depended more strongly on the blurring or “fuzziness” in the images vs. the apparent “figural” changes introduced by the blur, by comparing how the aftereffects transfer across changes in size or orientation. Our results suggest that strong selective adaptation can occur for different lower order aberrations of the eye and that these may be at least partly driven by the apparent figural changes that blurring introduces into the retinal image.
Keywords: adaptation, blur, lower order aberrations, astigmatism, defocus, orientation, blur selectivity, shape, figural aftereffects, Adaptive Optics
Introduction
Blur is inherent in the retinal image because of imperfections in the ocular components of the eye. Ocular aberrations degrade image quality by attenuating contrast, reducing the range of spatial frequencies in the image, and introducing phase shifts. Yet despite these effects, observers do not usually report that the world appears contrast attenuated, band-limited, nor phase altered (“blurred”), suggesting that the perception of image focus is somehow compensated for these aberrations (Artal, Chen, Manzanera, & Williams, 2004). An important question is whether this presumed compensation can be specific to specific aberrations (Artal, Chen, Fernandez et al., 2004). Different types of aberrations alter the point spread function (PSF) in very different ways. Moreover, the aberrations vary widely in magnitude and distribution in the population (Castejon-Mochon, Lopez-Gil, Benito, & Artal, 2002; Porter, Guirao, Cox, & Willaims, 2001; Thibos, Hong, Bradley, & Cheng, 2002), and thus individuals are each exposed to different long-term patterns of retinal blur. Yet it remains unknown to what extent and in what ways visual coding can adjust for the consequences of idiosyncratic variations in the optics.
One potential form of compensation is neural adaptation. Brief periods of exposure to stimulus blur can strongly affect the subsequent perception of focus (Webster, Georgeson, & Webster, 2002). For example, after viewing stimuli that are physically blurred or sharpened, a physically focused stimulus appears too sharp or too blurred, respectively. These aftereffects occur and can be selective for different types of stimuli, for luminance or chromatic blur, spatial or temporal blur, and different depth planes (Battaglia, Jacobs, & Aslin, 2003; Bilson, Mizokami, & Webster, 2005; Webster et al., 2002; Webster, Mizokami, Svec, & Elliott, 2006). A number of studies have also demonstrated adaptation effects for optical blur. For example, improvements in visual acuity occur following adaptation to optical defocus (Mon-Williams, Tresilian, Strang, Kochhar, & Wann, 1998; Pesudovs & Brennan, 1993; Rosenfield, Hong, & George, 2004). Moreover, Artal, Chen, Manzanera et al. (2004) and Chen, Artal, Gutierrez, and Williams (2007) found that observers showed higher visual acuities with stimuli viewed through their native ocular higher order aberrations to rotated or scaled versions of their aberrations, suggesting that subjective image quality might be adapted to the observer’s own ocular aberrations, though this adaptation may be far from complete (Chen et al., 2007). Long-term experience and adaptation may also play a role in adjusting to more extreme higher order aberrations in keratoconic eyes (Sabesan & Yoon, 2009).
In this study, we conducted 5 experiments to investigate the perceptual consequences of short-term adaptation to simulated astigmatic refractive errors. Specifically, observers were adapted to physically blurred images that were convolved with PSFs corresponding to different axes and magnitudes of astigmatism in order to simulate the effects of optical blur. This is similar to the approach adopted by a number of previous studies of blur adaptation (e.g., Battaglia et al., 2003; Vera-Diaz, Woods, & Peli, 2010; Webster et al., 2002) and differs from previous studies that have instead blurred the image optically (e.g., Mon-Williams et al., 1998; Pesudovs & Brennan, 1993; Rajeev & Metha, 2010; Rosenfield et al., 2004). Control experiments, in which the adaptation effects were instead assessed under correction with Adaptive Optics for the observer’s natural astigmatism and high-order aberrations (Artal, Chen, Fernandez et al., 2004; Liang, Williams, & Miller, 1997; Marcos, Sawides, Gambra, & Dorronsoro, 2008), were carried out to ensure that the principal effects of the adaptation to image blur were not biased by further degradation in the image imposed by uncorrected high-order aberrations of the eye or differences in pupil size.
Experiment 1 was designed to assess whether adaptation could be selective for different axes of astigmatism. Clinically, it is well known that observers require time to adjust to progressive spectacles that induce significant amounts of astigmatism and field distortions (e.g., Adams, Banks, & Van Ee, 2001) or to large refractive corrections for astigmatism, which are consequently introduced in stages. Long-term adaptation to astigmatism was also suggested by Georgeson and Sullivan’s (1975) work on contrast constancy. The perceived contrast of suprathreshold gratings is relatively invariant with spatial frequency and thus compensated for the sensitivity limits revealed at threshold by the contrast sensitivity function. Perceived contrast moreover showed compensation for the orientation-selective sensitivity losses in astigmatic observers (Georgeson & Sullivan, 1975). Finally, adjustments to astigmatism have also been described for individuals who wore cylindrical lenses for prolonged periods (Anstis, 2002; Yehezkel, Belkin, Sagi, & Polat, 2005).
Orientation and spatial-frequency tuning are among the most prominent features of cortical receptive fields, which are reflected in the orientation and spatial-frequency selectivity of short-term spatial adaptation (Blakemore & Campbell, 1969; Bradley, Switkes, & De Valois, 1988). It is plausible, therefore, that short-term blur adaptation may have an orientation bias if image blur is produced by astigmatism. In the present study, we examined whether observers can adapt to astigmatic blur at the rapid timescales characteristic of pattern-selective adaptation.
Optical blurring can change a number of image attributes, including the salience of texture at different spatial scales, a reduced resolution of image features or increasing “fuzziness” of edges, phase shifts and reversals, and the perceived shape of features. For example, Figure 1 shows an image of Frits Zernike (from Wikipedia), who developed a mathematical representation for describing optical aberrations. The blurred versions correspond to the lower order aberrations of spherical defocus, and either positive (i.e., horizontal) or negative (i.e., vertical) astigmatism, all with a constant blur strength of 0.76 diopters (Raasch, 1995; Thibos, Wheeler, & Horner, 1997; Equation 1). The blurred images have the characteristic appearance of low pass filtered images, but notably the blurred images also look like different individuals. These apparent shape changes could thus induce aftereffects in the images because of adaptation to the perceived differences in the shapes, just as adaptation to different faces induces aftereffects in face perception (Webster & MacLin, 1999).
Figure 1.
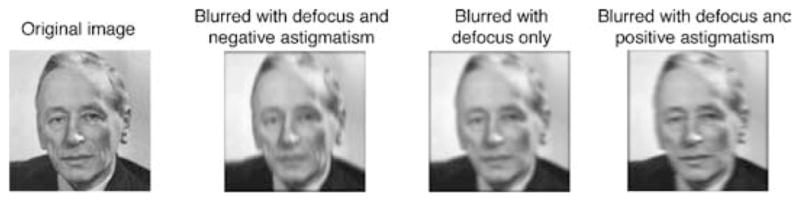
Convolution of an image of Frits Zernike with the PSF of wavefronts containing the low-order aberrations of astigmatism and defocus. A negative astigmatism at 0/90 deg produces blur with a vertical orientation bias; a positive astigmatism produces a horizontal bias. Equivalent blur from defocus only produces isotropic blurring.
Spatial distortions with astigmatism are well known in the El Greco fallacy (Anstis, 2002). In El Greco’s paintings, the figures often appear stretched vertically, and this has been attributed to distortions in his retinal image from astigmatism. The fallacy is that this distortion would alter the appearance of both the subject and their portrait, and thus could not account for a failure to preserve the same physical dimensions in the paintings. In one sense, however, there is a fallacy to this fallacy. The PSF is a function of visual angle while the visual angle of the subject varies with distance. If El Greco had astigmatism—and was not compensating for it—then a subject farther away than his canvas could in fact appear more distorted because they would subtend a smaller angle. More generally, equally blurred large and small images are not scaled versions of each other. In contrast, magnifying a blurred image preserves the same perceived “shape” by rescaling the image luminance profile by a constant but results in images that appear to have greater blur (because the effective PSF is also magnified). Put another way, blur has an equal effect on the spectrum of differently sized images in retinocentric coordinates (cycles per degree), while magnification has a constant effect across size in object-centric coordinates (cycles per object). This raises the question of whether adaptation to astigmatic blur might reflect response changes at visual levels that are more closely tied to object-centric vs. retinocentric image characteristics.
We performed three experiments to determine if the adaptation to astigmatic blur was a simple orientation and spatial-frequency specific contrast aftereffect, or if it reflects a form of figural aftereffect associated with the apparent structural changes seen in the images. In Experiment 2, we determined if the adaptation to astigmatism was specific to the adapting target (e.g., a face), or if its effect would generalize across different post-adaptation targets. This allowed us to test the extent to which observers might adapt to the attribute of blur independent of a specific target. In Experiment 3, we determined if the adaptation to astigmatism transfers across a change in image size. Figural aftereffects can show strong transfer over a size change. For example, adapting to distortions in a face at one size can strongly affect the appearance of faces viewed at different sizes (Zhao & Chubb, 2001), and in fact this size change is often included as a control to try to reduce the contribution of “low-level” pattern adaptation to face aftereffects. In Experiment 4, we determined if the adaptation to astigmatic blur was specific to retino-centric orientation or to the orientation of the objects. These experiments followed from a study by Watson and Clifford (2003) who tested how figural aftereffects for faces depend on the relative orientation of the adapting and test images. Consider a face blurred along the axis of the head by vertical blur (negative astigmatism) but tilted at 135 deg (see Figure 7, below). The blurring is along the negative diagonal of the image plane but along the vertical axis of the face. If adaptation is specific to the object orientation, and not retinal orientation, then a test object tilted along the positive diagonal should show a negative aftereffect consistent with the same object axis but now along the orthogonal retinal axis. Conversely, if the blurring biases appearance along the axis of the blur independent of the objects, then the aftereffect should appear reversed. That is, blur along the horizontal axis of the target head should appear increased following adaptation to vertical head axis blur in a 90-degree rotated adapting head.
Figure 7.

Conditions tested in Experiment 4. (Left) Adaptation to positive astigmatism along the axis of the face and then tested at the same image orientation or rotated 90 deg. (Right) Adaptation to negative astigmatism along the image axis (positive and negative astigmatisms correspond to horizontal and vertical astigmatisms, respectively).
Finally, in Experiment 5, we examined the effect of the magnitude of adapting blur. This is of interest in order to assess (1) whether there is a range of blur levels that might be compensated completely by short-term adaptation; and (2) whether the perceived neutral point can also be recalibrated for very strong levels of blur. Corresponding measurements for defocus have not been assessed, but Webster, Webster, MacDonald, and Bharadwadj (2001) found that for Gaussian blur the aftereffects were non-monotonic with blur magnitude. That is, high levels of Gaussian blur produced weaker aftereffects in subjective focus, possibly because these blur levels strongly reduced the overall contrast of the adapting image or the contrast within the spatial-frequency range that might be important for judging image focus. Here we tested whether the astigmatic blur might also induce stronger shifts at moderate blur levels.
For all of the experiments, we used a task that directly measured the perceived orientation bias in the images, rather than measuring perceived sharpness as in previous studies. Our results show that adaptation to astigmatic blur leads to robust orientation aftereffects, and highlight the potential role of different stimulus cues in neural adjustments to blur.
Methods
All experiments were designed to test whether prior adaptation to images blurred with horizontal or vertical astigmatism would induce a change in the image blur that appeared isotropically blurred. In order to evaluate such a bias, we employed a series of blurred images each with the same level of blur but with differing levels of orientation bias (e.g., see Figures 3 and 4). Based upon the observations made with meridionally uniform (isotropic) blur (Webster et al., 2002), we hypothesize that orientation-selective blur adaptation will lead to a relative decrease in perceived blur along the adapting orientation. Thus, subsequently viewed spherical defocus will appear to have less blur at the adapting orientation and therefore relatively greater blur along orientations perpendicular to the adapting orientation. In order to test this hypothesis, we developed a method for varying the meridional bias in blur while keeping the overall blur level constant, and thus using these stimuli, we can identify any orientation bias in the stimuli that appear to exhibit isotropic blur. The experiments differ in using different sets of adapting and test images to characterize the basis for the aftereffects.
Figure 3.
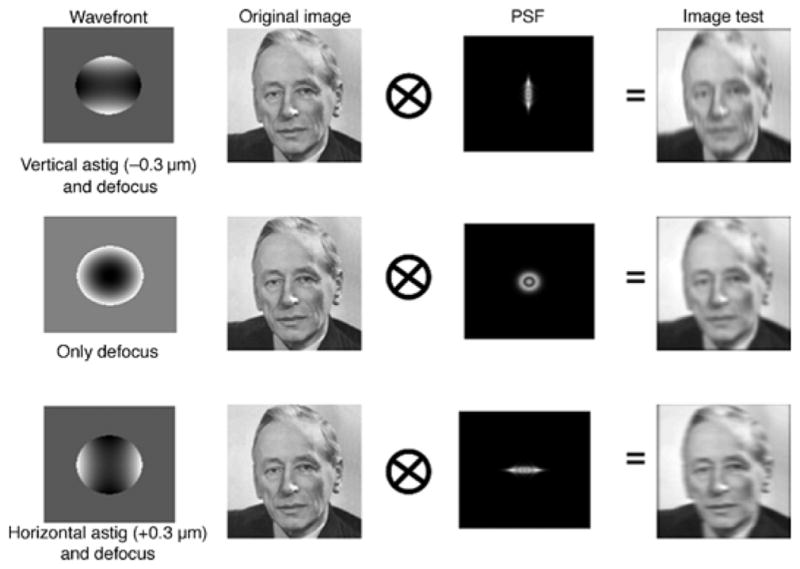
Convolution of an original image (noise) and the PSF of the wavefront containing the low-order aberrations of astigmatism and defocus.
Figure 4.

Examples of the images from the stimulus arrays formed by varying different combinations of astigmatism and defocus (keeping a constant blur strength B = 0.76 D). Astig stands for Zernike coefficient .
Subjects
We performed five different experiments at the University of Nevada, Reno. The observers included two of the authors and 4 students who were unaware of the aims of the experiment. Two or three subjects were tested in each experiment, with author LS (labeled S1) participating in all conditions and MW (labeled S2) and all but the last experiment confirmed on a naive observer. Experiment 1 was repeated at the Institute of Optics, in Madrid, Spain on 4 subjects, correcting low- and high-order aberrations with an Adaptive Optics system. Subjects in this experiments included 2 of the authors (LS labeled S1 and SM labeled S7 in test control) and 2 naive observers (S8 and S9). All subjects had normal vision as assessed by standard tests, low astigmatism, and corrected spherical refractive errors. Participation was with informed consent following protocols meeting the tenets of the Declaration of Helsinki and approved by the Institutional Review Boards.
Apparatus and stimuli
Five different experiments were conducted at the University of Nevada. The images were displayed on a gamma-corrected Sony 500 PS monitor controlled by a Cambridge Research Systems VSG graphics card (Cambridge Research System, UK). The images subtended 4 deg but were displayed through a 3.5-deg “window” to allow their spatial position to be jittered slightly during adaptation in order to avoid local light adaptation. All images had a mean luminance of 15 cd/m2 and were shown against a 15 by 10 deg uniform gray background with the same luminance. Observers viewed the display binocularly from a distance of 150 cm in an otherwise dark room.
All images were 8-bit grayscale with a size of 256 × 256 pixels. Different sets of images included: (1) 3 samples of filtered noise, with a 1/f amplitude spectrum and rms contrast of 0.35; (2) 4 close-ups of natural textures, taken from relatively homogenous images of foliage (from Webster & Miyahara, 1997); and (3) 4 natural objects or scenes, which included outdoor scenes and Zernike’s image. Some of the latter scenes had been used in previous psychophysical experiments of the effect of adaptive optics correction of ocular aberrations on subjective image sharpness assessment (Sawides, Gambra, Pascual, Dorronsoro, & Marcos, 2010). The images are shown in Figure 2.
Figure 2.

Images of noises, textures, and natural scenes used in the experiments.
As a control experiment, an alternative version of Experiment 1 was conducted at the Institute of Optics (CSIC), in Madrid. In this case, a custom-developed Adaptive Optics (AO) system was used to compensate for the subject’s astigmatism and high-order aberrations. The instrument has been described in detail in previous publications (Gambra, Sawides, Dorronsoro, & Marcos, 2009; Marcos et al., 2008; Sawides, de Gracia et al., 2010). The main elements are a Shack–Hartmann wavefront sensor and a 52-actuator electromagnetic deformable mirror (Imagine Eyes, France) to measure and correct the subject’s aberrations. An artificial pupil of 6 mm was placed onto the AO system to limit the subject’s pupil size, which ranged between 5.6 and 6.0 mm. A Badal system compensated for the subject’s defocus, with the correction being achieved after best correction of astigmatism and high-order aberrations with the deformable mirror. Continuous pupil monitoring and aberration measurements ensured proper centration and stable correction of the subject’s aberrations. The stimuli were presented on a CRT monitor (Mitsubishi Diamond Pro 2070) through the Badal and AO mirror correction. Stimulus display was controlled by the psychophysical platform ViSaGe, (Cambridge Research System, UK). The average luminance (after losses in the system) was around 30 cd/m2. The images (480 × 480 pixels) subtended 1.98 deg and included an image of Perlin noise and three natural images (of houses, tulips, or a face). The images were again jittered in time during adaptation in order to avoid local light adaptation.
Images blurred with astigmatism and defocus
In all the experiments, custom algorithms written in Matlab were used to obtain simulated images blurred with astigmatism and defocus. Using Fourier Optics, aberrated images were computed as the convolution of the original image (object) and the PSF corresponding to a wave aberration with all Zernike terms set to zero except for (astigmatism at 0/90 deg) and (defocus). In most cases, the astigmatic term was varied in the wave aberration from −0.3 to 0.3 μm in 5-nm steps, and defocus was varied from 0.127 to 0.247 μm. For Experiment 5, we instead varied the astigmatism over a larger range, from −0.6 to 0.6 μm (with defocus varied from 0.374 to 0.566 μm) in order to test how the aftereffects varied with blur strength. The image simulations were calculated for a 3-mm pupil, assuming monochromatic aberrations only, a 500-nm wavelength, and a viewing angle of 4 deg. Each combination of astigmatism and defocus produced the same amount of blur strength (B = 0.76 D, or B = 1.74 D for Experiment 5). We defined blur strength (B) as
| (1) |
where M, J0, and J45, in diopters, represent the equivalent defocus, the vertical/horizontal astigmatism, and oblique astigmatism, respectively, as defined by Thibos et al. (2002, 1997)
| (2a) |
| (2b) |
| (2c) |
where r is the pupil radius in millimeters.
Thus, to keep the blur strength constant (and maintain the same amount of optical degradation in all test conditions, Raasch, 1995; Schwendeman, Ogden, Horner, & Thibos, 1997), defocus was varied to satisfy the following equation:
| (3) |
where, for astigmatism at 0/90 deg, was set to 0 and varied from −0.3 to 0.3 μm (and from −0.6 to 0.6 μm in Experiment 5).
Figure 3 shows an example of the convolution of an original image with the PSF for a wave aberration with vertical astigmatism, defocus, and horizontal astigmatism, while Figure 4 shows how the appearance of the images varied with the magnitude of astigmatism. Larger amounts of negative astigmatism introduce more vertical blur in the image, while positive astigmatism introduces horizontal blur. The image blurred by adding only defocus in the wave aberration instead appears isotropically blurred. It is assumed that the angular subtense of the stimuli in the experiments lies within the isoplanatic area of the eye, and therefore, the convolution is performed using a spatially invariant PSF. In the human eye, the changes in astigmatism are small across the central 10 degrees (Atchison et al., 2006; Atchison, Scott, & Charman, 2003). However, as a result, the computationally blurred stimuli did not include the (small) astigmatic distortion produced when principal powers are unequal (i.e., meridional differences in magnification).
For the experiment performed in the AO system, the stimuli were generated using identical procedures. The astigmatism term (at 0/90 deg) varied from −1 to 1 μm in 10-nm steps and the defocus term varied from 0.693 to 0.990 μm, for a 1.98° viewing angle and 6-mm pupil. Each combination of astigmatism and defocus produced the same amount of blur strength (B = 0.76 D) as in the corresponding experiment under natural viewing.
Procedure
Observers adapted during a 2-min exposure either to the gray field or to strong vertical (negative Zernike coefficient ) or horizontal (positive Zernike coefficient ) astigmatic blur. During adaptation, the position of the adapting image was randomly varied every 100 ms over a range of 0.25 deg, though as noted the image was displayed within a window with constant borders. A test image was then displayed for 300 ms interleaved with 5-s top-ups to the gray field or adapting image. The top-up and test intervals were separated by a 100-ms gray field. The subjects made a 2-alternative forced-choice response to indicate the axis (vertical or horizontal) of the perceived blur. The level of astigmatic blur in the test images was varied with a staircase to estimate the perceived isotropic point, which was based on the mean of the last 12 reversals. Typically, 4 repeated settings were made for each adapt and test condition with the order across conditions counterbalanced except for the AO–noAO correction experiment where 1 or 2 measurements were performed in each condition.
Protocols specific to each of 5 experiments were given as follows.
Experiment 1: Astigmatic blur and orientation-selective blur aftereffects
We tested for the presence of an aftereffect from exposure to astigmatic blur and whether it was selective to the axis of the astigmatism for a wide range of images (see Figure 2). In each run, the adapt and test images were created from the same original stimulus. Subjects adapted to the image blurred with positive (horizontal) or negative (vertical) astigmatism corresponding to ±0.3 μm, or to the equivalent blur from isotropic (spherical) defocus, and the blur level in the test image was then varied with the 2AFC staircase until the blur in the test image appeared isotropic. When the experiment was performed in the AO system, the psychophysical paradigm was identical (with the adapting image blurred with positive or horizontal astigmatism corresponding to ±1 μm) and performed under natural aberrations and under AO correction of subject’s aberrations.
Experiment 2: Selectivity of blur adaptation for the adapting images
To test how adaptation to blur in one image influences the appearance of a different test image, we compared the aftereffects of adaptation to a single adapting image on the appearance of the same image or 2 different images. An example is illustrated in Figure 5 where adaptation to blur in one image (pine needles, 1/f noise, and face) was tested on the same image or on the two images that were not shown during adaptation. For each adapting condition, the aftereffects for the three test images were measured simultaneously with 3 randomly interleaved staircases during each adaptation sequence.
Figure 5.

Example of conditions for measuring how adaptation to astigmatic blur in a single image affects perceived blur in the same or different images.
Experiment 3: Aftereffects dependent on local blur versus global shape
Tests of shape vs. blur aftereffects induced by astigmatic blur were based on a single image of a face (Zernike). A face was chosen because configural changes are particularly salient in face images. Blurred versions of the image were generated with the same amount of astigmatism and defocus as before, but for two different object sizes (2-deg image and 6-deg image in Figure 6). Although the blur had the same retinal size, the effect of this blur on small and large images produced differences in perceived shape (“Same blur and different shape”). To produce images with equivalent global shape, we instead magnified the blurred 2-deg image to 6 deg (enlarged 2-deg image in Figure 6). In this case, the shape was preserved, but the level of blur was increased 3-fold (“Same shape and different blur”). We then tested how adaptation to either image size affected the isotropic settings in the 2-deg image. Viewing distance was reduced to 106 cm, and the 2-deg images for adaptation were shown in a 3 by 3 matrix in order to stimulate the same retinal area as the 6-deg images (Figure 6).
Figure 6.

Adaptation to blur (here to vertical astigmatism) at different sizes. Test conditions 1 and 2 measure the aftereffects for images with different size but blurred with the same aberration, while conditions 1 and 3 use the same image at different magnification to measure the aftereffects for images that have the same shape but different levels of blur.
Experiment 4: Blur adaptation and object orientation
Adapting images were blurred as described above but were shown rotated 45 deg anticlockwise (adapt images). Aftereffects were then assessed in test images at the same orientation or tilted 45 deg clockwise (Figure 7). As in Experiment 3, these tests were conducted with the face image.
Experiment 5: Adaptation and blur strength
In this case, the stimulus was a single noise image with the astigmatic term varied over a larger range from −0.6 to 0.6 μm in 10-nm steps, and defocus varied from 0.374 to 0.566 μm. Each combination of astigmatism and defocus now produced a cons2tant blur strength of 1.74 D. Adaptation was measured for a range of 9 different levels spanning the array (Figure 8).
Figure 8.

A noise image with 9 different levels of astigmatism (in nm) used as adapting images.
Results
Experiment 1: Astigmatic blur and orientation-selective blur aftereffects
Adaptation to simulated blur through natural optics
As noted, in the first experiment, we tested for the presence of an aftereffect from astigmatic blur and whether it was selective for the axis of the astigmatism. Figure 9 shows the results for three observers. In Figures 9A–9C, each bar shows the perceived neutral (isotropic) point for a single image before adaptation (gray) or after adaptation to the image with negative (blue) or positive (purple) astigmatism. Adaptation effects were assessed by comparing the mean settings before or after adaptation with t-tests. For all subjects and for most images, there are strong and significant shifts in the neutral point following adaptation, with shifts in opposite directions for the different axes of astigmatism. In particular, consistent with our prediction, negative astigmatism (vertical blurring) caused the original isotropic image to appear horizontally blurred, and thus required a physical shift in the neutral point toward the adapting axis (negative in this case). Similarly, adaptation to the positive astigmatism induced a corresponding shift in the perceived isotropic point toward horizontal blur. To directly characterize the actual aftereffect, we plotted the difference between the pre- and post-adapt settings, on average across subjects (Figure 9D). For most images, there are clear and opposite aftereffects following adaptation to the different axes. This indicates that adaptation to astigmatic blur induces strong and robust aftereffects that are selective for the actual form of the aberration.
Figure 9.

(A–C) Stimulus levels that appeared isotropic before or after adapting to the same image with negative (blue) or positive (purple) astigmatism tested on three subjects for individual images of noise, close-up textures, or natural scenes. The vertical axis represents the amount of astigmatism (in nm; negative for vertical and positive for horizontal) that makes the image appear isotropically blurred for the observer. (D) Difference in the perceived neutral point before and after adaptation to negative astigmatism (blue) or positive astigmatism (purple) shown on average across the three subjects and for each of the 11 tested images. The vertical axis represents the difference in perceived neutral point in terms of the amount of astigmatism (in nm) necessary for the observers to perceive the test images as isotropically blurred. Negative values mean that the observer shifted their neutral point to images more vertically oriented, and vice versa for positive values. Error bars represent standard deviation across measurements; * indicates significant differences (p < 0.05) before vs. after adaptation.
Adaptation to simulated blur through corrected optics
Note again that for the conditions of Figure 9 observers viewed the images with their natural pupils and native correction, and thus the retinal image was not controlled for any degradation introduced by the individual observer’s optics. However, because the effects of astigmatism were simulated directly on the image, these variations do not interact with the subject’s pupil size or with their natural astigmatism, residual defocus, or accommodation-related changes of focus. While the contribution of the subject’s natural aberrations varies across observers, these variations are minor relative to the imposed astigmatism, and the additional blur introduced will be equal (within each individual) across the series of physically blurred images. Thus, these uncontrolled observer differences should not affect the basic pattern of the aftereffects, though they might introduce baseline individual differences in the stimulus level that appears isotropic.
Nevertheless, to assess the potential contribution of the observer’s own optics to the aftereffects induced by the simulated blur, a similar experiment was conducted using Adaptive Optics to compensate for the subject’s aberrations. In this case, measurements were performed for either natural or corrected aberrations and controlled pupil size with a 6-mm artificial pupil (to limit the subject’s pupil size that ranged between 5.6 and 6.0 mm).
Figure 10 shows the shift in the perceived neutral point after adaptation to positive (horizontal, in blue) or negative (vertical, in purple) astigmatism, for the 4 observers (AD) and on average across subjects (E). The darker bars (left in each pair) represent the data without correction of astigmatism and HOA, and the lighter bars (right in the pair) represent the data after AO correction. Data are for the four different image types tested. As in the preceding experiment, for all subjects and for most images, there are strong shifts in the neutral point following adaptation, with shifts in opposite directions for the different axes of astigmatism. Moreover, similar aftereffects occurred whether or not the individual observer’s aberrations were corrected and the average magnitude of the aftereffects did not significantly differ between the corrected and uncorrected conditions. Thus, the control settings confirm that orientation-selective aftereffects are likely to occur from orientation-selective blur present in the retinal image.
Figure 10.

Adaptation effect to astigmatic blur with and without AO correction of the subject’s aberrations, tested on 4 subjects for individual images of noise, face, and natural scenes. (A–D) Difference in the perceived neutral point before and after adaptation to negative astigmatism (blue) or positive astigmatism (purple), for the 4 subjects tested, with and without the AO correction of the subject’s aberrations. (E) On average across subjects, * indicates significant differences (p < 0.05) before vs. after adaptation. No significant differences were found in the difference in perceived neutral point between the two conditions with and without AO correction. The vertical axis represents the difference in perceived neutral point in terms of the amount of astigmatism (in microns) necessary for the observers to perceive the test images as isotropically blurred.
Experiment 2: Selectivity of blur adaptation for the adapting image
The previous experiment showed that similar aftereffects of astigmatic blur occur for a wide range of images, when the adapting and test images are the same. Experiment 2 tested how adaptation to blur in one image generalizes to affect the perceived isotropic point for a different test image.
Figure 11 shows the shifts in the perceived neutral point for two observers, when adapting to a positive astigmatism (left panels) and to a negative astigmatism (right panels). The three rows of plots show how adaptation transferred across (a) very different stimuli (images of noise, pine needles, or a face); (b) very similar stimuli (3 samples of 1/f noise); or (c) different natural scenes (images of the face, houses, or tulips). The results again indicate that there is a strong adaptation effect that is selective for the axis of the astigmatism. Aftereffects were generally strongest when assessed with the same test image, though there is also substantial transfer of the blur aftereffect to the other test images. For example, aftereffects did not significantly differ across the same or different test images and showed only weak selectivity for one observer across the different natural images.
Figure 11.

Aftereffects of adapting to a positive (left panels) or negative (right panels) astigmatism for (a) very different stimuli (images of noise, pine needles, or a face); (b) very similar stimuli (3 samples of 1/f noise); or (c) different natural scenes (images of the face, houses, or tulips). Bars plot the shift in the perceived neutral point for each image measured for two different observers. The white circle indicates conditions when the adapting and test images were the same; * indicates significantly (p < 0.05) smaller aftereffects when the test and adapting images were different vs. the same. The vertical axis represents difference in the perceived neutral point in terms of amount of astigmatism (in nm) necessary for the observers to perceive the test images as isotropically blurred.
Experiment 3: Aftereffects dependent on local blur versus global shape
The preceding experiment examined the transfer of blur adaptation to different images. We next tested how the adaptation transferred across image size, and specifically, whether the aftereffects were more similar when the adapt and test images had the same blur (but different “shapes”) or when the images had the same “shape” (but consequently different levels of blur). Again, these stimuli differed in whether the second image was created by first magnifying and then blurring (for same blur), or by first blurring and then magnifying (for same shape).
The aftereffects for the face image are illustrated in Figure 12. If observers are adapting directly to the perceived shape (and if these transfer across size), then these aftereffects should be similar for the two sizes when the shapes remain equivalent. This is shown in the left panels for the three observers and for both axes of adaptation. In each case, there was no significant difference between the magnitude of the shifts induced by the 2- or 6-deg images. Conversely, when the larger image had the same level of blur but a different shape to the smaller image (right side of Figure 12), the larger image induced significantly weaker aftereffects in 5 of the 6 cases (right panel).
Figure 12.

Aftereffects for 2-deg and corresponding 6-deg images that had the same shape (blurred then magnified; left panels) or the same blur (magnified then blurred; right panels) for 3 observers. The vertical axis represents the difference in perceived neutral point in terms of amount of astigmatism (nm) necessary for the observers to perceive the test images as isotropically blurred. Negative, or positive, values mean the observer shifted their neutral point to images more vertically, or horizontally, oriented, respectively; * indicates a significant difference (p < 0.05) in the strength of the aftereffect for the two adaptation stimulus sizes.
Experiment 4: Blur adaptation and object orientation
Experiment 4 further explored the basis for the adaptation by asking how the aftereffects transferred across rotations between the adapt and test images. Figure 13 shows how the adaptation to orientation-selective blurring transferred across a change in the orientation of the face image. Again, if adaptation is adjusting to the face shape, then the aftereffect should be in the same direction at both test orientations; while if the adaptation is instead tied to the retinal orientation of the blur, then it should bias the appearance of the rotated test in the opposite direction. However, results for 3 observers tested were mixed. Both S1 and S2 showed significant aftereffects in the same direction at both test orientations for the face blurred with the negative astigmatism, while the shifts in the rotated test image were not significant following adaptation to positive astigmatism and thus did not discriminate between the two models. (Note that the sign of the effect is relative to the object orientation and not the image plane.) A third subject’s settings were consistent with retinotopically referenced adaptation in that the adaptation effect reversed sign with a 90-degree rotation of the test object. However, this subject’s data were highly variable and did not reach significance for any of the conditions.
Figure 13.

Adapting and test stimuli for comparing how astigmatic blur transfers across rotations in the image plane. (Left) Adaptation to positive astigmatism along the axis of the face and then tested at the same image orientation or rotated 90 deg. (Right) Adaptation to negative astigmatism along the image axis. The ordinate in the figure represents the difference in perceived neutral point in terms of amount of astigmatism (in nm) necessary for the observers to perceive the test images as isotropically blurred and is relative to the axis of the original image. Negative values mean that the observer shifted his neutral point to images more vertically oriented, and vice versa for positive values; * indicates significant (p < 0.05) shift relative to the pre-adapt setting.
Experiment 5: Adaptation and blur strength
In the final experiment, we asked how the aftereffect varied as a function of the level of adapting blur. Figure 14 shows the change in perceived neutral point as a function of the level of astigmatism in the adapting image. Aftereffects tended to saturate at the more extreme levels but showed little evidence for a diminution at the highest levels. This pattern is roughly similar to the pattern found for blurring images by varying the slope of the amplitude spectrum (Webster et al., 2002). Thus, at least over this range of astigmatic blur there continued to be robust adaptation. Over much of the tested range, the aftereffect increases roughly linearly with blur strength, with a slope of 0.45 over the linear range of the curves. Thus, no level of blur exhibited complete compensation for the very short-term timescale examined. Note that subject S1 showed an offset in their perceived isotropic point relative to the physically isotropic level. This might be a consequence of the presence of natural vertical astigmatism (as it is also supported by a consistent shift of the neutral focus point toward horizontal astigmatism, which does not occur when astigmatism and high-order aberrations are corrected) or a long-term adaptation to her natural astigmatism.
Figure 14.
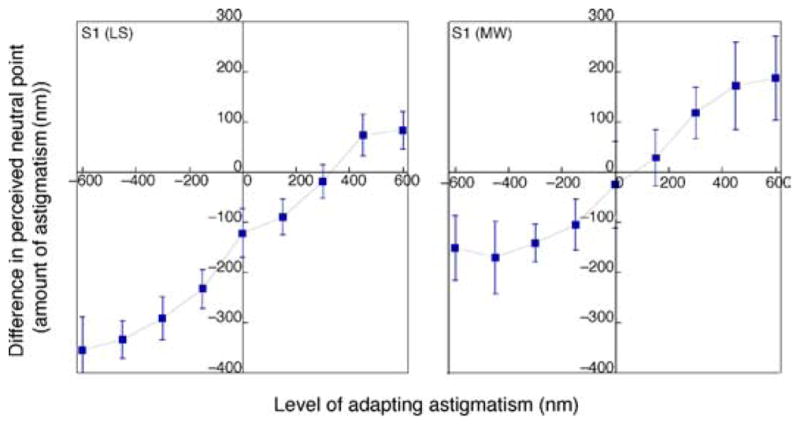
Perceived isotropic level as a function of the level of the adapting astigmatism for two subjects.
Discussion
Blur is a fundamental and salient attribute of image quality and an important factor limiting visual performance. Imperfections in the eye’s optics combine with many other factors (including diffraction, limited depth of field, and accommodative lags) so that to a certain extent, the retinal image is chronically degraded by blur. This raises the question of how visual coding is calibrated for retinal image blur, and whether this calibration can be matched to the specific patterns of blur introduced by the aberrations specific to the individual’s eye. Characterizing adaptation to optical aberrations is also important because these aberrations can be and are routinely altered in a variety of ways (e.g., contact lenses, intraocular lenses, progressive lenses, custom refractive surgery). Thus, how observers respond to these corrections may depend importantly on how neural responses adapt to these optical changes. Moreover, certain treatments such as refractive surgery introduce significant amounts of optical aberrations (Marcos, Barbero, Llorente, & Merayo-Lloves, 2001), while optical aids such as progressive spectacles produce significant amounts of astigmatism and field distortions (Villegas, Alcon, & Artal, 2006). Debate is ongoing whether patients adapt to their new pattern of optical aberrations so that vision is less compromised than the optical degradation of their retinal image quality would suggest. In any case, it is clear that if adaptation is important for maintaining image quality then the perceived quality of a refractive correction may depend on how adaptation adjusts to these changes.
We explored these adjustments by examining how visual coding adapts to lower order astigmatism. Our results reveal strong orientation-selective aftereffects in the appearance of images after adaptation to images that simulate moderate levels of astigmatism (Experiments 1 and 2), and similar effects occurred after correcting the subject’s aberrations. Moreover, the strength of these aftereffects increased roughly monotonically with the strength of the adapting blur over the range tested (Experiment 5). These results suggest that individuals are thus probably routinely adapted to their astigmatism. This is important because uncorrected or undercorrected levels of ocular astigmatism are highly prevalent. Astigmatism is a dominant aberration in uncorrected eyes (Porter et al., 2001) and remains a dominant aberration even in well-corrected eyes (Thibos et al., 2002). Moreover, among contact lens wearers astigmatism is common yet often uncorrected (Tan et al., 2007).
To compensate for the variety of optical errors that exist in real eyes, processes like adaptation must be able to adjust to the different patterns of blur introduced by different aberrations. The adjustments we find for astigmatism complement and extend a number of studies that have explored adaptation to optical defocus, specifically to test for neural adjustments to myopia (e.g., Mon-Williams et al., 1998; Pesudovs & Brennan, 1993; Rajeev & Metha, 2010; Rosenfield et al., 2004; Vera-Diaz, Gwiazda, Thorn, & Held, 2004), and suggest that the visual system can selectively adapt to different patterns of lower order aberrations. An orientation-selective blur aftereffect is perhaps not surprising given the prominence of orientation tuning in visual coding and the prominent orientation and spatial-frequency selectivity of contrast adaptation (Blakemore & Campbell, 1969; Bradley et al., 1988). Yet it remains important practically as an example of how this coding dimension can be calibrated to an important form of natural variation in the retinal image. It is less certain to what extent adaptation can also adjust to higher order aberrations. For example, if these aberrations produce more dimensions of variation in the PSF than the processes of adaptation can resolve, then there may be patterns of blur that are metameric for the adaptation (i.e., inducing equivalent adaptation effects) even if they lead to visually discriminable differences in blur. However, there are suggestions that observers may be able to at least partially adapt selectively to their own higher order aberrations (Artal, Chen, Fernandez et al., 2004; Chen et al., 2007; Sabesan & Yoon, 2010; Sawides, de Gracia et al., 2010). The pattern of aftereffects we observed is also important because it points to what is being adapted in blur adaptation. Studies of this adaptation have typically concentrated on attributes that limit visual resolution or that influence the perception of image focus. In the present study, we instead tested for aftereffects across images that did not vary in the overall level of blur but rather in the form of the blur. These images appear to vary most clearly in the orientation of the blur, and we showed that adaptation to them correspondingly induces strong aftereffects in the orientation bias in images. The fact that these biases partially transfer across images with very different spatial structure (Experiment 2) suggests that the adaptation is partly adjusting directly to the stimulus blur (though how this attribute is encoded by the visual system remains uncertain; Field & Brady, 1997; Georgeson, May, Freeman, & Hesse, 2007). Such adjustments could include adaptation to basic properties such as the spatial-frequency content of the image. However, the aftereffects also showed evidence of object-centric transfer across magnified or rotated images even though these changes strongly altered the retinocentric patterns of blur in the images (Experiments 3 and 4). Thus, the aftereffects might also include processes that are common to conventional figural aftereffects (Kohler & Wallach, 1944). Interestingly, clinicians often refrain from full correction of astigmatism because of their concerns about figural changes in the structure of the retinal images due to meridional magnification brought on by the spectacle lens magnification effect. It is generally felt that patients eventually become acclimated to these image distortions (Guyton, 1977), but it is also possible that the meridional adaptation that had developed prior to astigmatic correction slowly changes and thus the new post-correction PSF comes to appear isotropic. That is, even without spectacle magnification causing figural changes, meridian-specific defocus will introduce figural changes into images, and the rapid adaptation to these bares some of the trademarks of figural adaptation. A further implication is that—to the extent that blur can alter an attribute like perceived shape—visual processes that are normally recruited and adapted for encoding shape will be affected, so that a feature like blur that is often considered “low level” may trigger adaptation at many levels of the visual system.
Conclusions
Adaptation to images blurred by different axes of simulated astigmatism induces a strong orientation bias in the appearance of subsequently viewed images, and these biases show asymptotic increases with increasing blur strength. These aftereffects show that adaptation can be selective for different patterns of sphero-cylindrical errors and that perception is probably routinely adjusted through adaptation to the lower order aberrations characterizing an individual’s optics. The experiments performed with and without the AO correction of subjects’ aberrations show that these adaptation effects occur consistently, minimally affected by the presence of other high-order aberrations. The orientation-selective aftereffects induced by astigmatism share some characteristics with both contrast adaptation (in showing partial transfer of the blur across images with different content) and figural aftereffects (in showing partial transfer across images of the same objects at different sizes or orientations). Thus, changes in optical blur may alter a number of attributes of the retinal image in addition to image sharpness and may therefore invoke a number of distinct forms of adaptation.
Acknowledgments
This work was supported by EY-10834 (MW), EY-05109 (LT) EURYI-05-102-ES and FIS2008-02065 (SM), and pre-doctoral fellowship FIS2005-04382 (LS). The authors thank the subjects for their participation in this study. We also thank Carlos Dorronsoro and Pablo de Gracia for their help in the experiments involving Adaptive Optics.
Footnotes
Commercial relationships: none.
Contributor Information
Lucie Sawides, Instituto de Óptica, Consejo Superior de Investigaciones Científicas, CSIC, Madrid, Spain.
Susana Marcos, Instituto de Óptica, Consejo Superior de Investigaciones Científicas, CSIC, Madrid, Spain.
Sowmya Ravikumar, School of Optometry, Indiana University, Bloomington, IN, USA.
Larry Thibos, School of Optometry, Indiana University, Bloomington, IN, USA.
Arthur Bradley, School of Optometry, Indiana University, Bloomington, IN, USA.
Michael Webster, Department of Psychology, University of Nevada, Reno, NV, USA.
References
- Adams WJ, Banks MS, Van Ee R. Adaptation to three-dimensional distortions in human vision. Nature Neuroscience. 2001;4:1063–1064. doi: 10.1038/nn729. [DOI] [PubMed] [Google Scholar]
- Anstis S. Was el Greco astigmatic? Leonardo. 2002;35:208. [Google Scholar]
- Artal P, Chen L, Fernandez EJ, Singer B, Manzanera S, Williams DR. Neural compensation for the eye’s optical aberrations. Journal of Vision. 2004;4(4):4, 281–287. doi: 10.1167/4.4.4. http://www.journalofvision.org/content/4/4/4. [DOI] [PubMed]
- Artal P, Chen L, Manzanera S, Williams DR. Temporal dependence of neural compensation for the eye’s aberrations. Investigative Ophthalmology & Visual Science. 2004;45:E-Abstract 1077. [Google Scholar]
- Atchison DA, Lucas SD, Ashman R, Huynh MA, Schilt DW, Ngo PQ. Refraction and aberration across the horizontal central 10 degrees of the visual field. Optometry Visual Science. 2006;83:213–221. doi: 10.1097/01.opx.0000214382.75847.c4. [DOI] [PubMed] [Google Scholar]
- Atchison DA, Scott DH, Charman WN. Hartmann–Shack technique and refraction across the horizontal visual field. Journal of the Optical Society of America A. 2003;20:965–973. doi: 10.1364/josaa.20.000965. [DOI] [PubMed] [Google Scholar]
- Battaglia PW, Jacobs RA, Aslin RN. Depth-dependent blur adaptation. Vision Research. 2003;44:113–117. doi: 10.1016/j.visres.2003.09.010. [DOI] [PubMed] [Google Scholar]
- Bilson AC, Mizokami Y, Webster MA. Visual adjustments to temporal blur. Journal of the Optical Society of America A. 2005;22:2281–2288. doi: 10.1364/josaa.22.002281. [DOI] [PubMed] [Google Scholar]
- Blakemore C, Campbell FW. On the existence of neurones in the human visual system selectively sensitive to the orientation and size of retinal images. The Journal of Physiology. 1969;203:237–260. doi: 10.1113/jphysiol.1969.sp008862. [DOI] [PMC free article] [PubMed] [Google Scholar]
- Bradley A, Switkes E, De Valois KK. Orientation and spatial frequency selectivity of adaptation to colour and luminance gratings. Vision Research. 1988;28:841–856. doi: 10.1016/0042-6989(88)90031-4. [DOI] [PubMed] [Google Scholar]
- Castejon-Mochon J, Lopez-Gil N, Benito A, Artal P. Ocular wave-front aberration statistics in a normal young population. Vision Research. 2002;29:115–128. doi: 10.1016/s0042-6989(02)00085-8. [DOI] [PubMed] [Google Scholar]
- Chen L, Artal P, Gutierrez D, Williams DR. Neural compensation for the best aberration correction. Journal of Vision. 2007;7(10):9, 1–9. doi: 10.1167/7.10.9. http://www.journalofvision.org/content/7/10/9. [DOI] [PubMed]
- Field DJ, Brady N. Visual sensitivity, blur and the sources of variability in the amplitude spectra of natural scenes. Vision Research. 1997;37:3367–3383. doi: 10.1016/s0042-6989(97)00181-8. [DOI] [PubMed] [Google Scholar]
- Gambra E, Sawides L, Dorronsoro C, Marcos S. Accommodative lag and fluctuations when optical aberrations are manipulated. Journal of Vision. 2009;9(6):4, 1–15. doi: 10.1167/9.6.4. http://www.journalofvision.org/content/9/6/4. [DOI] [PubMed]
- Georgeson MA, May KA, Freeman TC, Hesse GS. From filters to features: Scale–space analysis of edge and blur coding in human vision. Journal of Vision. 2007;7(7):7, 1–21. doi: 10.1167/7.13.7. http://www.journalofvision.org/content/7/13/7. [DOI] [PubMed]
- Georgeson MA, Sullivan GD. Contrast constancy: Deblurring in human vision by spatial frequency channels. The Journal of Physiology. 1975;252:627–656. doi: 10.1113/jphysiol.1975.sp011162. [DOI] [PMC free article] [PubMed] [Google Scholar]
- Guyton DL. Prescribing cylinders: The problem of distortion. Survey of Ophthalmology. 1977;22:177–188. doi: 10.1016/0039-6257(77)90054-6. [DOI] [PubMed] [Google Scholar]
- Kohler W, Wallach H. Figural aftereffects: An investigation of visual processes. Proceedings of the American Philosophical Society. 1944;88:269–357. [Google Scholar]
- Liang J, Williams DR, Miller DT. Supernormal vision and high resolution retinal imaging through adaptive optics. Journal of the Optical Society of America A. 1997;14:2884–2892. doi: 10.1364/josaa.14.002884. [DOI] [PubMed] [Google Scholar]
- Marcos S, Barbero S, Llorente L, Merayo-Lloves J. Optical response to LASIK surgery for myopia from total and corneal aberration measurements. Investigative Ophthalmology & Visual Sciences. 2001;42:3349–3356. [PubMed] [Google Scholar]
- Marcos S, Sawides L, Gambra E, Dorronsoro C. Influence of adaptive-optics ocular aberration correction on visual acuity at different luminances and contrast polarities. Journal of Vision. 2008;8(13):1, 1–12. doi: 10.1167/8.13.1. http://www.journalofvision.org/content/8/13/1. [DOI] [PubMed]
- Mon-Williams M, Tresilian JR, Strang NC, Kochhar P, Wann JP. Improving vision: Neural compensation for optical defocus. Proceedings: Biological Sciences. 1998;265:71–77. doi: 10.1098/rspb.1998.0266. [DOI] [PMC free article] [PubMed] [Google Scholar]
- Pesudovs K, Brennan N. Decreased uncorrected vision after a period of distance fixation with spectacle wear. Optometry and Vision Science. 1993;70:528–531. doi: 10.1097/00006324-199307000-00002. [DOI] [PubMed] [Google Scholar]
- Porter J, Guirao A, Cox I, Willaims DR. Monochromatic aberrations of the human eye in a large population. Journal of the Optical Society of America A. 2001;18:1793–1803. doi: 10.1364/josaa.18.001793. [DOI] [PubMed] [Google Scholar]
- Raasch TW. Spherocylindrical refractive errors and visual acuity. Optometry and Vision Science, Official Publication of the American Academy of Optometry. 1995;72:272–275. doi: 10.1097/00006324-199504000-00008. [DOI] [PubMed] [Google Scholar]
- Rajeev N, Metha A. Enhanced contrast sensitivity confirms active compensation in blur adaptation. Investigative Ophthalmology & Visual Science. 2010;51:1242–1246. doi: 10.1167/iovs.09-3965. [DOI] [PubMed] [Google Scholar]
- Rosenfield M, Hong SE, George S. Blur adaptation in myopes. Optometry and Vision Science. 2004;81:657–662. doi: 10.1097/01.opx.0000144743.34976.da. [DOI] [PubMed] [Google Scholar]
- Sabesan R, Yoon G. Visual performance after correcting higher order aberrations in keratoconic eyes. Journal of Vision. 2009;9(5):6, 1–10. doi: 10.1167/9.5.6. http://www.journalofvision.org/content/9/5/6. [DOI] [PMC free article] [PubMed]
- Sabesan R, Yoon G. Neural compensation for long-term asymmetric optical blur to improve visual performance in keratoconic eyes. Investigative Ophthalmology & Visual Science. 2010;51:3835–3839. doi: 10.1167/iovs.09-4558. [DOI] [PMC free article] [PubMed] [Google Scholar]
- Sawides L, de Gracia P, Dorronsoro C, Gambra E, Webster M, Marcos S. Adapting to blur produced by ocular high order aberrations. Investigative Ophthalmology & Visual Science. 2010;(Suppl):E-Abstract #6347. [Google Scholar]
- Sawides L, Gambra E, Pascual D, Dorronsoro C, Marcos S. Visual performance with real-life tasks under adaptive-optics ocular aberration correction. Journal of Vision. 2010;10(5):19, 1–12. doi: 10.1167/10.5.19. http://www.journalofvision.org/content/10/5/19. [DOI] [PubMed]
- Schwendeman FJ, Ogden BB, Horner DG, Thibos LN. Effect of sphero-cylinder blur on visual acuity. Optometry and Vision Science. 1997;74:180. [Google Scholar]
- Tan J, Papas E, Carnt N, Jalbert I, Skotnitsky C, Shiobara M, et al. Performance standards for toric soft contact lenses. Optometry and Vision Science. 2007;84:422–428. doi: 10.1097/OPX.0b013e318059063b. [DOI] [PubMed] [Google Scholar]
- Thibos LN, Hong X, Bradley A, Cheng X. Statistical variation of aberration structure and image quality in a normal population of healthy eyes. Journal of the Optical Society of America A, Optics, Image Science, and Vision. 2002;19:2329–2348. doi: 10.1364/josaa.19.002329. [DOI] [PubMed] [Google Scholar]
- Thibos LN, Wheeler W, Horner D. Power vectors: An application of Fourier analysis to the description and statistical analysis of refractive error. Optometry and Vision Science. 1997;74:367–375. doi: 10.1097/00006324-199706000-00019. [DOI] [PubMed] [Google Scholar]
- Vera-Diaz FA, Gwiazda J, Thorn F, Held R. Increased accommodation following adaptation to image blur in myopes. Journal of Vision. 2004;4(12):10, 1111–1119. doi: 10.1167/4.12.10. http://www.journalofvision.org/content/4/12/10. [DOI] [PubMed]
- Vera-Diaz FA, Woods RL, Peli E. Shape and individual variability of the blur adaptation curve. Vision Research. 2010;50:1452–1461. doi: 10.1016/j.visres.2010.04.013. [DOI] [PMC free article] [PubMed] [Google Scholar]
- Villegas EA, Alcon E, Artal P. The effect of correcting small astigmatisms on visual acuity. Investigative Ophthalmology & Visual Sciences. 2006;47:E-Abstract, 1173. [Google Scholar]
- Watson TL, Clifford CWG. Pulling faces: An investigation of the face-distortion aftereffect. Perception. 2003;32:1109–1116. doi: 10.1068/p5082. [DOI] [PubMed] [Google Scholar]
- Webster MA, Georgeson MA, Webster SM. Neural adjustments to image blur. Nature Neuroscience. 2002;5:839–840. doi: 10.1038/nn906. [DOI] [PubMed] [Google Scholar]
- Webster MA, Maclin O. Figural aftereffects in the perception of faces. Psychonomic Bulletin and Review. 1999;6:647–653. doi: 10.3758/bf03212974. [DOI] [PubMed] [Google Scholar]
- Webster MA, Miyahara E. Contrast adaptation and the spatial structure of natural images. Journal of the Optical Society of America A, Optics, Image Science, and Vision. 1997;14:2355–2366. doi: 10.1364/josaa.14.002355. [DOI] [PubMed] [Google Scholar]
- Webster MA, Mizokami Y, Svec LA, Elliott SL. Neural adjustments to chromatic blur. Spatial Vision. 2006;19:111–132. doi: 10.1163/156856806776923380. [DOI] [PubMed] [Google Scholar]
- Webster MA, Webster SM, MacDonald J, Bharadwadj S. Adaptation to blur. In: Rogowitz BE, Pappas TN, editors. Human vision and electronic imaging VI, SPIE proceedings. Vol. 4299. 2001. pp. 69–78. [Google Scholar]
- Yehezkel O, Belkin M, Sagi D, Polat U. Adaptation to astigmatic lens: Effects on lateral interactions [Abstract] Journal of Vision. 2005;5(8):486, 486a. doi: 10.1167/5.8.486. http://www.journalofvision.org/content/5/8/486. [DOI]
- Zhao L, Chubb C. The size-tuning of the face distortion aftereffect. Vision Research. 2001;41:2979–2994. doi: 10.1016/s0042-6989(01)00202-4. [DOI] [PubMed] [Google Scholar]