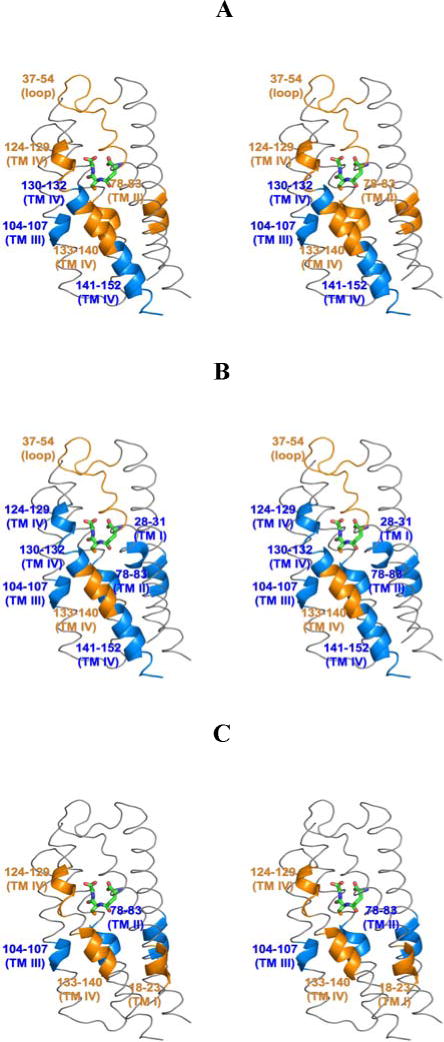
Figure 6.
Stereo views of the impact of inhibitor binding on the H/D exchange behavior of the MPGES1•GSH complex.7 The effects of inhibitors 2, 3 and 4 are shown in panels A, B, and C, respectively. The GSH molecule is shown in stick representation. Regions of enhanced exchange are shown in orange while those with decreased exchange are in blue. Only one potential binding site in the trimer is illustrated.

