

Abstract
In murine macrophages stimulated with macrophage-colony-stimulating factor (M-CSF), signals essential to macropinosome formation are restricted to the domain of plasma membrane enclosed within cup-shaped, circular ruffles. Consistent with a role for these actin-rich structures in signal amplification, microscopic measures of Rac1 activity determined that disruption of actin polymerization by latrunculin B inhibited ruffling and the localized activation of Rac1 in response to M-CSF. To test the hypothesis that circular ruffles restrict the lateral diffusion of membrane proteins that are essential for signaling, we monitored diffusion of membrane-tethered, photoactivatable green fluorescent protein (PAGFP-MEM) in ruffling and non-ruffling regions of cells. Although diffusion within macropinocytic cups was not inhibited, circular ruffles retained photoactivated PAGFP-MEM inside cup domains. Confinement of membrane molecules by circular ruffles could explain how actin facilitates positive feedback amplification of Rac1 in these relatively large domains of the plasma membrane, thereby organizing the contractile activities that close macropinosomes.
Key words: Macropinocytosis, Membrane diffusion, Membrane dynamics
Introduction
In response to stimulation by growth factors, many cells extend actin-rich, circular ruffles that close into endocytic vacuoles called macropinosomes. Macropinocytosis begins with deformation of the plasma membrane by actin-based motile activities, first into linear or curved ruffles, then into cup-shaped circular ruffles at the cell surface (Swanson, 2008). This ruffle closure is followed by cup closure, in which the circular ruffle constricts at its distal margin and separates from the plasma membrane as a macropinosome inside the cell (Li et al., 1997).
Previous studies identified molecules that regulate macropinocytosis, including phosphoinositide 3-kinase (PI3K) and Rac1 (Araki et al., 1996; Yoshida et al., 2009). Activated growth factor receptors recruit and activate type I PI3K, which generates phosphatidylinositol (3,4,5)-trisphosphate [PtdIns(3,4,5)P3] in the inner leaflet of the plasma membrane. Inhibitors of PI3K allow ruffle closure but inhibit cup closure (Araki et al., 2003; Araki et al., 1996), indicating that PtdIns(3,4,5)P3 directs the late stage of macropinosome formation. Rac1 is requisite in the macrophage ruffling response to macrophage colony-stimulating factor (M-CSF) (Cox et al., 1997; Wells et al., 2004).
How are the movements of the actin cytoskeleton organized to close cup-shaped extensions into intracellular vesicles? Concentrated PtdIns(3,4,5)P3 or Rac1 in the macropinocytic cup could regulate actin–myosin-based contractions that close the cup. Imaging of signaling in response to M-CSF showed that PtdIns(3,4,5)P3 generation and Rac1 activation closely follow ruffle closure and are confined within circular ruffles (Yoshida et al., 2009). This indicates that circular ruffles create domains of plasma membrane that facilitate signal amplification and the contractile activities of cup closure. We hypothesize that molecules necessary for Rac1 signal amplification are confined to circular ruffles by an actin-based diffusion barrier in the cup. We therefore conducted experiments to probe the existence and location of diffusion barriers in the inner leaflet of ruffling plasma membrane.
Results
The relationship between actin-rich membrane ruffles and Rac1 signal amplification was examined by measuring the effect of the actin-depolymerizing agent latrunculin B and the N-WASp inhibitor wiskostatin (Peterson et al., 2004; Legg et al., 2007) on Rac1 activity. Quantitative Förster resonance energy transfer (FRET) microscopy was used to observe bone marrow-derived macrophages (BMM) expressing Citrine–Rac1 and Cerulean–PBD. PBD, derived from Pak1, binds the active (GTP-bound) form of Rho GTPases Rac and Cdc42 (Edwards et al., 1999). The Citrine and Cerulean chimeras produce significant FRET interactions in regions of the cell where Rac1 is active. FRET stoichiometry was used to determine G*, which is the fraction of Citrine–Rac1 or Citrine–Cdc42 that is activated in any given region of the image (Hoppe and Swanson, 2004). For Rac1, G* values in forming macropinosomes were higher than in the surrounding cytoplasm, indicating that Rac1 amplification was restricted to the cup domain (Fig. 1A,C,F; see supplementary material Movie 1). After M-CSF addition, cells treated with latrunculin B or wiskostatin did not ruffle (Fig. 1D; see supplementary material Movie 2; wiskostatin images not shown) and the small increase of Rac1 activity was delocalized (Fig. 1B,E). This indicated that Rac1 signal amplification in cups was actin-dependent. Comparable FRET measurements between Cerulean–PBD and Citrine–Cdc42 demonstrated no increase in the Cdc42 activity in forming macropinosomes (Fig. 1E; images not shown).
Fig. 1.

Focal activation of Rac1 during macropinocytosis. (A–D) FRET interactions of Cerulean-PBD and Citrine–Rac1 in control (A,C) and latrunculin B-treated BMM (B,D) in response to M-CSF. (A,B) Left: Phase contrast; right: G*. Scale bars: 4 μm. (C,D) Time series for subregions of the cells shown in A and B, highlighting a forming macropinosome (C), and a comparable region of a latrunculin B-treated cell (D). Top row: Phase contrast; bottom row: G*. Scale bars: 1 μm. All color bars indicate G* values. (E) Quantification of total Citrine-Rac1 activity in control and latrunculin B- or wiskostatin-treated BMM (n=5 for all conditions). Dotted line indicates when M-CSF was added. (F) To quantify GTPase activation, the average G* in a forming macropinosome was divided by the average G* in the entire cell at each time point (n=10 for each). The resulting ratio indicates the relative change in GTPase activity in the forming macropinosomes, with numbers greater than 1.0 indicating localized increases in activity. Sequences were aligned by the timing of ruffle closure (t=60 seconds). Ratios for Rac1 were significantly higher than cytoplasm values (*P<0.001) from 80 to 100 seconds following the beginning of macropinosome formation. Ratios for Cdc42 did not significantly change during macropinosome formation. Error bars indicate s.d.
To test the hypothesis that ruffles create barriers to diffusion in the inner leaflet of the plasma membrane, we measured the redistribution of plasma membrane-localized, photoactivatable green fluorescent protein (PAGFP-MEM), whose fluorescence following photoactivation increases 100-fold (Patterson and Lippincott-Schwartz, 2002). We first investigated whether ruffles could retain PAGFP-MEM near an initial region of photoactivation. Coexpression and imaging of monomeric Cherry (mCherry)–MEM chimeras provided a reference fluorescence that reported plasma membrane distribution. Ratiometric images, generated by dividing pixel values in the PAGFP-MEM images by the corresponding values in the mCherry–MEM images, normalized PAGFP-MEM distribution in the various ruffling morphologies. We activated small patches of PAGFP-MEM molecules and measured the rates at which fluorescence intensity decreased by diffusion in the plasma membrane (Fig. 2A). Curve-fitting analyses of fluorescence loss in flat regions of cells gave a diffusion coefficient for PAGFP-MEM of 1.1×10⁻⁹ cm2/second (Fig. 2B; supplementary material Fig. S1A,B). Near the linear ruffles, diffusion of the activated molecules was slightly inhibited (Fig. 2C). However, PAGFP-MEM activated inside circular ruffles was retained much more than PAGFP-MEM in flat or ruffled membrane (Fig. 2D; see supplementary material Movie 3), indicating that ruffled surfaces created effective barriers to diffusion of PAGFP-MEM. Quantitative measurements of the fluorescence depletion supported this observation (Fig. 2E). The retention pattern for membrane cups leveled off approximately 15 seconds after activation, suggesting that activated molecules were retained in the activation region. The steep initial decline in fluorescence retention in all of the membrane structures could be explained by the fact that PAGFP-MEM molecules were photoactivated in both the top and bottom (i.e. substrate-adherent) membranes of the cells. Accordingly, plots of fluorescence depletion reflect the dynamics of PAGFP-MEM in both membranes, including the unrestricted diffusion in the flat, bottom membrane.
Fig. 2.

Selective photoactivation of PAGFP-MEM in plasma membranes. (A) Schematic of experimental protocol for XYT experiments. PAGFP-MEM was photoactivated in regions of flat (a), ruffled (b) or cupped membrane (c). Fluorescence intensities were collected in these activation regions over time. Loss of fluorescence indicated diffusion of activated PAGFP-MEM out of the activation region; conversely, retention of activated PAGFP-MEM indicated restricted diffusion. (B–D) Images of different macropinocytic structures. Top row, mCherry–MEM; middle row: PAGFP-MEM; bottom row, PAGFP:mCherry ratio. From left to right: 1 second pre-activation, 1 second post-activation, 10 seconds post-activation, 20 seconds post-activation. Scale bars: 1 μm. Color bars indicate relative fluorescence intensities of ratio images. (B) Photoactivation in flat membrane. (C) Photoactivation in ruffle membrane. (D) Photoactivation in a macropinocytic cup. (E) Quantification of the fluorescence decrease in plasma membrane (n=5 for each condition). Membrane ruffles and cups demonstrate significant retention of photoactivated PAGFP-MEM. (F) Modeling of the effects of cup height on probe retention. Increasing cup height without adding a barrier or decreasing the diffusion coefficient did not affect molecule retention and could not account for the experimental values. Error bars indicate s.d.
The apparent retention of PAGFP-MEM in the cup could be a consequence of its topography. Diffusion of PAGFP-MEM molecules activated inside membrane cups entails travel up the inner cup wall and down the outer cup wall. Apparent retention of activated PAGFP-MEM could simply reflect diffusion in the z-axis. However, simulations of diffusion in macropinocytic cups of various heights indicated that, in the absence of some type of barrier, diffusion in the z-axis would increase the retention of molecules in the activation spot only slightly (Fig. 2F; supplementary material Fig. S1C). The observed retention of PAGFP-MEM in cups could only be simulated by inclusion of a diffusion barrier in the cup structure (i.e. a region in which the diffusion coefficient was 1–10% of the diffusion coefficient in flat membrane).
To verify that the circular structures we analyzed were not closed pinosomes, we visualized photoactivated PAGFP-MEM using through-focus image acquisition and three-dimensional (3D) reconstruction by image deconvolution. These experiments showed directly that open macropinocytic cups retained PAGFP-MEM. Activated PAGFP-MEM molecules were visible in macropinocytic cups at least 19.5 seconds after activation (Fig. 3A–C). Comparable 3D reconstructions of activated PAGFP-MEM in flat membrane regions showed rapid and complete loss of fluorescence (supplementary material Fig. S2).
Fig. 3.

4D reconstruction of activated PAGFP-MEM in an open macropinocytic cup. Through-focus z-stacks were collected of PAGFP-MEM and mCherry at regular intervals after photoactivation of PAGFP-MEM in a cup. (A,B) Projections of a macropinocytic cup. Top row: mCherry–MEM; bottom row: PAGFP:mCherry ratio. From left to right: 6.5, 13.0 and 19.5 seconds after activation of PAGFP-MEM. (A) XY projection of a macropinocytic cup and surrounding cellular region. Yellow boxes delineate the macropinocytic cup. (B) XZ projections of the macropinocytic cup (side view). Fields correspond to the regions marked by the yellow boxes in A. (C) Cross-sections of macropinocytic cups showing distribution of mCherry–MEM (red) and PAGFP:mCherry ratio (pseudocolor) at 13 seconds after photoactivation of PAGFP-MEM. Green line shows region of cross-section. Color bars indicate relative fluorescence intensities of ratio images. Scale bars: 1.0 μm.
Diffusion inside cups was further characterized using fluorescence intensity linescans of widefield microscopic images. mCherry–MEM linescans showed membrane contours. For open macropinocytic cups, the pixel intensities for mCherry–MEM were roughly equivalent inside and outside the cup, as fluorescence in each region derived from two layers of membrane (Fig. 4A,B). By contrast, mCherry–MEM fluorescence from closed macropinosomes should include four layers of membrane: the top and bottom membranes of the cell plus the top and bottom membranes of the macropinosome. Accordingly, the mCherry–MEM pixel intensities measured from closed macropinosomes were 2.15 times the intensities of the surrounding area (supplementary material Fig. S3). This allowed us to use fluorescence linescans of mCherry–MEM images to confirm that all of the circular structures included in the quantification for Fig. 2E were unclosed cups.
Fig. 4.

Fluorescence intensity linescans of cupped and flat membrane. (A,D) Representative linescans (yellow lines) in cupped and flat membrane, respectively. From left to right: mCherry–MEM image 1 second prior to activation, PAGFP:mCherry ratio image 1 second after activation, ratio image 10 seconds after activation, ratio image 20 seconds after activation. Scale bars: 1.0 μm. Color bars indicate relative fluorescence intensities of ratio images. (B,E) Linescans of mCherry–MEM fluorescence intensities in cupped and flat membrane, respectively. (C,F) Linescans of PAGFP/mCherry fluorescence ratios in cupped and flat membrane, respectively, at 1, 10 and 20 seconds after photoactivation. Green lines indicate the perimeter of the activation region. Similar fluorescence patterns were seen for seven macropinocytic cups and for ten regions of flat membrane.
Fluorescence linescans also allowed us to measure the extent to which different membrane structures inhibited lateral diffusion of activated PAGFP-MEM. The initial fluorescence profiles for patches of activated PAGFP-MEM showed Gaussian distributions. In flat membrane, the intensity decreased rapidly to that of the surrounding plasma membrane (Fig. 4D–F), suggesting that the activated molecules diffused out of the activation region. For circular ruffles, the intensity profiles in the activation region remained elevated (Fig. 4C), indicating retention of the photoactivated PAGFP-MEM in the cup region.
Retention of activated PAGFP-MEM in macropinocytic cups could be explained either by decreased diffusivity throughout the entire cup or by barriers localized to the circular ruffles. To determine whether diffusion in the base of the cup resembles diffusion outside of the cup, we activated PAGFP-MEM in subregions of the cup structures and observed fluorescence redistribution within the cup. Imaging (Fig. 5A, see supplementary material Movie 4) and intensity linescans (Fig. 5B,C) of the PAGFP:mCherry fluorescence ratio (see Materials and Methods) revealed that the initially asymmetrical activation profiles rapidly leveled off inside the cup. Modeling simulated PAGFP-MEM redistribution by creating an initially hemispherical cohort of activated molecules that redistributed with the diffusion coefficients of flat membrane (10−9 cm2/second) or barriers (10−11 cm2/second or 0 cm2/second) (Fig. 5E,F). Diffusion barriers were assigned to different regions of the cup structure: the base, the inner wall, the distal rim, and combinations of those regions. The model most resembled the experimental data when the walls and rim of circular ruffles were assigned a barrier function and the base of the cup resembled flat membrane (Fig. 5G,I). By contrast, simulations that assigned low diffusion coefficients to the base, walls and rim yielded results that did not resemble the observations (Fig. 5H,J). This is consistent with a mechanism in which proteins diffuse normally in the membrane of the base of the cup but encounter barriers in the ruffles that comprise the cup wall.
Fig. 5.

Diffusion dynamics within membrane cups indicate that the barrier localizes to the cup walls. (A–C) Fluorescence redistribution following asymmetric activation of PAGFP-MEM in macropinocytic cups. (A) Representative images. From left to right: mCherry–Mem image 1 second prior to activation, PAGFP:mCherry ratio images 1, 10 and 20 seconds after activation. Yellow lines indicate position of linescans. Green boxes indicate the perimeter of the activation region. Scale bar: 1.0 μm. Color bars indicate relative fluorescence intensities of ratio images. (B) Linescan measurements of mCherry–MEM pixel intensities. (C) Linescan measurements of PAGFP:mCherry ratio values at 1, 10, and 20 seconds after photoactivation. Similar fluorescence patterns were seen in five macropinocytic cups. Paired vertical lines indicate the location of the cup wall. Green lines indicate the edge of the activation region. (D) Fluorescence measurements of activated and non-activated regions in the base of the cup over time, n=5. (E–J) Modeling of diffusion within cups. (E,F) Diagrams of activation patterns used to model diffusion inside the cup, showing views from above (C) and in sagital section (F). (G,H) Distributions of molecules along the diameter of the base of the cup normal to the activation boundary, measured at 1, 10 and 20 seconds after activation. (G) When the diffusion coefficient in the walls is 10−11 cm2/second (i.e., a barrier) and in the base of the cup is 10−9 cm2/second, fluorophore redistribution resembles the experimental data in C. (H) When the diffusion coefficients of the walls and base are both set to 10−11 cm2/second, fluorophore redistribution does not resemble the experimental data. (I,J) Modeling of the time course of fluorophore decrease from the activated region (triangles) and increase in the non-activated region (circles) when diffusion coefficients are set as in G (I) and H (J). The model resembles the experimental observations in D when the base of the cup has the same diffusion coefficient as membrane outside the cup (I).
Discussion
This study demonstrates that circular ruffles create barriers to protein diffusion in membranes. Diffusion barriers have been previously identified in cleavage furrows (Schmidt and Nichols, 2004) and in the leading edge of cellular protrusions (Weisswange et al., 2005). Whereas those structures result from larger changes in cell morphology, macropinocytic circular ruffles are self-organized. Consequently, macropinocytic diffusion barriers are independently capable of focusing signal amplification in discrete, seemingly arbitrary regions of the plasma membrane.
The molecular basis of the barrier remains unknown. Diffusion of membrane proteins or phospholipids could be restricted at the distal margins of ruffles, either by specific fence-like structures that constrain the lateral movements of membrane-associated molecules or by physical constraints imposed by the high membrane curvature at the ruffle edge. In lipid rafts, tight packing of phospholipids reduces diffusivity (Simons and Toomre, 2000); raft-like structures at the distal margins of the macropinocytic cups could create effective barriers. Alternatively, the underlying actin meshwork could limit diffusion in the plasma membrane, although a previous study suggested that cortical actin does not directly influence membrane diffusion (Frick et al., 2007). The slight slowing of PAGFP-MEM diffusion observed in linear ruffles, relative to flat membrane (Fig. 2C,E), suggests that the barrier is intrinsic to ruffle structure. Actin or actin-associated proteins in ruffles could create effective barriers simply by slowing lateral diffusion of molecules along the broad face of the ruffle. Regardless of its physical basis, the constraint on diffusion created by actin-rich ruffles could provide a mechanism for biasing signal amplification in self-organizing systems, leading to actin-dependent amplification of signals in ruffle-rich regions of the cell.
The efficacy of the barrier for signal amplification is maximized in the circular ruffle, where diffusion is inhibited in all directions. Functionally, as a patch of plasma membrane with amplified activity of signaling proteins (Yoshida et al., 2009), the circular ruffle represents a novel signaling domain. Activated receptors recruit and activate lipid-modifying enzymes, such as PI3K, which recruit other enzymatic proteins to the membrane domain through the formation of lipid or phospholipid species. In the absence of barriers, diffusion in the membrane could dissipate receptor-generated signals to subthreshold levels and the initial activation signal would be unable to reach the concentrations needed to activate later signals. Barriers could allow concentrations of lipids or activated GTPases to remain high, thereby allowing the cell to recruit or activate the molecules that actuate the late stages of signaling. Accordingly, the actin-dependent amplification of Rac1 within circular ruffles indicates a positive feedback amplification mechanism in which restricted movement of diffusible signaling intermediates allows their concentration in the plasma membrane to exceed some transition threshold. Similarly, transient increases of PtdIns(3,4,5)P3 that follow immediately after ruffle closure could locally activate guanine nucleotide exchange factors for Rac1 or other GTPases (Yoshida et al., 2009). Conversely, by stimulating actin polymerization necessary for circular ruffle formation, Rac1 could amplify PI3K activity through an actin-dependent mechanism. This mechanism of localizing signal amplification would be distinct from processes such as chemotaxis or phagocytosis, because it is independent of external orienting factors. Moreover, focal signal amplification through restricted diffusion could provide a mechanism for cells to respond to lower concentrations of growth factor.
Materials and Methods
Cell culture
BMM were generated as previously described (Araki et al., 2003; Swanson, 1989). Bone marrow exudate was obtained from femurs of C57BL/6J mice. Marrow was cultured in medium (DMEM with 20% FBS and 30% L cell-conditioned medium) promoting the differentiation of macrophages. Bone marrow cultures were differentiated for 1 week with additions of fresh differentiation medium at days 3 and 6. Following differentiation, macrophages were transfected and plated onto 25-mm circular coverslips. Cultures were incubated overnight in medium lacking M-CSF (DMEM with 20% heat-inactivated FBS). All experiments were performed the day after plating. All animal experiments were performed according to the relevant regulatory standards.
Constructs and cell transfection
Fluorophores were localized to the inner leaflet of the plasma membrane using the membrane localization domain from neuromodulin (MEM), a protein that associates with membrane via palmitoylation (Liu et al., 1993). BMM were transfected with plasmids encoding PAGFP-MEM and mCherry–MEM via Amaxa Nucleofector II, using automated protocol Y-01. The conditions and reagents for macropinocytosis observation were 200 ng/mL M-CSF (R&D Systems) in Ringer's Buffer (155 mM NaCl, 5 mM KCl, 2 mM CaCl2, 1 mM MgCl2, 2 mM NaH2PO4, 10 mM glucose and 10 mM HEPES at pH 7.2). In some experiments, latrunculin B (5 μM) or wiskostatin (500 nM) were added to cells 5 minutes before addition of M-CSF. All imaging experiments were temperature controlled at 37°C.
XYT photoactivation experiments
Cells were imaged using an Olympus FV-500 confocal microscope fitted with a 60×, 1.45 NA oil immersion objective. The microscope was equipped with diode-pulse (for photoactivation), argon (for GFP imaging), and HeNe green (for mCherry imaging) lasers. Image collection used Fluoview FV500 imaging software. Images were acquired at 1 frame/second using line sequential scanning. Three pre-activation images were collected for each experiment: these images were averaged to provide a fluorescence baseline reading. Photoactivation of PAGFP-MEM required one image scan with the diode laser set to 100% intensity. Photoactivation in defined regions of the cell membrane created patches of GFP fluorescence, whose fluorescence intensity decreased quickly by molecule diffusion in the membrane.
Fluorescence intensities and PAGFP:mCherry ratiometric images were quantified using the ‘region mean intensity’ measurement function in MetaMorph (Molecular Dynamics, Sunnyvale, CA). The averaged pre-activation images established a baseline fluorescence that was subtracted from all post-activation images. A normalized fluorescence for each post-activation image was calculated by dividing its fluorescence by the initial post-activation timepoint fluorescence.
Computer modeling experiments
Three-dimensional models of the flat and cupped membranes were constructed using the transient diffusion module of COMSOL Multiphysics 3.4 (COMSOL, Burlington, MA). The flat membrane (supplementary material Fig. S1A) was represented by two disks of 5.0 μm radius, ro, and 0.05 μm thickness, t, representing the top and bottom layers of the membrane, respectively. The outer radius, ro, was chosen to ensure that no molecules reached the outer edge of the model geometry during the time simulated. The cupped membrane (supplementary material Fig. S1C) was represented by a top layer geometry of an inner radius, ri, of 1.1 μm. The distance between inner and outer cup walls, w, was 150 nm, and cup height, h, was variable from 0.5 μm to 5.0 μm. The membrane thickness, t, was 0.05 μm and the outer radius, ro, was 5 μm. The bottom layer of the cupped membrane was represented by the same geometry as the flat membrane. COMSOL required specifying a membrane thickness to solve the cupped membrane, and this small value (0.05 μm) allowed us to mimic diffusion on the membrane surface. The software employs a finite element analysis to follow the time course of diffusion (solving 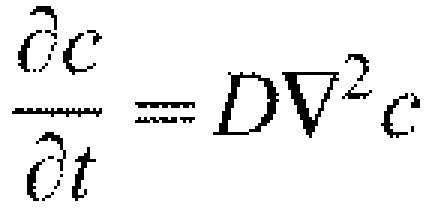 where c is concentration and D is the diffusion coefficient) and to calculate the concentration of molecules at each point within the model geometry as a function of time. The initial condition for each model posited 2000 molecules uniformly distributed within the activation spot (ra=1 μm), 1000 molecules each in the top and bottom membrane layers. To compare simulation results with the experimental data (normalized fluorescence ratio), the number of molecules within the activation spot was calculated at each time point and the computational ratio, R, was calculated as:
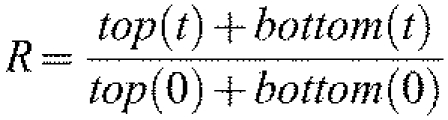 in which top(t) and bottom(t) are the number of molecules within the activation spot at time t on the top and bottom membrane layers, respectively.
Simulation results from a flat membrane were fit to experimental data and used to determine a diffusion coefficient, D, of 1.1×10⁻⁹ cm2/second. D was then used in simulations with the cupped membrane.
XYZT photoactivation experiments
Three-dimensional reconstructions of membrane dynamics (XYZT) used the same microscope and software as the XYT experiments. Image Z-stacks used a step size of 250 nm between planes. Images were collected continuously in line sequential scanning mode. Collection of each Z-stack required approximately 7 seconds. Image stacks were deconvolved using Huygens Essential software and the deconvolved stacks were visualized using the 4D viewer and linescan function in MetaMorph.
FRET microscopy
Fluorescence images were collected using a Nikon Eclipse TE-300 inverted microscope with a 60× NA 1.4, oil-immersion PlanApo objective lens (Nikon, Tokyo, Japan) and a Lambda LS xenon arc lamp for epifluorescence illumination (Sutter Instruments, Novato, CA). Fluorescence excitation and emission wavelengths were selected using a JP4v2 filter set (Chroma Technology, Rockingham, VT) and a Lambda 10-2 filter wheel controller (Shutter Instruments) equipped with a shutter for epifluorescence illumination control. Images were recorded with a Photometrics CoolSnap HQ cooled CCD camera (Roper Scientific, Tucson, AZ). Image acquisition and processing were performed using MetaMorph v6.3 (Molecular Devices, Sunnyvale, CA). Additional processing was performed using MATLAB v7.8.0 (The MathWorks, Natick, MA) and the equations of FRET stoichiometry (Hoppe et al., 2002).
FRET microscopy of macrophages expressing Cerulean–PBD and either Citrine–Rac1 or Citrine–Cdc42 was carried out as previously described (Hoppe et al., 2002; Yoshida et al., 2009). Briefly, collected images were background-subtracted and shading-corrected. Images for the apparent FRET efficiencies relative to acceptor (EA) and donor (ED) fluorescence and for the molar ratio of acceptor to donor were then calculated using published FRET stoichiometry equations (Beemiller et al., 2006; Hoppe et al., 2002). G* images were calculated as previously described, using the coefficient values obtained from cells expressing Cerulean–PBD and either Citrine–Rac1(L61) or Citrine–Cdc42(V12) (Hoppe and Swanson, 2004). G* values account for varying levels of donor and acceptor in a population of cells, and can therefore be used to accurately measure the fraction of activated GTPase in cells that express variable relative amounts of Cerulean–PBD and either Citrine–Rac1 or Citrine–Cdc42. A paired two-tailed Student's t-test was used to compare average G* values from macropinocytic cups and entire cells.
Acknowledgements
We thank Samuel Straight, Ladislau Dombrowski, Anant Balijepalli, and Isabelle Gaeta for their technical assistance.
Footnotes
Funding
The work was supported by the National Institutes of Health [grant number AI079414]. Deposited in PMC for release after 12 months.
Supplementary material available online at http://jcs.biologists.org/lookup/suppl/doi:10.1242/jcs.091538/-/DC1
References
- Araki N., Johnson M. T., Swanson J. A. (1996). A role for phosphoinositide 3-kinase in the completion of macropinocytosis and phagocytosis by macrophages. J. Cell Biol. 135, 1249-1260 [DOI] [PMC free article] [PubMed] [Google Scholar]
- Araki N., Hatae T., Furuka A., Swanson J. A. (2003). Phosphoinositide-3-kinase-independent contractile activities associated with fcgamma-receptor-mediated phagocytosis and macropinocytosis in macrophages. J. Cell Sci. 116, 247-257 [DOI] [PubMed] [Google Scholar]
- Beemiller P., Hoppe A. D., Swanson J. A. (2006). A phosphatidylinositol-3-kinase-dependent signal transition regulates ARF1 and ARF6 during Fcgamma receptor-mediated phagocytosis. PLoS Biol. 4, e162 [DOI] [PMC free article] [PubMed] [Google Scholar]
- Cox D., Chang P., Zhang Q., Reddy P. G., Bokoch G. M., Greenberg S. (1997). Requirements for both Rac1 and Cdc42 in membrane ruffling and phagocytosis in leukocytes. J. Exp. Med. 186, 1487-1494 [DOI] [PMC free article] [PubMed] [Google Scholar]
- Edwards D. C., Sanders L. C., Bokoch G. M., Gill G. N. (1999). Activation of LIM-kinase by Pak1 couples Rac/CDC42 GTPase signalling to actin cytoskeletal dynamics. Nat. Cell Biol. 1, 253-259 [DOI] [PubMed] [Google Scholar]
- Frick M., Schmidt K., Nichols B. J. (2007). Modulation of lateral diffusion in the plasma membrane by protein density. Curr. Biol. 17, 462-467 [DOI] [PubMed] [Google Scholar]
- Hoppe A. D., Swanson J. A. (2004). Cdc42, Rac1, and Rac2 display distinct patterns of activation during phagocytosis. Mol. Biol. Cell 15, 3509-3519 [DOI] [PMC free article] [PubMed] [Google Scholar]
- Hoppe A. D., Christensen K. A., Swanson J. A. (2002). Fluorescence resonance energy transfer-based stoichiometry in living cells. Biophys. J. 83, 3652-3664 [DOI] [PMC free article] [PubMed] [Google Scholar]
- Legg J. A., Bompard G., Dawson J., Morris H. L., Andrew N., Cooper L., Johnston S. A., Tramountanis G., Machesky L. M. (2007). N-WASP involvement in dorsal ruffle formation in mouse embryonic fibroblasts. Mol. Biol. Cell 18, 678-687 [DOI] [PMC free article] [PubMed] [Google Scholar]
- Li G., D'Souza-Schorey C., Barbieri M. A., Cooper J. A., Stahl P. D. (1997). Uncoupling of membrane ruffling and pinocytosis durin ras signal transduction. J. Biol. Chem. 272, 10337-10340 [PubMed] [Google Scholar]
- Liu Y., Fisher D. A., Storm D. R. (1993). Analysis of the palmitoylation and membrane targeting domain of neuromodulin (GAP-43) by site-specific mutagenesis. Biochemistry 32, 10714-10719 [DOI] [PubMed] [Google Scholar]
- Patterson G. H., Lippincott-Schwartz J. A. (2002). A photoactivatable GFP for selective photolabeling of proteins and cells. Science 297, 1873-1877 [DOI] [PubMed] [Google Scholar]
- Peterson J. R., Bickford L. C., Morgan D., Kim A. S., Ouerfelli O., Kirschner M. W., Rosen M. K. (2004). Chemical inhibition of N-WASP by stabilization of a native autoinhibited conformation. Nat. Struct. Mol. Biol. 11, 747-755 [DOI] [PubMed] [Google Scholar]
- Schmidt K., Nichols B. J. (2004). A barrier to lateral diffusion in the cleavage furrow of dividing mammalian cells. Curr. Biol. 14, 1002-1006 [DOI] [PubMed] [Google Scholar]
- Simons K., Toomre D. (2000). Lipid rafts and signal transduction. Nat. Rev. Mol. Cell. Biol. 1, 31-39 [Erratum in Nat. Rev. Mol. Cell. Biol.2, 216.] [DOI] [PubMed] [Google Scholar]
- Swanson J. A. (1989). Phorbol esters stimulate macropinocytosis and solute flow through macrophages. J. Cell Sci. 94, 135-142 [DOI] [PubMed] [Google Scholar]
- Swanson J. A. (2008). Shaping cups into phagosomes and macropinosomes. Nat. Rev. Mol. Cell. Biol. 9, 639-649 [DOI] [PMC free article] [PubMed] [Google Scholar]
- Weisswange I., Bretschneider T., Anderson K. I. (2005). The leading edge is a lipid diffusion barrier. J. Cell Sci. 118, 4375-4380 [DOI] [PubMed] [Google Scholar]
- Wells C. M., Walmsley M., Ooi S., Tybulewicz V., Ridley A. J. (2004). Rac1-deficient macrophages exhibit defects in cell spreading and membrane ruffling but not migration. J. Cell Sci. 117, 1259-1268 [DOI] [PubMed] [Google Scholar]
- Yoshida S., Hoppe A. D., Araki N., Swanson J. A. (2009). Sequential signaling in plasma-membrane domains during macropinosome formation in macrophages. J. Cell Sci. 122, 3250-3261 [DOI] [PMC free article] [PubMed] [Google Scholar]