Abstract
canSAR is a fully integrated cancer research and drug discovery resource developed to utilize the growing publicly available biological annotation, chemical screening, RNA interference screening, expression, amplification and 3D structural data. Scientists can, in a single place, rapidly identify biological annotation of a target, its structural characterization, expression levels and protein interaction data, as well as suitable cell lines for experiments, potential tool compounds and similarity to known drug targets. canSAR has, from the outset, been completely use-case driven which has dramatically influenced the design of the back-end and the functionality provided through the interfaces. The Web interface at http://cansar.icr.ac.uk provides flexible, multipoint entry into canSAR. This allows easy access to the multidisciplinary data within, including target and compound synopses, bioactivity views and expert tools for chemogenomic, expression and protein interaction network data.
INTRODUCTION
Advances in large-scale genomics technologies have transformed the drug discovery field by providing unparalleled biological and pharmacological information about potential disease causing genes. Cancer research in particular benefits from these advances as it is often caused by complex genetic events that may not become obvious without large-scale, systematic analysis of multi-genome heterogeneous data (1,2). However, scientists can rarely make use of the full breadth and depth of relevant data that are often available. The difficulty of obtaining, effectively integrating and maintaining such large sets of heterogeneous data such as genomics, cellular biology, medicinal chemistry and structural biology is the chief factor (3). Furthermore, the majority of public resources available tend to be domain specific resulting in researchers either making their decisions based on narrow or incomplete data contexts, or spending weeks at a time compiling data relating to their query from different sources. A growing number of resources exist that attempt to bring together such heterogeneous data [e.g. iHop (4) and GeneCards (5)]; however, most simply provide compilations of data through a web interface. While they can be a useful quick look-up, most of these resources do little or no actual integration of the data; instead the meta-data are provided in large dumps through a web interface and require the user to trawl through long pages of listed information. Some resources are notable for better integration and usability such as cancerResource (6), that provides excellent query and integration of gene expression data linked to biological annotation of targets and cellular chemical screening data, with powerful expression data query tools; but by design, excludes other data sources that may well be relevant in broader cancer translational research. Moreover, chemical activity data and search capabilities are limited, as are query mechanisms. On the other hand, the ChEMBL database (7), which is a large curated and linked database of bioactive compounds, their biological targets and pharmacological data, across multidisciplines, has powerful chemical search and clustering tools and extensive bioactivity data, but is not designed to be cancer specific and thus does not include extensive, biological data relevant to oncology such as cancer gene expression and amplification data.
What was required is a resource that integrates data at a very large scale, which captures cancer-relevant biological data such as expression, amplification, RNAi etc, together with large protein–protein interaction data, chemical screening and pharmacological activities and 3D structures. Furthermore, to maximize benefits from integration of these vast heterogeneous data sets, the user needs to be presented with meta-data that is logically organized and linked in a way that mimics real life uses and workflows. For example, it would be extremely valuable to enable obtaining integrated information about expression, mutation and functional annotation for a target together with its druggability, identify suitable cellular models for drug testing, identify chemical tool compounds and understand the wider context of the likely action of these compounds on the target's pathway neighbours, all within one place, and without extensive expertise in computational techniques, medicinal chemistry and genomics.
Such integration requires smart underlying technical data modelling, data cross-referencing and redundancy elimination, as well as regular and reliable update processes. canSAR addresses these needs by integrating data from a plethora of domains and providing a use-case driven web-based interface to help answer translational research questions.
Database design and processing pipeline
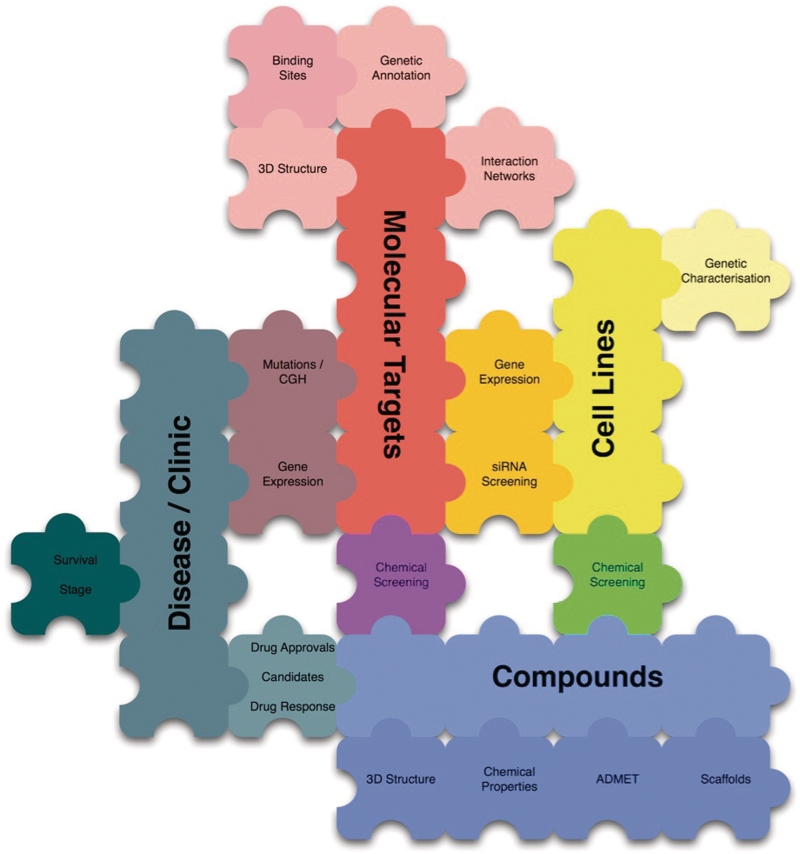
The design and implementation of canSAR has been entirely use-case driven. canSAR was designed in a modular manner such that the modelling and inclusion of new data types in the future [e.g. clinical outcome or drug metabolism and pharmacokinetics (DMPK) data] is relatively easy. This provides the ability and support to expand the functionality and usefulness of canSAR as new requirements are found. The data model is designed around elemental and association data types. Elemental types (e.g. molecular target, compound, cell) represent the core components of the system. These elements can then be associated via different association types, e.g. a compound and a molecular target can be associated via a ‘screening’ association, a ‘drug action’ association, or a ‘3D-structural complex’ association. The associations in turn are then linked to the experimental data, sources of origin and publication references where relevant. These generic key data types provide the flexibility described above. Figure 1 shows an illustration of this modular design with the core elemental data types represented as large jigsaw pieces and the association data as the interconnecting pieces. Using this paradigm, new associations between any of the key data types can be provided for easily.
Figure 1.
Modular design of canSAR: large pieces represent elemental types, small pieces represent associations. This design allows new elemental data types to be added and new interconnecting (association) data to be introduced.
Data sources from collaborators are mirrored to ensure that canSAR is up-to-date. In order to process these external sources into a format suitable for integration into canSAR, a suite of pipelines have been created which allows the seamless integration of new data from existing sources, and most importantly, check for uniqueness among the different data sources. A fraction of the data within canSAR is duplicated in several data sources and it is imperative that this redundancy is recorded and that the useful information for each duplicate is extracted. In some cases, this is reasonably trivial, but in others (compounds and molecular targets are good example), accurate and appropriate tests for uniqueness and data storage are challenging. Most of the data pipelines involved the following steps: acquisitions of local copy, pre-processing into suitable format, uniqueness testing of existing data, loading of data into canSAR and rebuilding of data source logs. Some of the data sources are updated monthly, however some are updated more frequently or at variable intervals. Each of the specific pipelines is adapted to suit the needs of the specific data source. Where possible and appropriate, a source's API is utilized through the use of simple REST or SOAP services. This has the benefit of ensuring that the data are as up-to-date as possible and removes steps of mirroring and integrating.
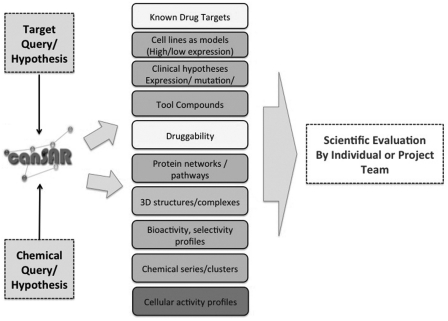
To ensure long-term growth and utility, canSAR provides flexibility for new data and data types. Providing the centralization and ability to rapidly interrogate such disparate data is of immediate benefit to users who can now access data in seconds that would have taken days or weeks to compile. Figure 2 illustrates some common information requests taken into consideration in the design of canSAR.
Figure 2.
Common requested information in cancer translational research used to design the user interface. Query can be from a biological or chemical starting point. Users often require complex, interconnected but concise information. The data reports generated in canSAR are used to underpin subsequent discussions and the design of the next experiment.
Data content
canSAR contains data pertaining to the entire human proteome as represented by UniProt (8) human sequences and RefSeq (9) human transcriptome. Additionally, a large number of model organism proteins are included where useful data are available for them. Family annotation from Pfam (10) or manual curation by the canSAR team is provided. Predicted secretion signals, transmembrane regions and secondary structures are calculated using standard methods [SignalP (11), TMHMM (12) and PSIPRED (13)].
Currently, canSAR contains data from four publicly available chemical screening data sources. The most expansive is ChEMBL, which contains 5.4 million activities from 42 500 different publications (correct as of August 2011) and is updated approximately once a month. The next largest data set is the NCI-60 panel of 60 diverse human cancer cell lines screened against more than 100 000 compounds and natural products (14). This currently supplies canSAR with 2 663 013 activities. Other sources include Binding DB (15) (620 198 activities) and the Genomics of Drug Sensitivity project (8498 activities).
Compound structures obtained from the resources mentioned above, or manually entered by the canSAR team (e.g. some clinical candidates), are all assessed, standardized and registered against a strict pipeline that handles chemical duplicates, identifies alternative salt forms and stereoisomers. The compounds are stored in the database using the Accelrys Direct chemical cartridge for Oracle to allow compound searching. A large set of descriptors is calculated for each of the compounds including molecular weight, polar surface area, number of hydrogen-bond donors and acceptors and whether they contain toxicophores or reactive groups (16). To enable clustering of compounds into chemically related groups, the Bemis and Murcko (17) frameworks are calculated for all compounds.
Publicly available gene expression data are currently obtained from NCI-60 DTP Human Tumour Cell Line Screen (18), The Cancer Genome Atlas (TCGA) and ArrayExpress (19). While the NCI-60 and TCGA data has been processed and integrated into canSAR the ArrayExpress data are obtained live via web services. Further annotation for cell lines and gene expression microarray probes is obtained and integrated from COSMIC (20), ATCC and specific platform providers (Affymetrix and Agilent).
Large volume data repositories for RNAi data are not commonplace; hence, most of the RNAi data in canSAR are extracted manually from choice publications and web resources [e.g. (1,21,22,23)]. Increasingly, data is provided through sources such as the Broad Institute (http://www.broadinstitute.org//scientific-community/data) and such data will be added in the future from as many sources and collaborators as possible in order to bolster the confidence in any findings.
Gene copy number data have been obtained and integrated from the copy number variation (CNV) Project (24,25). Currently, this makes up 1.4 billion copy number data points for 747 cell lines.
canSAR is useful because it brings together in one place all these diverse data. It is important at this point to remind readers that these data, as with any published data, are useful for hypothesis generation-specific measurements and endpoints need to be verified experimentally.
To tackle the large variety of sources of protein interaction data, we began by collaborating with two providers of compiled curated interaction data, namely STRING (26) and ROCK (27). Their APIs are utilized to obtain data while maintaining the benefit of the efforts invested by these providers in annotation and confidence curation. Future plans for canSAR include better utilization of PSICQUIC (28) and more extensive collaboration with resources such as IntAct (29) and Reactome (30). These data sources are all valuable sources of annotated protein–protein interactions. They have different strengths and focuses, e.g. STRING has a visually striking structural annotation paradigm, and IntAct and ROCK have extensive links for each node through their tabular representations or though invoking options within Cytoscape. For detailed network analysis, such resources are very powerful. However, there is additionally a need to instantly annotate an interaction network by druggability, chemical screening, RNAi screening as well as structural annotation to highlight possible intervention points instantly. We aim to achieve this within canSAR (see case studies below)
The primary source for canSAR structural data is the RCSB PDB (31). Data from PDBe (32) helps maintain an up-to-date mapping between various databases such as UniProt (8), Pfam(10) protein family repository, SCOP structure classification database (33) and provides information in computationally parseable files. Ligand information is also gathered from PDBe in the form of PDBeChem. Domain specific information is gathered from SCOP and Astral (34). A number of structural descriptors are calculated for all structures using DSSP (35), Ligplot (36) and HBPlus (37), providing assignment of secondary structures, dihedral angles and interaction maps.
The approved drugs from the FDA are captured (regardless of therapeutic indication) and their efficacy targets were expert-curated from published literature (38). As well as providing this useful annotation, it is possible to infer druggability by precedence through the presentation of the sequence similarity to the existing targets of launched therapeutics (39). A continuing effort is being carried out by the canSAR team to manually curate cancer clinical candidates from clinical trial and company progress reports.
Full up-to-date release notes are available on the canSAR interface. A snap shot of the release notes from August 2011 can be found in the Supplementary Data.
Web visualization
While canSAR integrates an unprecedented set of translational research data, its major unique advantage is the presentation and interrogation tools. canSAR is available via http://cansar.icr.ac.uk. Users can obtain logical and concise summaries of broad state-of-the-art knowledge without being overwhelmed by pages of concatenated data. The interface provides biological annotation, gene expression, disease association, structural and pharmacological data, and produces graphical and tabular summary reports pertaining to any aspect of these data. Additionally, wider ranging and more expert-style questions can be asked of the data using the expert and batch query tools. The interface development is driven by typical use-cases in cancer translational research, drug discovery and chemical biology and caters for users from different backgrounds (biology, chemistry, clinical etc).
Example entry points include target/cell line/compound keyword searches, sequence similarity searches, compound structure searches and the facility to upload lists of identifiers as a query. Expert tools allow retrieval of extensive chemogenomic annotations, polypharmacology maps, compound selectivity and bioactivity profiles, expression details and pathway enrichment analysis.
Almost all canSAR functionality is available without the need for registration. However, a simple user registration facility is available to enable running large batch searches (emails are sent when batch analysis is ready to view), saving favourite complex searches, data alerts or setting up regularly used filters etc.
Data export and sharing
Users often wish to export specific analysis results obtained from the interface. In most sections of canSAR, users are able to export the current results in various formats including Excel, tab-delimited text, SDF and MIABE (40) compliant XML. Detailed examples of the web interfaces usage can be found in the Case Studies section.
Database and web implementation
canSAR is running on an Apache web server implemented in PHP, Javascript, Perl and Java. The data reside in an Oracle 11g database. Chemical compound search and handling is supported by the Accelrys direct cartridge. The data processing pipelines are written in Perl, Python and Java and utilize Openbabel, CDK (41) and Pipeline Pilot (Accelrys Inc).
CASE STUDIES USING CANSAR
canSAR has been well documented with quick start guides and detailed case studies. Below are some example use cases addressing the major functionality.
Obtain state of knowledge about a target
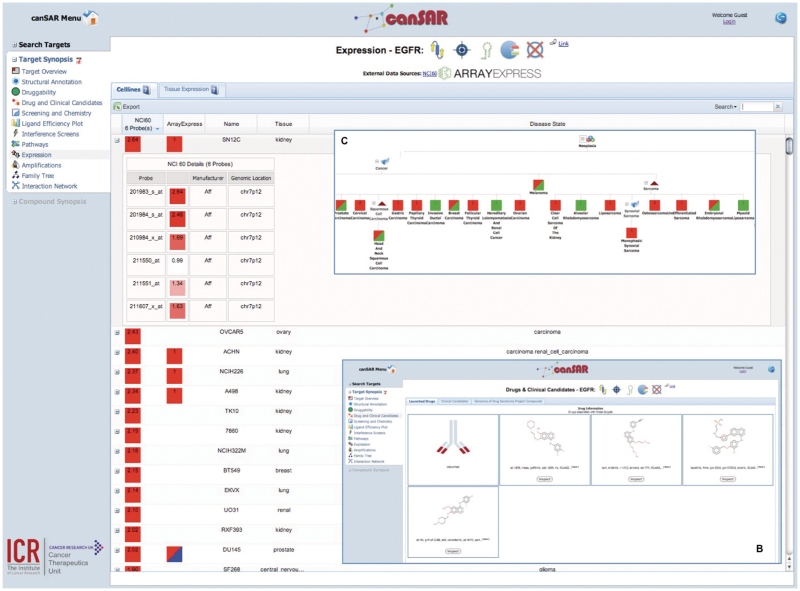
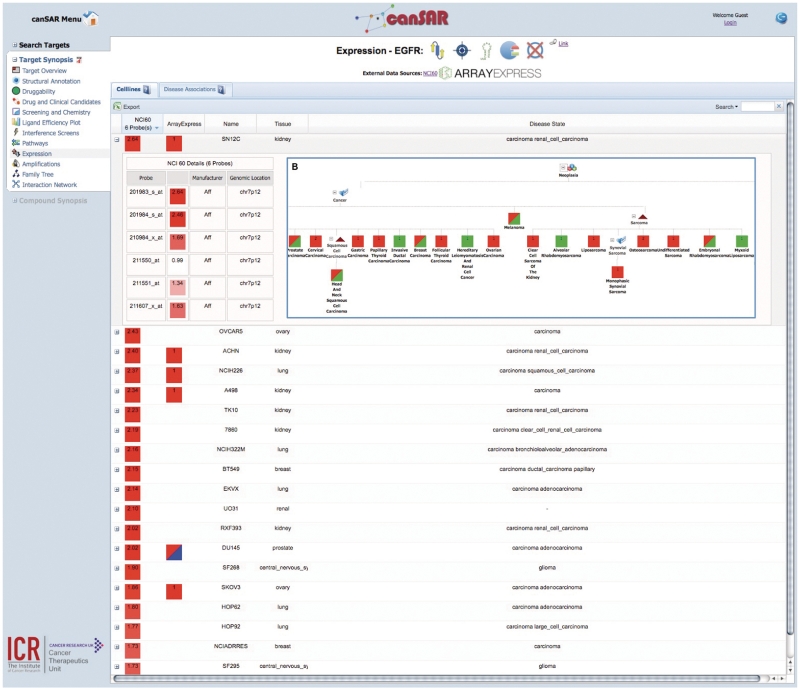
canSAR provides target synopses, which present categorized summaries of the knowledge that is available for each target. This synopsis is usually the first point of access for a user with a given target in mind. These summaries are divided into structural annotation, drug and clinical candidates, structural and ligand-based druggability, screening and chemistry, RNAi studies, pathway, cell line and tissue expression, amplification and interaction networks. Figure 3A shows a target synopsis with the gene expression section selected and known drugs (Figure 3B). Figure 3C shows a hierarchical disease tree with expression annotations obtained through ArrayExpress. A user can navigate to other areas of canSAR from many of the sections within the synopsis. Target synopsis can be accessed from any target search results page.
Figure 3.
View of some components of target synopsis for Epithelial Growth Factor Receptor (EGFR). The main panel (A) shows gene expression ordered by the highest expressed probeset from the NCI60 cell line panel expression data. The details of all available probesets can be seen in the expander. At the top of the main panel is the target synopsis banner, which is made up of icons that indicate certain properties. From the left, these properties are: structure availability, drug target status, RNAi data availability, enzyme status and mutation data availability. Approved drugs are shown in (B). If the drug is an antibody, then a generic antibody icon is displayed. If the drug is a small molecule then a link to the compound synopsis is provided. Panel (C) shows tissue sample expression data from ArrayExpress hierarchically classified into cancer types.
Identifying potential tool compounds for a target of interest
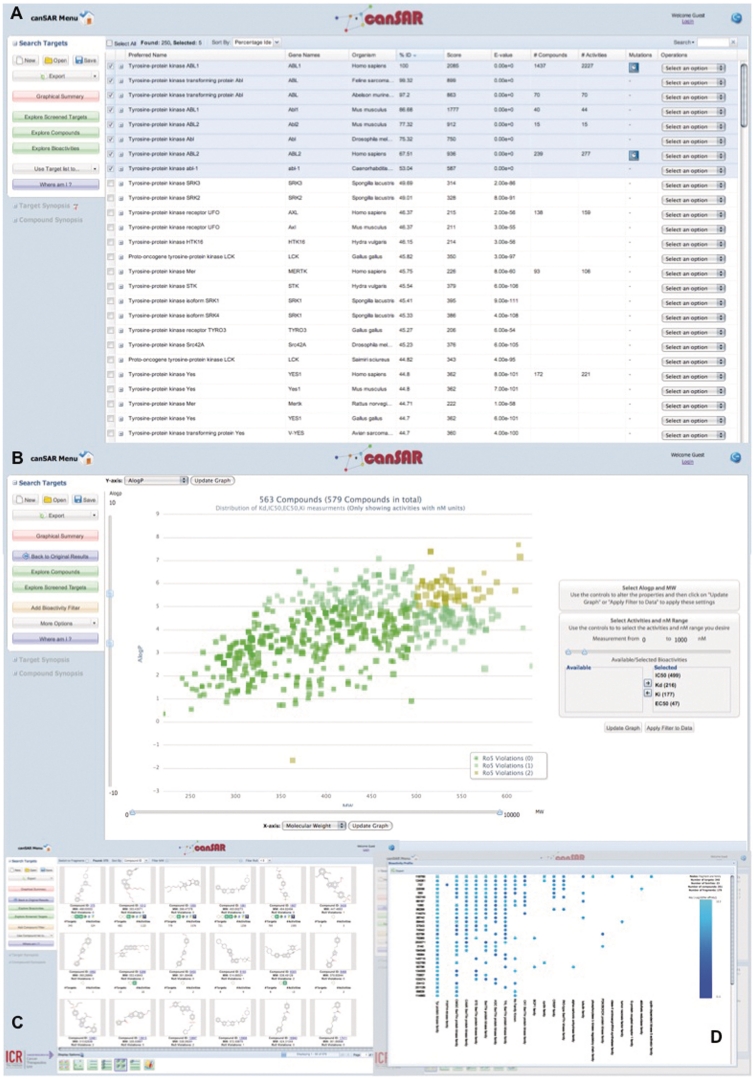
If a target has—itself—been chemically screened, the bioactive compounds are summarized and can be obtained via the target synopsis described above. However, if a target is not itself screened, or if a wider selection of compounds is required, likely active compounds can be obtained via homology searches. Figure 4A shows the results of a sequence similarity search resulting in a number of homologous targets with screening data. The bioactivity data are filtered to obtain the most active compounds (Figure 4B) and the resulting compounds can be viewed and exported (Figure 4C). In the selection of a tool compound, as well as level of activity, molecular diversity and likely cross-reactivity are taken into account. Molecular diversity can be obtained from the Bemis and Murcko frameworks, and cross reactivity can be visualized using the compound bioactivity profile plots (Figure 4D)
Figure 4.
Identification of tool compounds for ABL1. Panel (A) shows the search results from a sequence similarity search of ABL1. Only homologues with percentage identities >50% are selected to increase the chance of finding an active against ABL1 itself. Panel (B) shows the chemical space of good affinity compounds against ABL1 and selected homologues. Panel (C) displays only sub micromolar affinity compound structures. A search instigated using these compounds allows identification of likely selectivity across homologues. Panel (D) shows the bioactivity profile of these compounds. Compound identifiers are on the y-axis and target names on the x-axis. A blue dot represents a measured compound bioactivity and the darker the dot the higher the affinity of the compound against the target. This profile can be used to indicate the selectivity of the compounds against measured targets.
Identifying potential druggable intervention points from a protein interaction network annotated with chemical and biological data
A common problem encountered in drug discovery is identifying likely chemical intervention points in a pathway or interaction network of biological relevance. canSAR provides chemical and biological annotation of protein interaction networks, allowing rapid identification of highly characterized or druggable points on the network (Figure 5). This is achieved by mapping a summary of the annotation within canSAR onto each node in the network, thus highlighting druggable and chemically and genetically screened targets. Moreover, through the integration in canSAR, the user can instantly access chemical screening data, launched drugs, structural annotation and other features of the protein at the click of a button directly from the interaction network. A further utility for this feature is the ability to identify alternative intervention points for an undruggable target. This annotated network can be obtained via a target synopsis, or through a batch search in the chemogenomic annotation tool. Using this network, a user is able to identify whether any closely interacting proteins are predicted as druggable by both structural and ligand-based techniques. Users are able to expand and remove individual nodes to manipulate the network, and then inspect all chemical and screening data for the entire network.
Figure 5.
A screenshot of an annotated interaction network for ABL1. Each node is a protein coloured by the presence/absence of certain types of data. Each protein is annotated with chemical and biological information as indicated by the activation of the traffic lights. From the left, these traffic lights are green if the following data is positively available: chemical screening data (informs user of previous screening efforts against target), good affinity chemical screening data (tool compounds available), drug target status (green of target is the target of an approved pharmaceutical), enzyme status (green if the protein is an enzyme, as enzymes form ∼50% of successful drug targets (38) and enzymatic activity is useful for assay development during target validation), structural characterization, RNAi data and structure-based and ligand-based druggability. The colour of the node is then determined from the number of different annotation types available.
Identify published 3D binding modes for a compound
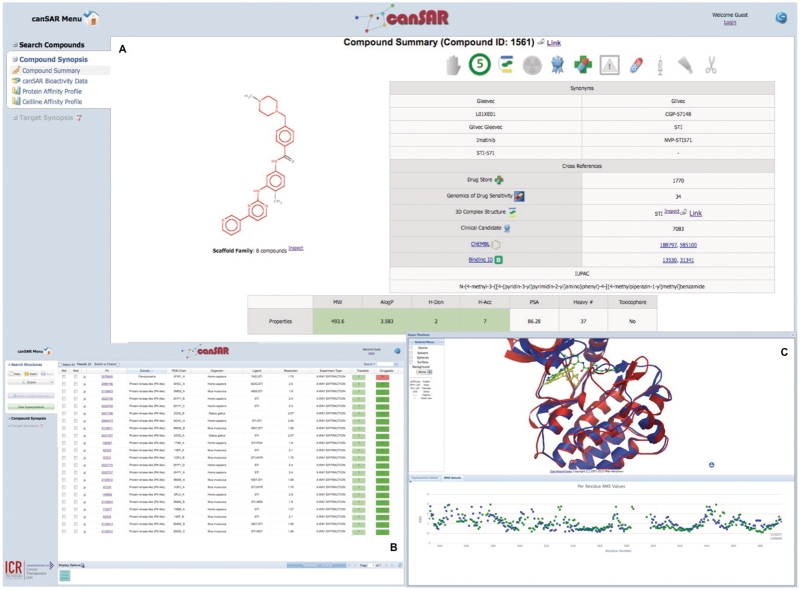
Compounds in canSAR can be retrieved by performing keyword or chemical structure searches; alternatively they can be obtained via their activity through a biological search. Understanding likely binding modes for a compound, and whether there is evidence for them, is an important part of understanding mechanisms of compound effects and is very valuable in lead optimization. In this example, the drug imatinib is identified through a chemical search. Imatinib is known to bind to ABL1, but has subsequently been found to bind to a wider range of kinases. Bioactivities of imatinib against molecular targets or cell lines, together with any ADMET (Absorption, Distribution, Metabolism, Excretion and Toxicity) data available are summarized in the Compound Synopsis (Figure 6A). This page also allows obtaining these bioactivity data for a compound's (in this case, imatinib) analogues. If a compound has been solved in complex in one or more 3D structures, a link from this page leads to the list of all 3D structures containing this compound. This allows identification of valuable 3D data for the compound in any system in which it has been characterized, regardless of protein family or organism, as shown here for imatinib. Furthermore, the effective integration of structure comparison and ligand interaction maps allows comparison of binding modes for the compound. In this case, the structure of imatinib has been solved in complex with a wide variety of protein kinases (Figure 6B). Selecting any set of structures allows viewing structural superposition. Here, the structure of imatinib in complex with ABL1 and with Spleen Tyrosine Kinase (SYK) (42) are compared (Figure 6C). The superposition shows the alternative binding modes that imatinib adopts within the two kinases. Users can access a graph showing the RMS over the whole sequence and interact with this graph to highlight the areas of the superposition that have the most mobility.
Figure 6.
Use case for imatinib. The main panel (A) shows the compound synopsis for imatinib. The structure is shown with the murko scaffold highlighted in red. The banner at the top highlights certain properties indicated by icons which are active/inactive. From the left, the icons are active if the following properties are positive: is chiral, is rule-of five compliant, is solved in complex in a 3D structure, contains a toxicophore, is a clinical candidate, is a marketed drug, has a black-box warning, is oral, is injected, is topical and is a prodrug. Panel (B) displays the 3D structures solved in complex with Imatinib. Panel (C) shows the superposition of a SYK structure with an ABL1 structure. In green is the well-known DFG-out binding mode. In yellow is the alternative mode adopted in SYK when imatinib changes conformation and binds in a canonical, directly ATP competitive mode.
Additional example batch mode use cases are described in the Supplementary Data.
CONCLUSIONS
Here, we have presented the canSAR database and web interface for the integration of heterogeneous data for cancer translational research and drug discovery and the provision of these data through a flexible user interface. canSAR's aim is to aid informed hypothesis generation and cancer translational research by a more comprehensive, yet concise, view of relevant data, and enabling powerful interrogation and reporting tools. canSAR contains large amounts of data from a variety of sources including chemical screening, gene expression, RNA interference, genomic variation, protein–protein interaction and 3D structural data. A user-driven web interface has been designed and implemented to provide tailored entry methods, and allow logical exploration and interrogation of data within canSAR. The interface allows users to obtain answers to common cancer research questions, such as rapidly obtaining biological and chemical annotation together with druggability considerations, explore genomic variation and gene-expression data, identify relevant cell lines for experiments, and tool compounds for analysis. Throughout the various levels of the interface, data can be exported in a variety of manners including Excel, SDF and MIABE XML. Also, if registered, user specific work spaces are available which save searches, filters and allow larger batch queries to be run.
Over the next year, canSAR will be expanded to contain a much larger body of biological data particularly gene expression and RNAi screening data and expanded annotation of clinical samples and cell lines. Additionally, in collaboration with protein–protein interaction data providers listed above, we aim to integrate directionality data into the network diagrams wherever possible.
Integrating masses of publicly available information in a consistent and up-to-date manner, canSAR is the largest integrated cancer research and drug discovery resource freely available. The efforts that an individual researcher would have to undertake to collect and process similar amounts of data sources for information on a given target, cell line or compound of interest cannot be overstated. canSAR removes this arduous and time-consuming step of data collection and processing and provides an intuitive centralized repository of data, allowing researchers to focus more quickly on specific areas of interest, or to eliminate potentially time consuming leads early on. Using canSAR, these types of decisions can be better informed and can be made after having taken the whole background of a target into account.
SUPPLEMENTARY DATA
Supplementary Data are available at NAR Online: Supplementary Figures 1 and 2.
FUNDING
Cancer Research UK core drug discovery grant to the ICR [C309/A8274]. NHS funding to the NIHR Biomedical Research Centre. Funding for open access charge: Cancer Research UK grant to the ICR [C309/A8274].
Conflict of interest statement. None declared.
ACKNOWLEDGEMENTS
The authors acknowledge data providers (ChEMBL, BindingDB, ArrayExpress, Genomics of Drug Sensitivity, Pathway Commons, STRING, ROCK and COSMIC). The authors also thank the users at the Cancer Therapeutics division, Institute of Cancer Research, who have provided ideas and feedback.
REFERENCES
- 1.Schlabach M, Luo J, Solimini N, Hu G, Xu Q, Li M, Zhao Z, Smogorzewska A, Sowa M, Ang X, et al. Cancer proliferation gene discovery through functional genomics. Science. 2008;319:620–624. doi: 10.1126/science.1149200. [DOI] [PMC free article] [PubMed] [Google Scholar]
- 2.Zheng-Bradley X, Rung J, Parkinson H, Brazma A. Large scale comparison of global gene expression patterns in human and mouse. Genome Biol. 2010;11:R124. doi: 10.1186/gb-2010-11-12-r124. [DOI] [PMC free article] [PubMed] [Google Scholar]
- 3.Palsson B, Zengler K. The challenges of integrating multi-omic data sets. Nat. Chem. Biol. 2010;6:787–789. doi: 10.1038/nchembio.462. [DOI] [PubMed] [Google Scholar]
- 4.Hoffmann R, Valencia A. A gene network for navigating the literature. Nat. Genet. 2004;36:664–664. doi: 10.1038/ng0704-664. [DOI] [PubMed] [Google Scholar]
- 5.Safran M, Dalah I, Alexander J, Rosen N, Iny Stein T, Shmoish M, Nativ N, Bahir I, Doniger T, Krug H, et al. GeneCards Version 3: the human gene integrator. Database. 2010;2010 doi: 10.1093/database/baq020. doi:10.1093/database/baq020. [DOI] [PMC free article] [PubMed] [Google Scholar]
- 6.Ahmed J, Meinel T, Dunkel M, Murgueitio MS, Adams R, Blasse C, Eckert A, Preissner S, Preissner R. CancerResource: a comprehensive database of cancer-relevant proteins and compound interactions supported by experimental knowledge. Nucleic Acids Res. 2010;39:D960–D967. doi: 10.1093/nar/gkq910. [DOI] [PMC free article] [PubMed] [Google Scholar]
- 7.Gaulton A, Bellis LJ, Bento AP, Chambers J, Davies M, Hersey A, Light Y, McGlinchey S, Michalovich D, Al-Lazikani B, et al. ChEMBL: a large-scale bioactivity database for drug discovery. Nucleic Acids Res. 2012;40:D1100–D1107. doi: 10.1093/nar/gkr777. [DOI] [PMC free article] [PubMed] [Google Scholar]
- 8.The UniProt C. The Universal Protein Resource (UniProt) in 2010. Nucleic Acids Res. 2010;38:D142–D148. doi: 10.1093/nar/gkp846. [DOI] [PMC free article] [PubMed] [Google Scholar]
- 9.Pruitt KD, Tatusova T, Klimke W, Maglott DR. NCBI reference sequences: current status, policy and new initiatives. Nucleic Acids Res. 2009;37:D32–D36. doi: 10.1093/nar/gkn721. [DOI] [PMC free article] [PubMed] [Google Scholar]
- 10.Finn RD, Mistry J, Tate J, Coggill P, Heger A, Pollington JE, Gavin OL, Gunasekaran P, Ceric G, Forslund K, et al. The Pfam protein families database. Nucleic Acids Res. 2010;38:D211–D222. doi: 10.1093/nar/gkp985. [DOI] [PMC free article] [PubMed] [Google Scholar]
- 11.Bendtsen JD, Nielsen H, von Heijne G, Brunak Sr. Improved Prediction of Signal Peptides: SignalP 3.0. J. Mol. Biol. 2004;340:783–795. doi: 10.1016/j.jmb.2004.05.028. [DOI] [PubMed] [Google Scholar]
- 12.Krogh A, Larsson B, von Heijne G, Sonnhammer ELL. Predicting transmembrane protein topology with a hidden markov model: application to complete genomes. J. Mol. Biol. 2001;305:567–580. doi: 10.1006/jmbi.2000.4315. [DOI] [PubMed] [Google Scholar]
- 13.McGuffin LJ, Bryson K, Jones DT. The PSIPRED protein structure prediction server. Bioinformatics. 2000;16:404–405. doi: 10.1093/bioinformatics/16.4.404. [DOI] [PubMed] [Google Scholar]
- 14.Shoemaker RH. The NCI60 human tumour cell line anticancer drug screen. Nat. Rev. Cancer. 2006;6:813–823. doi: 10.1038/nrc1951. [DOI] [PubMed] [Google Scholar]
- 15.Liu T, Lin Y, Wen X, Jorissen RN, Gilson MK. BindingDB: a web-accessible database of experimentally determined protein–ligand binding affinities. Nucleic Acids Res. 2007;35:D198–D201. doi: 10.1093/nar/gkl999. [DOI] [PMC free article] [PubMed] [Google Scholar]
- 16.Blagg J, Abraham DJ. Burger's Medicinal Chemistry and Drug Discovery and Development. New York: John Wiley & Sons, Inc; 2003. Structural Alerts for Toxicity; pp. 1–34. [Google Scholar]
- 17.Bemis GW, Murcko MA. The properties of known drugs. 1. molecular frameworks. J. Med. Chem. 1996;39:2887–2893. doi: 10.1021/jm9602928. [DOI] [PubMed] [Google Scholar]
- 18.Scherf U, Ross DT, Waltham M, Smith LH, Lee JK, Tanabe L, Kohn KW, Reinhold WC, Myers TG, Andrews DT, et al. A gene expression database for the molecular pharmacology of cancer. Nat. Genet. 2000;24:236–244. doi: 10.1038/73439. [DOI] [PubMed] [Google Scholar]
- 19.Parkinson H, Sarkans U, Kolesnikov N, Abeygunawardena N, Burdett T, Dylag M, Emam I, Farne A, Hastings E, Holloway E, et al. ArrayExpress update—an archive of microarray and high-throughput sequencing-based functional genomics experiments. Nucleic Acids Res. 2011;39:D1002–D1004. doi: 10.1093/nar/gkq1040. [DOI] [PMC free article] [PubMed] [Google Scholar]
- 20.Forbes Simon A, Nidhi B, Sally B, Charlotte C, Chai Yin K, David B, Mingming J, Rebecca S, Kenric L, Andrew M, et al. COSMIC: mining complete cancer genomes in the Catalogue of Somatic Mutations in Cancer. Nucleic Acids Res. 2011;39:D945–D950. doi: 10.1093/nar/gkq929. [DOI] [PMC free article] [PubMed] [Google Scholar]
- 21.Ebert BL, Lee MM, Pretz JL, Subramanian A, Mak R, Golub TR, Sieff CA. An RNA interference model of RPS19 deficiency in Diamond-Blackfan anemia recapitulates defective hematopoiesis and rescue by dexamethasone: identification of dexamethasone-responsive genes by microarray. Blood. 2005;105:4620–4626. doi: 10.1182/blood-2004-08-3313. [DOI] [PMC free article] [PubMed] [Google Scholar]
- 22.Barbie DA, Tamayo P, Boehm JS, Kim SY, Moody SE, Dunn IF, Schinzel AC, Sandy P, Meylan E, Scholl C, et al. Systematic RNA interference reveals that oncogenic KRAS-driven cancers require TBK1. Nature. 2009;462:108–112. doi: 10.1038/nature08460. [DOI] [PMC free article] [PubMed] [Google Scholar]
- 23.Luo J, Emanuele M, Li D, Creighton C, Schlabach M, Westbrook T, Wong K-K, Elledge S. A genome-wide RNAi screen identifies multiple synthetic lethal interactions with the Ras. Oncogene. 2009;137:835–848. doi: 10.1016/j.cell.2009.05.006. [DOI] [PMC free article] [PubMed] [Google Scholar]
- 24.Fiegler H, Redon R, Andrews D, Scott C, Andrews R, Carder C, Clark R, Dovey O, Ellis P, Feuk L, et al. Accurate and reliable high-throughput detection of copy number variation in the human genome. Genome Res. 2006;16:1566–1574. doi: 10.1101/gr.5630906. [DOI] [PMC free article] [PubMed] [Google Scholar]
- 25.Redon R, Ishikawa S, Fitch KR, Feuk L, Perry GH, Andrews TD, Fiegler H, Shapero MH, Carson AR, Chen W, et al. Global variation in copy number in the human genome. Nature. 2006;444:444–454. doi: 10.1038/nature05329. [DOI] [PMC free article] [PubMed] [Google Scholar]
- 26.Jensen LJ, Kuhn M, Stark M, Chaffron S, Creevey C, Muller J, Doerks T, Julien P, Roth A, Simonovic M, et al. STRING 8—a global view on proteins and their functional interactions in 630 organisms. Nucleic Acids Res. 2009;37:D412–D416. doi: 10.1093/nar/gkn760. [DOI] [PMC free article] [PubMed] [Google Scholar]
- 27.Sims D, Bursteinas B, Gao Q, Jain E, MacKay A, Mitsopoulos C, Zvelebil M. ROCK: a breast cancer functional genomics resource. Breast Cancer Rese. Treatment. 2010;124:567–572. doi: 10.1007/s10549-010-0945-5. [DOI] [PubMed] [Google Scholar]
- 28.Aranda B, Blankenburg H, Kerrien S, Brinkman FSL, Ceol A, Chautard E, Dana JM, De Las Rivas J, Dumousseau M, Galeota E, et al. PSICQUIC and PSISCORE: accessing and scoring molecular interactions. Nat. Meth. 8:528–529. doi: 10.1038/nmeth.1637. [DOI] [PMC free article] [PubMed] [Google Scholar]
- 29.Aranda B, Achuthan P, Alam-Faruque Y, Armean I, Bridge A, Derow C, Feuermann M, Ghanbarian AT, Kerrien S, Khadake J, et al. The IntAct molecular interaction database in 2010. Nucleic Acids Res. 2010;38:D525–D531. doi: 10.1093/nar/gkp878. [DOI] [PMC free article] [PubMed] [Google Scholar]
- 30.Haw R, Hermjakob H, D'Eustachio P. and Stein, L. (2011) Reactome pathway analysis to enrich biological discovery in proteomics datasets. PROTEOMICS. doi: 10.1002/pmic.201100066. n/a-n/a, 11, 3598–3613. [DOI] [PMC free article] [PubMed] [Google Scholar]
- 31.Berman HM, Westbrook J, Feng Z, Gilliland G, Bhat TN, Weissig H, Shindyalov IN, Bourne PE. The protein data bank. Nucleic Acids Res. 2000;28:235–242. doi: 10.1093/nar/28.1.235. [DOI] [PMC free article] [PubMed] [Google Scholar]
- 32.Velankar S, Alhroub Y, Alili Al, Best C, Boutselakis HC, Caboche Sgn, Conroy MJ, Dana JM, van Ginkel G, Golovin A, et al. PDBe: protein data bank in Europe. Nucleic Acids Res. 2011;39:D402–D410. doi: 10.1093/nar/gkq985. [DOI] [PMC free article] [PubMed] [Google Scholar]
- 33.Andreeva A, Howorth D, Chandonia J-M, Brenner SE, Hubbard TJP, Chothia C, Murzin AG. Data growth and its impact on the SCOP database: new developments. Nucleic Acids Res. 2008;36:D419–D425. doi: 10.1093/nar/gkm993. [DOI] [PMC free article] [PubMed] [Google Scholar]
- 34.Chandonia JÄ, Hon G, Walker NS, Lo Conte L, Koehl P, Levitt M, Brenner SE. The ASTRAL compendium in 2004. Nucleic Acids Res. 2004;32:D189–D192. doi: 10.1093/nar/gkh034. [DOI] [PMC free article] [PubMed] [Google Scholar]
- 35.Kabsch W, Sander C. Dictionary of protein secondary structure: pattern recognition of hydrogen-bonded and geometrical features. Biopolymers. 1983;22:2577–2637. doi: 10.1002/bip.360221211. [DOI] [PubMed] [Google Scholar]
- 36.Wallace AC, Laskowski RA, Thornton JM. LIGPLOT: a program to generate schematic diagrams of protein-ligand interactions. Protein Engineering. 1995;8:127–134. doi: 10.1093/protein/8.2.127. [DOI] [PubMed] [Google Scholar]
- 37.McDonald IK, Thornton JM. Satisfying hydrogen bonding potential in proteins. J. Mol. Biol. 1994;238:777–793. doi: 10.1006/jmbi.1994.1334. [DOI] [PubMed] [Google Scholar]
- 38.Overington JP, Al-Lazikani B, Hopkins AL. How many drug targets are there? Nat. Rev. Drug Discov. 2006;5:993–996. doi: 10.1038/nrd2199. [DOI] [PubMed] [Google Scholar]
- 39.Hopkins AL, Groom CR. The druggable genome. Nat. Rev. Drug Discov. 2002;1:727–730. doi: 10.1038/nrd892. [DOI] [PubMed] [Google Scholar]
- 40.Orchard S, Al-Lazikani B, Bryant S, Clark D, Calder E, Dix I, Engkvist O, Forster M, Gaulton A, Gilson M, et al. Minimum information about a bioactive entity (MIABE) Nature Biotech. 2011;10:661–669. doi: 10.1038/nrd3503. [DOI] [PubMed] [Google Scholar]
- 41.Steinbeck C, Han Y, Kuhn S, Horlacher O, Luttmann E, Willighagen E. The Chemistry Development Kit (CDK): an open-source java library for chemo- and bioinformatics. J. Chem. Informat. Comput. Sci. 2003;43:493–500. doi: 10.1021/ci025584y. [DOI] [PMC free article] [PubMed] [Google Scholar]
- 42.Atwell S, Adams JM, Badger J, Buchanan MD, Feil IK, Froning KJ, Gao X, Hendle Jr, Keegan K, Leon BC, et al. A novel mode of gleevec binding is revealed by the structure of spleen tyrosine kinase. J. Biol Chem. 2004;279:55827–55832. doi: 10.1074/jbc.M409792200. [DOI] [PubMed] [Google Scholar]


