


Abstract
HmtDB (http://www.hmtdb.uniba.it:8080/hmdb) is a open resource created to support population genetics and mitochondrial disease studies. The database hosts human mitochondrial genome sequences annotated with population and variability data, the latter being estimated through the application of the SiteVar software based on site-specific nucleotide and amino acid variability calculations. The annotations are manually curated thus adding value to the quality of the information provided to the end-user. Classifier tools implemented in HmtDB allow the prediction of the haplogroup for any human mitochondrial genome currently stored in HmtDB or externally submitted de novo by an end-user. Haplogroup definition is based on the Phylotree system. End-users accessing HmtDB are hence allowed to (i) browse the database through the use of a multi-criterion ‘query’ system; (ii) analyze their own human mitochondrial sequences via the ‘classify’ tool (for complete genomes) or by downloading the ‘fragment-classifier’ tool (for partial sequences); (iii) download multi-alignments with reference genomes as well as variability data.
INTRODUCTION
In the last decades, population and evolutionary genetics have run towards a deeper and deeper survey of human genetic variation, thanks to the use of an ever-increasing spectrum of markers. Such knowledge has represented a turning point in the study of the evolutionary forces that shaped human diversity, enabling the reconstruction of human populations’ history and representing an extremely precious chance to explore the genetic basis of adaptation and its crucial medical implications. In this scenario, mitochondrial DNA (mtDNA) has played a pivotal role both because the mitochondrion is highly involved in a great number of cellular processes in health and disease, and because of its consolidated use as phylogenetic marker. Human mtDNA is a polyploid molecule 16 570 bp long on average. The number of copies of the mitochondrial genome ranges from a few hundreds to 2 00 000 molecules per cell, depending upon the cytotype. However, also due to an inefficient repair system, mutations are more easily fixated with respect to those in nuclear DNA, giving rise to the phenomenon of heteroplasmy, namely the coexistence within a cell of different mtDNA genotypes. In evolutionary terms, on average, the mtDNA of two unrelated individuals may differ by ∼50 nt (1). Such highly polymorphic nature has allowed to cluster human mtDNAs into haplogroups, each containing a subset of mtDNAs sharing fixed mutations acquired from the same ancestral DNA (2). Hence, various population lineages may be described by means of a phylogenetic tree in which the top nodes define haplogroups and the tips haplotypes. Major haplogroups are ethno-specific, and their classification is becoming increasingly finer thanks to the growth in the type and quantity of available molecular data. Indeed, a large amount of sequence variation data and related information deriving from mitochondrial population genetics and clinical studies are continuously produced and processed. Population studies and reconstruction of phylogeny have long been based upon sequencing of the hypervariable segments 1 and 2 (HVS1 and HVS2 regions), two fragments of the mtDNA genome of about 300 bp located within the D-loop, the major mtDNA regulatory region. In addition, the recognition of polymorphisms along the entire coding part of the genome has been mainly entrusted on data obtained from restriction fragment-length polymorphism techniques; these data, added to the variants observed in the two HVS regions, have contributed to the first haplogroups definition. Clinical definition of ‘mitochondrial pathologies’ indicating very severe or mild forms of neuromuscular disorders has been based on the screening of specific mutations of mtDNA which often may have variable penetrance and expressivity. Starting from 2001 (3), the sequencing of the entire human mitochondrial genome has become an ever-increasing compulsory approach both with the aim to study human populations and to understand whether and how mtDNA mutations impinge on disease features, in penetrance and expressivity. This trend is currently growing thanks to the advent of next-generation sequencing (NGS) technologies. The extent of the application of large-scale mtDNA sequencing is evident when searching GenBank for human complete mitochondrial genomes. In a short lapse of time, the number of whole human mtDNA sequences deposited has risen to 8700 (updated in June 2011). These sequences carry with them a large amount of information specifically associated to individuals belonging to the most various populations of the globe. These individuals may be healthy or may present disease-associated phenotypes, such as a clear-cut adult and pediatric neuro-muscular disease or diabetes or the most prevalent age-associated neurodegenerative diseases, i.e. Parkinson's (4) or Alzheimer's (5) and even various cancer phenotypes (6,7).
The comparison of each mtDNA complete sequence with the revised Cambridge Reference Sequence (rCRS, GenBank Accession NC_012920.1) (8,9) allows to identify variant sites and hence to assign the most appropriate haplogroup. Moreover, the occurrence of individual-specific, or private, mutations may lead either to define a new sub-haplogroup or to highlight association with disease. The worldwide recognized reference system that gathers these data into a complete and updated human mtDNA haplogroup classification tree is Phylotree [(10), http://www.phylotree.org].
When a new genome is sequenced, its annotation must be based on previously filtered information, generally collected within human mtDNA-specific resources. The starting website is usually MITOMAP, a compendium of polymorphisms and mutations of human mtDNA (11). Indeed, each published human mtDNA polymorphism or disease associated mutation is annotated in tables, where the mutation is associated to the publication reference. The search engine does not allow combining multiple searching criteria. No frequency data concerning mutations and polymorphisms are available. The complete human mtDNA sequences can be downloaded by GenBank through a link to Entrez (NCBI). With respect to the human mtDNA haplogroups a simplified tree image can be downloaded. Links to the other worldwide mitochondrial resources are implemented. A comparison between them and the resource here presented, HmtDB, is detailed in the ‘Discussion’ section.
Here we report an updating of HmtDB, a mtDNA genomic resource previously described (12) where complete human mitochondrial genomes are annotated with information derived from primary databases and literature manually curated; moreover information concerning variability obtained by the application of specific software are stored.
HmtDB Organization
The core of HmtDB is the database, which reports all publicly available human mitochondrial genomes obtained from healthy or pathologic samples. Within the healthy category are the genomes derived from population studies, whereas the pathologic category hosts genomes of subjects affected with classical mitochondrial as well as any other disease in which mitochondrial alterations have been suspected to play a role.
The genomes from both data sets are further classified in five sub-data sets, one for each continent. The genomes extracted from the International Nucleotide Sequence Database Collaboration (INSDC) primary databases (13), are subjected to a characterizing protocol (described in the ‘HmtDB database generation and updating’ section). The obtained results are annotated in HmtDB with other information such as the human mtDNA haplogroup classification obtained by the elaboration of the entire Phylotree classification and any other data concerning disease associated mutations as reported in MITOMAP. The updating of the haplogroup classification is synchronized with that of Phylotree. The HmtDB database is of relational type, designed and implemented using the DB2 Relational Database Management System (DBMS) from IBM corporation. HmtDB structure details have been previously reported (12).
Upon accessing HmtDB (www.hmtdb.uniba.it:8080/hmdb) a web page introduces the user to the description of the resource via the sidebar links. A click on access to HmtDB displays a menu which allows to visualize the macrofunctions that may be activated within the resource: Query HmtDB, Classify your genome, Fragment Classify and HmtDB downloading. The menu macrofunctions Query and Classify are also listed on the top bar, which remains accessible at any stage of the HmtDB consulting session.
HmtDB database generation and updating
The exponential growth of whole mtDNA genomes generated by the implementation of large-scale sequencing has led to an optimization of the HmtDB updating procedure in order to keep up with data posted in INSDC. A central role in the HmtDB database is assumed by the haplogroup classification data derived from Phylotree. Being HmtDB a network available in html format and frequently updated, we have implemented a semi-automatic protocol which, starting from the ‘html’ Phylotree document extracts the new data and updates ‘excel’ tables which are further elaborated and stored in the HmtDB database. Phylotree structure contains ancestral nodes which are simply annotated with the rCRS position. In order to facilitate and assure a most precise transformation of the Phylotree structure in a file which is part of the HmtDB data and which can be correctly used for the haplogroup predictions, we have assigned to the nodes without name, a name according to rules which can be also useful to the user to understand how deep a genome classification can be reached. Supplementary file 1 reports the list of the nodes positions and of the codes we have assigned. Here below the HmtDB updating flow-chart is described and the complete updating workflow is reported in Figure 1.
Figure 1.

The HmtDB database generation workflow. The workflow describes the procedure implemented when updating HmtDB.
Extraction of new genomes from GenBank
A MyNCBI account has been activated, whose function is to automatically check for newly deposited human mitochondrial genomes stored in GenBank, on a monthly basis. When new sequences become available, data download is manually performed. The Entrez query performed is: ‘(014000[SLEN] : 017000[SLEN]) AND “Homo sapiens”[Organism] AND mitochondrion AND yy/mm/dd:yy/mm/dd [publication date] NOT NC_012920.1’. The SLEN filter allows the selection of both complete and partial genomes. The two dates allow to extract from GenBank those genomes that have been published subsequently to the last HmtDB update. The accession number list of the newly downloaded genomes is then compared with the previous version contained in HmtDB to verify whether the genome is already present. If this is the case, the updated genomes are overwritten in HmtDB. The new genomes are hence handled according the procedure below.
Annotation of the new genomes
New genomes are downloaded both in GenBank and FASTA format. Data available in the GenBank entry and in the associated literature are in part extracted through the application of the Python script ‘parse_entry.py’ and in part by curators, which carefully read both the GenBank entry and the associated literature. The information gathered is finally stored in the ‘HmtDB Genome Annotation Excel Table’.
HmtDB Genomes Multi-Alignment
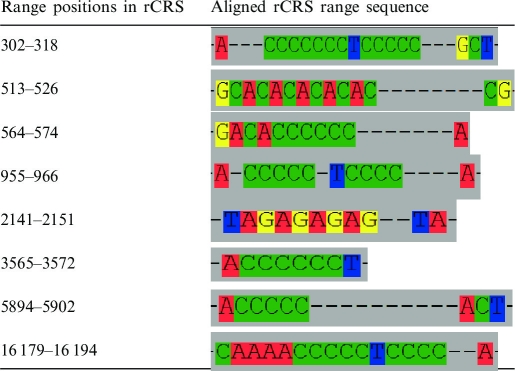
Both healthy and pathologic genome sets have been thus far multi-aligned by applying the MAFFT program (14). Recently, due to the increasing number of sequences, a strategy has been implemented to facilitate a one-shot multi-alignment (MA) of thousands of genomes. Such method considers the assumption that human mtDNA sequence variation is prevalently based on single nucleotide polymorphisms. Hence, MA software may generate ambiguous alignments only around homopolymeric regions where short insertions/deletions (indels) are frequently observed. Thus, in order to avoid the random insertion of gaps in the automatically generated MA, a set of rules has been fixed for each homopolymeric stretch. Table 1 reports for each rCRS region where the rules have been fixed an extract of the rCRS multi-aligned sequence in the region as it is in the whole healthy dataset MA. The criteria are decided and implemented by taking into account the haplogroup defining positions located in the considered region according to data reported in Phylotree. The whole MA process is performed via the Seaview Editor; new genomes are added directly to the previously existing MA and manually re-aligned. The resulting MA is stored and subsequently processed with the SiteVar software. Moreover, continent-specific MAs are automatically produced, as an extract of both healthy and pathologic all data set genomes. The user may finally download any MAs through the HmtDB downloading function. Based on the multi-aligned sequences, for each genome the SNPs table, including also the insertion and deletion events, is produced.
Table 1.
Description of the rules implemented for the updating of the genomes MA
 |
Application of ‘SiteVar’ Algorithms
Human mtDNA is a small molecule, 16 570 nt long, with only a small part of which being non-coding. It is therefore highly constrained in the maintenance of its functions. Notwithstanding this and because no exhaustive repair systems are active within mitochondria (15), mutation rate is 10 times higher than that of nuclear DNA (16). Thus, the availability in a single resource of such a large number of human mitochondrial genomes from subjects representative of worldwide populations is a unique occasion to estimate through a rigorous analysis which sites are more prone to mutate and how frequently each mutation occurs. HmtDB allows the estimation of both nucleotide and amino acid site variability via the SiteVar (17) and the MitVarProt (18) programs. Details about the software are available in Supplementary File 2. The variability values range from 0 to 1. Sites whose variability value is close to 1 present an allele whose state is common to an entire sub-tree of the whole tree representative of the genomes stored in HmtDB or could be subjected to recurrent mutations. Low variability values may be suggestive of a novel haplogroup-defining variant or indicate a rare disease-linked mutation.
Storage of new genomes and related data in the DB2 HmtDB database
Once the genomes and their related information have been retrieved and variability estimated, the so-called batch process is launched, allowing the storage of data in the HmtDB database. An identifier is assigned to each annotated genome according to the format ZZ_YY_####, where ZZ is the continent code (AF for Africa, AS for Asia, AM for America, EU for Europe and OC for Oceania), YY is the two-letter code corresponding to the country from which the subject originates, #### is a four digit code sequentially assigned for each newly added genome. When the continent and/or the country are unknown ZZ=XX and YY=XX. For pathologic genomes the ID format is PA_YY_####.
The HmtDB macrofunctions
Query HmtDB
The query function allows the user to retrieve data from HmtDB. The retrieval is performed according to an advanced search system carried out through the Boolean combination of different criteria corresponding to the fields defined in the design of the database. Figure 2 reports the query form as it is available on the web site. Table 2 summarizes the whole set of criteria. The retrieval output displays a list briefly describing the retrieved genomes: HmtDB Identifier, Database source Identifier and Pubmed brief description of the paper where the genome has been published. With a click on the Database source identifier as well as on the PubMed ID, the GenBank entry and the reference abstract are displayed, respectively. A click on the HmtDB Identifier displays the genome card. Multiple genomes may be browsed at once by selecting them through the left square and then by clicking on view genome cards displayed on the bottom of the page. Figure 3 shows an example of an HmtDB stored genome card. The MAs as well as the sequences of the selected genomes can be downloaded. When downloading MAs data, both the download of the rCRS sequence and the use of the SeaView (20) MA editor are suggested.
Figure 2.

The HmtDB ‘query’ form. A detailed description of the implemented retrieval criteria is reported in Table 2.
Table 2.
List and descriptions of criteria that may be combined when using the HmtDB retrieval system (Query macro function)
| Query criteria | Description |
|---|---|
| HmtDB Genome Identifier | A pop up menu allows to select a genome whose HmtDB genome identifier is known. |
| Reference DB ID | A pop up menu allows to select a genome whose INSDC Accession number is known. |
| Subject's geographical origin (continent/country) | A pop up menu allows to select genomes whose associated subject belong to a specific continent/country. |
| Author/Fragment_Classifier Haplogroup user code | A pop up menu allows to select genomes matching with a specific haplogroup as it has been assigned in the associated paper and for partial genomes as it has been assigned by the fragment classifier tool. |
| Complete genomes / Only coding region | HmtDB annotates complete genomes or genomes not inclusive of the D-loop region. |
| SNP position | Position of the rCRS sequence reporting in the genomes to be selected a mutation respect to rCRS. |
| Variation type | It is possible to add to the position search, the option to search for genomes whose asked position reports transition or trasversions only, and in addition to search for a specific transition or transversion. Within Variation type it is possible to ask to search for Genomes reporting Insertion and/or deletions in assigned positions. |
| Subject age | Genomes whose related subjects had a specific age at the sampling time. |
| Subject sex | Genomes from subjects of a specific gender. |
| DNA source | Genomes sequenced from sample extracted from a specific tissue. |
| Individual type | Genomes from healthy or pathologic data sets or from a phenotype related to a specific disease. |
| References | Genomes related to a specific paper or to paper published from a specific author, or a genome identified in the paper with a specific haplotype code. |
The Haplogroup user code may not match with the haplogroup predicted by the application of the classifier tool because this last is assigned according to the last updating of Phylotree while the first one was assigned when the genome was published.
Figure 3.

The genome card associated to the genome AF_BF_0004. The genome card is organized in three parts hosting the following annotations. (Part 1) Data allowing the genome identification (HmtDB identifier, genome accession number and database of origin, the Author/Fragment_classifier Predicted Haplogroup code, the haplotype identifier, the tissue origin of DNA, the length of the genome, the sequencing technique and the Pubmed link to the reference where the genome has been published) followed by the haplogroup prediction as described in the classify your genome section and based on Phylotree classification (the percentage threshold is fixed to 75); a click on the haplogroup code opens a new window where the haplogroup defining sites are displayed in association with Yes or No flag indicating whether the genome harbours the allele that contributes to the haplogroup definition. (Part 2) Data about the individual from which the DNA has been extracted. (Part 3) Variability table: each line in the table refers to a mutation; the colour of the line is associated to the locus type (see colour legend when connected to HmtDB). The line reports mutation data (nucleotide and, when appropriate, amino acidic positions, alleles and locus name), the mtREV index (19) indicating the amino acidic change probability estimated on mammalian mitochondria-coded proteins, the variability index estimated on the two nucleotide data sets and on the corresponding amino acidic data sets as well as on proteins derived from 60 mammalian genomes. Finally, data derived from MITOMAP concerning the association to the disease are reported. On the bottom of the genome-card data concerning deletion and insertion events are shown. A clicking on the variability index opens up a new window, reporting more detailed data concerning the site variability in different continents and in pathologic samples.
Classify your genome
The release of more than 8000 human mtDNAs has implicated an expansion of the haplogroup tree and boosted the need of a set of tools to allow haplogroup assignment. Phylotree (10) is an excellent system that allows the user to have a complete overview of the most updated haplogroup classification. However, the haplogroup attribution based on Phylotree can only be performed manually. HmtDB automatically attributes the haplogroup through the classify procedure which includes the Phylotree structure. This procedure is performed individually on every genome stored in HmtDB, and it also runs through the classify your genome macrofunction. It essentially consists of automatic comparison between a single human mitochondrial genome (query) and the rCRS sequence, with the aim of detecting the pattern of mtDNA SNPs of the query. The haplogroup prediction for the HmtDB annotated genome is based on the SNPs table. In the classify your genome option, the comparison is based on the application of the MUSCLE software (21). Upon matching of an obtained pattern against the Phylotree haplogroup classification stored in HmtDB, the prediction of the query sequence haplogroup may be performed. A genome card of the submitted genome is generated and displayed, on which the haplogroup prediction is expressed as a list of haplogroups for which a match was found, and, for each haplogroup, a percentage of the detected variations with respect to the total number of variations defining the haplogroup is given (Figure 3). The genome cards produced after the application of the query and classify macro functions have similar formats, although the latter lacks information concerning the genome source and references. In the genome card information about the uniqueness of the haplotype genome within HmtDB is shown.
Fragment classify tool
Although sequencing of the entire mitochondrial genome is becoming a feasible approach, frequently researchers prefer to focus on short fragments of the genome, especially in disease case studies. In these circumstances, due to the scattering of the defining sites of any specific haplogroup along the entire mtDNA molecules, the sensibility of the above-described classification tool becomes increasingly lower as the length of the fragment decreases. The fragment-haplo-classifier tool has been designed to overcome this problem. For each haplogroup it selects, among the total number of SNPs located in the fragment region, the ones annotated in Phylotree (Nph). Furthermore, the tool reports the number of SNPs defining the haplogroup in the whole genome (Nph_tot) and the Nph_tot subset expected in the fragment Nph_exp. The assigned haplogroup is the one whose fraction of Nph over the total number of the haplogroup-defining expected sites (Nph_exp) is highest. The higher is the ratio Nph_exp/Nph_tot, the more robust is the assignment. The number of Nph sites defining the haplogroups is strictly related to the evolutionary distance between rCRS and the considered genomes. Hence, higher is the distance lower will be the reliability of the obtained prediction as much as shorter is the fragment. Since partial genomes are also annotated in HmtDB, the Author/Fragment_Classifier Predicted Haplogroup code has been introduced within the Genome Card (Figure 3) in order to correct the haplogroup prediction, which may not be obtained with the entire genome classifier. Next to the haplogroup assigned by the author, the best haplogroup prediction upon application of the fragment classifier is indicated. Supplementary File 3 reports the results obtained by applying the fragment classifier tool to 820 partial genomes from healthy subjects available in HmtDB.
The tool is written in Python and it can be downloaded as a package to be locally implemented. Instructions about the use of the package (Supplementary File 4) are available as documentation file when clicking on the fragment classifier option.
HmtDB downloading
The downloading function allows to download (i) MAs of the entire healthy and pathologic as well as of the continent specific data sets; (ii) variability data obtained by applying SiteVar software.
The HmtDB database content
HmtDB contains human mitochondrial genomes derived from the public primary INSDC databases. Genomes associated to population studies are stored and analyzed as a whole data set (healthy) and grouped in continent-specific subsets (AF: Africa, AM: America, AS: Asia, EU: Europe, OC: Oceania). Genomes from subjects affected by diseases are reported in a separate data set annotated as pathologic. The number of items of each data set is available through the Statistics window (Figure 4). Data reported here refer to the last download from GenBank (19 June 2011). The application of the BlastClust program on each continent specific subset both from healthy and pathologic data sets has allowed to determine the number of unique haplotypes for each group (Table 3). The analysis was performed according to the following command line: ‘blastclust -i infile -o outfile -p F -L1 -b T –S100’. BlastClust (written by I.Dondoshansky in collaboration with Y.Wolf) is available from NCBI via ftp (ftp://ftp.ncbi.nlm.nih.gov/blast) and works only with stand-alone BLAST.
Figure 4.

The Statistics window. For each data set and sub-data sets the number of HmtDB stored genomes and of their variant sites is summarized.
Table 3.
HmtDB haplotypes
| Continent | Data set | Genomes (n) | Unique haplotypes (n) | Unique haplotypes (%) |
|---|---|---|---|---|
| Africa | Healthy | 826 | 772 | 93.46 |
| Pathologic | 0 | 0 | 0.00 | |
| America | Healthy | 693 | 656 | 94.66 |
| Pathologic | 4 | 4 | 100.00 | |
| Asia | Healthy | 3185 | 3171 | 99.56 |
| Pathologic | 501 | 465 | 92.81 | |
| Europe | Healthy | 1597 | 1527 | 95.62 |
| Pathologic | 237 | 230 | 97.05 | |
| Oceania | Healthy | 193 | 184 | 95.34 |
| Pathologic | 0 | 0 | 0.00 | |
| All continents | Healthy | 6494 | 6310 | 97.17 |
| Pathologic | 742 | 699 | 94.20 |
Unique haplotypes number and percentage in the healthy and pathologic continent data sets. All continents number of genomes does not match with the whole ‘healthy’ data set quantity of genomes because of the unclassified_continent genomes.
The BlastClust manual reports that the parameters we have fixed in the run are those to be chosen are the conditions to be chosen to clusterize together only identical sequences: thus two genomes with even a single mismatch are here flagged as belonging to different haplotypes. A less stringent analysis may be implemented, although it is difficult to fix a threshold that may allow to recognize true from false different haplotypes in connection with sequencing quality. The choice to use stringent BlastClust parameters, instead, allows with a good approximation to estimate human mtDNA variability based on the number of different haplotypes observed.
DISCUSSION
In the present article, we report an updating of the HmtDB genomic resource (8), a database intended to support both population geneticists as well as clinicians undertaking the task to assess the pathogenicity of specific mtDNA mutations. The major improvements here reported concern the query system and the classifier tools. The increasing number of complete and fragmented human mitochondrial genomes published requires the availability of updated and well-structured resources to give access in real time to the new data produced. In this context the Phylotree web system, integrated with HmtDB, represents a valid support to this aim, making the haplogroup prediction of newly produced genomes as well as of genomes previously published fine and reliable. Indeed, once new genomes are sequenced, the browsing of the database and the application of the classifiers become pivotal procedures in order to verify the quality of the sequence. In fact, in the attempt to attribute the haplogroup to the submitted genome, the classify tool provides information that may attribute an inappropriate haplogroup. The reason for this may reside in the misreading of the sequence. In light of the many cases of misinterpretation due to nuclear mitochondrial sequences (NumtS) contamination, phantom mutations and recombination artifacts, as brought up by Refs (22–25), it is plausible to wonder whether the increase in number of human mitochondrial genomes relevantly contributes to foster knowledge or merely to augment noise (22). A critical examination of the classify results may highlight the absence/presence of some alleles which could unequivocally allow the attribution of the genome to an appropriate haplogroup. This aspect strengthens the value of HmtDB in the application of the classifier tools both in the case of the complete genome as well as in the case of fragments. However, in the latter circumstance, the reliability of the predicted haplogroup depends upon the length as well as the region of the genome where the fragment maps. Indeed, the haplogroup defining sites are spread along the genome albeit not in a homogeneous fashion. Thus, one of our main goals is to identify the most informative regions on the basis of the Phylotree data. However, the application of the fragment classifier tool has demonstrated to be a powerful tool when applied to the HmtDB partial genomes (Supplementary File 3). Such application has allowed to update the haplogroup assignment taking into account the more detailed actual classification as well as to revise incorrect attribution. Examples of human mtDNA data revised upon the direct implementation of HmtDB tools are abundant in the recent literature (6,7,26,27). The query system helps researchers to easily retrieve data on variants not listed in other databases (e.g. MITOMAP), when pathogenic potential of mtDNA variants need to be predicted. Also, the availability of site variability data contributes both to the definition of new haplogroups and to the recognition of private variants or mutations with a potential pathogenic role. It is worth mentioning that with respect to amino acid changes, the estimation of the functional effect obtained with external systems such as PolyPhen (28), or SIFT (29) may further contribute to evaluate the quality of the sequence as well as the impact on the phenotype. However, disease-associated mutations are not only located in protein coding loci. Various mutations have been described as responsible for or associated with disease, which map within RNA genes (both tRNAs and rRNAs). In these cases, the observation of the effect on the secondary structure as well as the comparison of the site variability within the inter-vertebrata MA ought to be compulsory validating procedures in order to estimate pathogenicity.
Furthermore, both quality and correct interpretation of collected data is of utmost importance to this purpose. In clinical studies, HmtDB may represent an advanced tool towards a further development of tailored databases including all relevant data related to genotype, phenotype, family history, healthy controls and functional studies to allow a more accurate interpretation for clinicians and their patients. To start developing this ambitious task, the first issue we intend to tackle concerns the individual type annotation. In this context, the clear distinction between healthy and pathologic categories of the data adds an important value to the database. Genomes are in fact separated in the two categories based on what is reported in the paper where they are extracted from. Nonetheless, definition of pathologic with respect to healthy may be ambiguous as the latter adjective may be used to indicate that the subject does not show the pathology for which he/she is used as control, which usually occurs in case–control studies. Within HmtDB, the pathologic subset indicates that the sequence comes either from a pathologic somatic tissue or from the blood of affected individuals, whom in many cases may have been screened following a suspect or a diagnosis of a mitochondrial disease. In cases when the mtDNA is sequenced from a pathologic somatic tissue, it is worth to underline that such sequences may not be necessarily different from the constitutive mtDNA, unless they harbor proven somatic mutations. Similarly, sequences obtained from constitutive mtDNA of pathologic individuals may not always harbor germ-line mutations. With respect to the healthy category, it must be said that it includes all mtDNAs for which the health status of the subject is not specified, a common feature for genomes extracted from population-based studies. These genomes may not be necessarily devoid of private or pathologic mutations, although the fact that they have been mostly sequenced from blood (or saliva) renders this condition very likely. Ultimately, there is still a need for a more punctual annotation. Lack of specifications as well as the plethora of yet uncovered mitochondria-related pathologic conditions makes it virtually impossible to correctly classify mtDNAs within the two above-mentioned categories, with the exception of few certain cases. Nevertheless, this division is thus far, in our opinion, the most functional when it comes to choose a population of controls, which however should be carefully selected based on the variability data HmtDB reports.
HmtDB is not the only resource where data concerning human mtDNA variability are stored. Starting from the MITOMAP home page, links to the most relevant databases are implemented. Nonetheless, upon accessing some of these resources, it becomes evident that they are no longer updated, whereas others host data confined to the HVS1 and HVS2 regions only. Only MitoTool (30) presents aspects which overlap with the features implemented in HmtDB. All the others are either incomplete or provide complementary information, such as Zaramit (31), Phylotree (10), EMPOP (32) and MITOMAP (11). The combined use of all these resources, integrated with HmtDB, have the potential to offer the scientific community a true human ‘mitochondriome’ portal.
SUPPLEMENTARY DATA
Supplementary Data are available at NAR Online: Supplementary Files 1–4.
FUNDING
‘Fondo di Ateneo’ (University of Bari); ‘Fondazione della Cassa di Risparmio di Puglia’ (to M.A.); the Italian Ministry of University and Research (MIUR) grant FIRB ‘Futuro in Ricerca’ J31J10000040001 (in part); the contribution obtained by Prof. Herawati Sudoyo of the Eijkman Institute of Molecular Biology, Jakarta (Indonesia) to G.G. Funding for open access charge: Fondo FIRB (to G.G.).
Conflict of interest statement. None declared.
ACKNOWLEDGEMENTS
We thank Dr Mannis van Oven for his advice and help in the process of generation of the Phylotree structure inside the HmtDB resource. The maintenance and updating of the database is possible thanks to the voluntary contribution of students and young graduates. In particular, we thank Maria Liapi, Mariangela Santorsola, Mariangela Diroma and Cosimo Mezzina.
REFERENCES
- 1.Pereira L, Freitas F, Fernandes V, Pereira JB, Costa MD, Costa S, Máximo V, Macaulay V, Rocha R, Samuels DC. The diversity present in 5140 human mitochondrial genomes. Am. J. Hum. Genet. 2009;84:628–640. doi: 10.1016/j.ajhg.2009.04.013. [DOI] [PMC free article] [PubMed] [Google Scholar]
- 2.Torroni A, Rengo C, Guida V, Cruciani F, Sellitto D, Coppa A, Calderon FL, Simionati B, Valle G, Richards M, et al. Do the four clades of the mtDNA haplogroup L2 evolve at different rates? Am. J. Hum. Genet. 2001;69:1348–1356. doi: 10.1086/324511. [DOI] [PMC free article] [PubMed] [Google Scholar]
- 3.Ingman M, Gyllensten U. Analysis of the complete human mtDNA genome: methodology and inferences for human evolution. J. Hered. 2001;92:454–461. doi: 10.1093/jhered/92.6.454. [DOI] [PubMed] [Google Scholar]
- 4.Finsterer J. Parkinson's syndrome and Parkinson's disease in mitochondrial disorders. Mov. Disord. 2011;26:784–791. doi: 10.1002/mds.23651. [DOI] [PubMed] [Google Scholar]
- 5.Mancuso M, Orsucci D, LoGerfo A, Calsolaro V, Siciliano G. Clinical features and pathogenesis of Alzheimer's disease: involvement of mitochondria and mitochondrial DNA. Adv. Exp. Med. Biol. 2010;685:34–44. doi: 10.1007/978-1-4419-6448-9_4. [DOI] [PubMed] [Google Scholar]
- 6.Porcelli AM, Ghelli A, Ceccarelli C, Lang M, Cenacchi G, Capristo M, Pennisi LF, Morra I, Ciccarelli E, Melcarne A, et al. The genetic and metabolic signature of oncocytic transformation implicates HIF1alpha destabilization. Hum. Mol. Genet. 2010;19:1019–1032. doi: 10.1093/hmg/ddp566. [DOI] [PubMed] [Google Scholar]
- 7.Guerra F, Kurelac I, Cormio A, Zuntini R, Amato LB, Ceccarelli C, Santini D, Cormio G, Fracasso F, Selvaggi L, et al. Placing mitochondrial DNA mutations within the progression model of type I endometrial carcinoma. Hum. Mol. Genet. 2011;20:2394–2405. doi: 10.1093/hmg/ddr146. [DOI] [PubMed] [Google Scholar]
- 8.Anderson S, Bankier AT, Barrell BG, de Bruijn MH, Coulson AR, Drouin J, Eperon IC, Nierlich DP, Roe BA, Sanger F, et al. Sequence and organization of the human mitochondrial genome. Nature. 1981;290:457–465. doi: 10.1038/290457a0. [DOI] [PubMed] [Google Scholar]
- 9.Andrews RM, Kubacka I, Chinnery PF, Lightowlers RN, Turnbull DM, Howell N. Reanalysis and revision of the Cambridge reference sequence for human mitochondrial DNA. Nat. Genet. 1999;23:147. doi: 10.1038/13779. [DOI] [PubMed] [Google Scholar]
- 10.van Oven M, Kayser M. Updated comprehensive phylogenetic tree of global human mitochondrial DNA variation. Hum. Mutat. 2009;30:E386–394. doi: 10.1002/humu.20921. [DOI] [PubMed] [Google Scholar]
- 11.Ruiz-Pesini E, Lott MT, Procaccio V, Poole JC, Brandon MC, Mishmar D, Yi C, Kreuziger J, Baldi P, Wallace DC. An enhanced MITOMAP with a global mtDNA mutational phylogeny. Nucleic Acids Res. 2007;35:D823–D828. doi: 10.1093/nar/gkl927. [DOI] [PMC free article] [PubMed] [Google Scholar]
- 12.Attimonelli M, Accetturo M, Santamaria M, Lascaro D, Scioscia G, Pappadà G, Russo L, Zanchetta L, Tommaseo-Ponzetta M. HmtDB, a human mitochondrial genomic resource based on variability studies supporting population genetics and biomedical research. BMC Bioinformatics. 2005;6(Suppl. 4):10. doi: 10.1186/1471-2105-6-S4-S4. [DOI] [PMC free article] [PubMed] [Google Scholar]
- 13.Cochrane G, Karsch-Mizrachi I, Nakamura Y. The International Nucleotide Sequence Database Collaboration. Nucleic Acids Res. 2011;39:D15–D18. doi: 10.1093/nar/gkq1150. [DOI] [PMC free article] [PubMed] [Google Scholar]
- 14.Katoh K, Asimenos G, Toh H. Multiple alignment of DNA sequences with MAFFT. Methods Mol. Biol. 2009;537:39–64. doi: 10.1007/978-1-59745-251-9_3. [DOI] [PubMed] [Google Scholar]
- 15.Jeppesen DK, Bohr VA, Stevnsner T. DNA repair deficiency in neurodegeneration. Progress Neurobiol. 2011;94:166–200. doi: 10.1016/j.pneurobio.2011.04.013. [DOI] [PMC free article] [PubMed] [Google Scholar]
- 16.Endicott P, Ho SYW, Metspalu M, Stringer C. Evaluating the mitochondrial timescale of human evolution. Trends Ecol. Evol. 2009;24:515–521. doi: 10.1016/j.tree.2009.04.006. [DOI] [PubMed] [Google Scholar]
- 17.Pesole G, Saccone C. A novel method for estimating substitution rate variation among sites in a large dataset of homologous DNA sequences. Genetics. 2001;157:859–865. doi: 10.1093/genetics/157.2.859. [DOI] [PMC free article] [PubMed] [Google Scholar]
- 18.Horner DS, Pesole G. The estimation of relative site variability among aligned homologous protein sequences. Bioinformatics. 2003;19:600–606. doi: 10.1093/bioinformatics/btg063. [DOI] [PubMed] [Google Scholar]
- 19.Adachi J, Hasegawa M. Model of amino acid substitution in proteins encoded by mitochondrial DNA. J. Mol. Evol. 1996;42:459–468. doi: 10.1007/BF02498640. [DOI] [PubMed] [Google Scholar]
- 20.Gouy M, Guindon S, Gascuel O. SeaView version 4: a multiplatform graphical user interface for sequence alignment and phylogenetic tree building. Mol. Biol. Evol. 2010;27:221–224. doi: 10.1093/molbev/msp259. [DOI] [PubMed] [Google Scholar]
- 21.Edgar RC. MUSCLE: multiple sequence alignment with high accuracy and high throughput. Nucleic Acids Res. 2004;32:1792–1797. doi: 10.1093/nar/gkh340. [DOI] [PMC free article] [PubMed] [Google Scholar]
- 22.Yao Y-G, Salas A, Logan I, Bandelt H-J. mtDNA data mining in GenBank needs surveying. Am. J. Hum. Genet. 2009;85:929–933. doi: 10.1016/j.ajhg.2009.10.023. author reply 933. [DOI] [PMC free article] [PubMed] [Google Scholar]
- 23.Bandelt HJ, Achilli A, Kong QP, Salas A, Lutz-Bonengel S, Sun C, Zhang YP, Torroni A, Yao YG. Low ‘penetrance’ of phylogenetic knowledge in mitochondrial disease studies. Biochem. Biophys. Res. Commun. 2005;333:122–130. doi: 10.1016/j.bbrc.2005.04.055. [DOI] [PubMed] [Google Scholar]
- 24.Bandelt HJ, Salas A, Bravi CM. What is a `novel' mtDNA mutation–and does 'novelty' really matter? J. Hum. Genet. 2006;51:1073–1082. doi: 10.1007/s10038-006-0066-5. [DOI] [PubMed] [Google Scholar]
- 25.Bandelt HJ, Yao YG, Salas A, Kivisild T, Bravi CM. High penetrance of sequencing errors and interpretative shortcomings in mtDNA sequence analysis of LHON patients. Biochem. Biophys. Res. Commun. 2007;352:283–29. doi: 10.1016/j.bbrc.2006.10.131. [DOI] [PubMed] [Google Scholar]
- 26.Bartoletti-Stella A, Salfi NCM, Ceccarelli C, Attimonelli M, Romeo G, Gasparre G. Mitochondrial DNA mutations in oncocytic adnexal lacrimal glands of the conjunctiva. Arch. Ophthalmol. 2011;129:664–666. doi: 10.1001/archophthalmol.2011.95. [DOI] [PubMed] [Google Scholar]
- 27.Zoccolella S, Petruzzella V, Prascina F, Artuso L, Pacillo F, Dell'Aglio R, Avolio C, Delle Noci N, Attimonelli M, Specchio LM. Late-onset Leber hereditary optic neuropathy mimicking Susac's syndrome. J. Neurol. 2010;257:1999–2003. doi: 10.1007/s00415-010-5649-6. [DOI] [PubMed] [Google Scholar]
- 28.Ramensky V, Bork P, Sunyaev S. Human non-synonymous SNPs: server and survey. Nucleic Acids Res. 2002;30:3894–3900. doi: 10.1093/nar/gkf493. [DOI] [PMC free article] [PubMed] [Google Scholar]
- 29.Kumar P, Henikoff S, Ng PC. Predicting the effects of coding non-synonymous variants on protein function using the SIFT algorithm. Nat. Protocols. 2009;4:1073–81. doi: 10.1038/nprot.2009.86. [DOI] [PubMed] [Google Scholar]
- 30.Fan L, Yao Y-G. MitoTool: a web server for the analysis and retrieval of human mitochondrial DNA sequence variations. Mitochondrion. 2011;11:351–356. doi: 10.1016/j.mito.2010.09.013. [DOI] [PubMed] [Google Scholar]
- 31.Blanco R, Mayordomo E, Montoya J, Ruiz-Pesini E. Rebooting the human mitochondrial phylogeny: an automated and scalable methodology with expert knowledge. BMC Bioinformatics. 2011;12:174. doi: 10.1186/1471-2105-12-174. [DOI] [PMC free article] [PubMed] [Google Scholar]
- 32.Parson W, Dür A. EMPOP–a forensic mtDNA database. Forensic Sci. Int. Genet. 2007;1:88–92. doi: 10.1016/j.fsigen.2007.01.018. [DOI] [PubMed] [Google Scholar]