Abstract
Spontaneous action potentials have been described in developing sensory systems. These rhythmic activities may have instructional roles for the functional development of synaptic connections. The importance of spontaneous action potentials in the developing auditory system is underpinned by the stark correlation between the time of auditory system functional maturity, and the cessation of spontaneous action potentials. A prominent K+ current that regulates patterning of action potentials is IA. This current undergoes marked changes in expression during chicken hair cell development. Although the properties of IA are not normally classified as Ca2+-dependent, we demonstrate that throughout the development of chicken hair cells, IA is greatly reduced by acute alterations of intracellular Ca2+. As determinants of spike timing and firing frequency, intracellular Ca2+ buffers shift the activation and inactivation properties of the current to more positive potentials. Our findings provide evidence to demonstrate that the kinetics and functional expression of IA are tightly regulated by intracellular Ca2+. Such feedback mechanism between the functional expression of IA and intracellular Ca2+ may shape the activity of spontaneous action potentials, thus potentially sculpting synaptic connections in an activity-dependent manner in the developing cochlea.
Introduction
Structured spontaneous action potentials (SAPs) play an instructive role in the survival and refinement of neuronal connections in developing sensory systems [1]–[5]. Indeed, SAPs with different firing patterns encode information that may translate into variable gene expression that contributes to proper functional development [3], [6]–[8]. Similarly, developing hair cells (HCs) fire SAPs before the onset of hearing [9]–[14], at a period when major synaptic refinement occurs within the cochlea and cochlear nucleus (CN) [9], [13], [15]–[17]. Before the onset of hearing, auditory neurons at various levels of the auditory pathway show low, bursting and occasional rhythmic spontaneous activity. This rhythmic activity is robust in the cochlear ganglion cells of the pre-hatched chickens [18], [19], and the signal is abolished at higher levels by silencing the cochlea with the tetrodotoxin (TTX) injections or cochlear ablation [20]. Thus, SAPs may arise in the cochlea and it has been predicted that they may be modulated by the release of ATP from supporting cells and potentially contribute towards the establishment of proper tonotopic maps along auditory axes [21]–[23]. Incidentally, SAPs reappear during HC regeneration in chicken basilar papilla [9].
Spontaneous activity in developing HCs is Ca2+-dependent [9], [13], [16], [23], producing rhythmic changes in intracellular Ca2+ (Ca2+ i) [24], [25]. Moreover, phasic alterations of Ca2+ i mediate the expression of K+ channels that modulate SAPs, or influence the gene expression that may refine neuronal connections [26]–[30]. 4-AP-sensitive currents, presumably of A-type K+ currents (IA) regulate spike timing and firing frequency in neurons [31]–[33] and cardiac myocytes [34]. The unique properties of the underlying channels include rapid, transient activation in the sub-threshold potentials, followed by fast inactivation. Although IA is not known to be Ca2+-sensitive, in neurons and myocytes, the kinetics and expression have been associated with changes in Ca2+ i via channel protein interactions with Ca2+-sensitive proteins [35]–[39]. The functional relevance of these changes in Ca2+ homeostasis and IA expression are unknown but the correlation of the feedback between Ca2+ i and Ca2+-sensitive processes, such as the expression of IA, can have important ramifications in Ca2+ oscillations and wave propagation in developing HCs [40]–[43].
In order to better understand the mechanisms of these spontaneously generated action potentials, we investigated the functional expression of IA and its possible sensitivity to Ca2+ i handling. Chelation of Ca2+ i shifted the activation properties of the current to more positive potentials and reduced the expression of IA. Our findings provided direct evidence to demonstrate that IA is tightly regulated by Ca2+ i, a feedback mechanism that may shape the patterning of SAPs and ultimately sculpt synaptic connections in the developing cochlea.
Materials and Methods
Isolation of the Chicken Basilar Papilla
The present investigation was approved in accordance with the guidelines of the Institutional Animal Care and Use Committee of University of California, Davis. The protocol number was 15544 under the institutional authorization code A3433-01. This study included chickens at different stages of embryonic development ranging from E6–E21 as well as post-hatched chickens. Fertilized eggs were incubated at 37°C in a Marsh automatic incubator (Lyon Electric). Before experiments, chicken embryos were killed and staged according to the following: from E8–E12: based on visceral arches, feather gems and eyelids: and after E12 based on the length of the beak [44]. Basilar papillae were isolated as described previously [9]. The preparations were dissected in oxygenated chicken saline containing (in mM) 155 NaCl, 6 KCl, 4 CaCl2, 2 MgCl2, 5 Hepes, and 3 glucose, pH 7.4. The tegmentum vasculosum and the tectorial membrane were removed without any prior enzymatic treatment using a fine minutia needle. Chicken basilar papillae were stored in a 37°C incubator in Minimum Essential Medium (Invitrogen) before recording from HCs in situ. All experiments were performed at room temperature (21–23°C) within 5–45 mins of isolation. All reagents were obtained from Sigma Chemicals, unless specified otherwise.
Electrophysiology
K+ currents were recorded in a whole-cell voltage-clamp configuration, using 2–3 MΩ resistance pipettes. Currents were amplified with an Axopatch 200B amplifier (Molecular Devices, Union City, CA) and filtered at a frequency of 2–5 kHz through a low-pass Bessel filter. The data was digitized at 5–500 kHz using an analog-to-digital converter (Digidata 1200; Molecular Devices). The sampling frequency was determined by the protocols used. No online leak current subtraction was made, and only recordings with holding currents less than 50 pA were accepted for analyses. The liquid junction potentials were measured (3.5±0.9 mV, n = 149) and corrected online [45]. The capacitative transients were used to estimate the capacitance of the cell as an indirect measure of cell size. Membrane capacitance was calculated by dividing the area under the transient current in response to a voltage step as described [9]. The capacitative decay was fitted with a single exponential curve to determine the membrane time constant. Series resistance was estimated from the membrane time constant, given its capacitance. This study included ∼703 cells with a series resistance (Rs) within a 5–15 MΩ range. After 60–90% compensation of the mean residual, uncompensated Rs was 5.1±0.5 MΩ. The seal resistance was typically 5–20 GΩ.
Action potentials were amplified (100×) with an Axopatch 200B amplifier (Axon Instruments) and filtered at 2–5 kHz through a low-pass Bessel filter. The data were digitized at 5–500 kHz using an analog-to-digital converter (Digidata 1200; Axon Instruments). The sampling frequency was determined by the protocols used. Action potentials were recorded using extracellular solution containing (in mM) NaCl 145, KCl 6, MgCl2 1, CaCl2 0–2, D-glucose 10, Hepes 10, pH 7.3. For whole-cell recordings of action potentials we used pipette solution containing (in mM): KCl 130, Hepes 10, D-glucose, 5 KATP, 2–10, EGTA or BAPTA. Regarding perforated patch experiments, the tips of the pipettes were filled with the internal solution containing (in mM): KCl 150, Hepes 10, D-glucose 10, pH 7.3. The pipettes were front-filled with the internal solution and back-filled with the same solution containing 250-µg/ml amphotericin. The stock solutions of all toxins were made either in ddH2O or DMSO and stored at −20°C.
To record IA, we eliminated Ca2+ from the bath and used 20 mM TEA and 300 nM apamin to block K+ currents, such as the delayed rectifier and Ca2+-activated K+ currents (IK(Ca)). Extracellular solution contained (in mM) NaCl 125, KCl 6, CaCl2 0, 20 TEA, D-glucose 10, MgCl2 1, HEPES 10, pH 7.3, 310 mOsm. Intracellular solution contained (in mM) KCl 120, Na2ATP 5, MgCl2 2, HEPES 10, EGTA 1–10, or BAPTA 1–10, D-glucose 10, pH 7.3, 300 mOsm.
Data analysis
The number of cells (n) is given for each data set. Data were analyzed using pClamp8 (Molecular Devices), Origin7.0 (OriginLab Corp. Northampton, MA) and Excel (Microsoft). Time constants (τs) were obtained from fits using Origin software. Time constants were obtained by fitting multiple exponential terms to the activation and decay of the current. The equation was of the form:
Where I0 is the initial current magnitude, τ1, τ2…τn are the time constants, and A1, A2…An, are the proportionality constants. Voltage-dependence of activation was examined from peak amplitude (measured at ∼3–5 ms from the onset of voltage step) of tail currents at different developmental stages (embryonic, E) day-six to postnatal (P) day-two (E6-P2), then normalized steady-state curves were fitted with the Boltzmann distribution. Additionally, the steady-state inactivation curve was generated from normalized currents measured at a test potential following several conditioning pre-pulses. Pooled data were presented as mean ± SD. Significant differences between groups were tested using the Student's t test, with p<0.05 or 0.01 indicating statistical differences.
Results
Pharmacological elimination of IA profoundly alters the structure of SAPs in developing hair cells
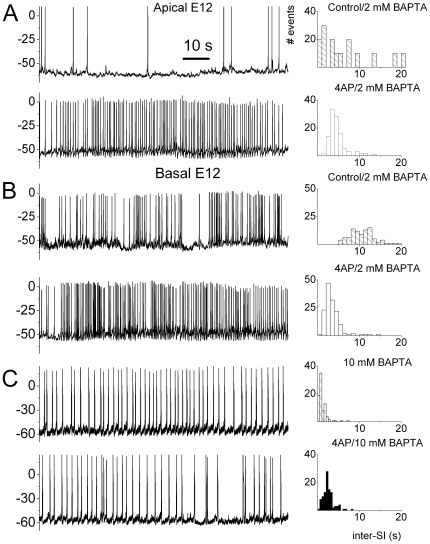
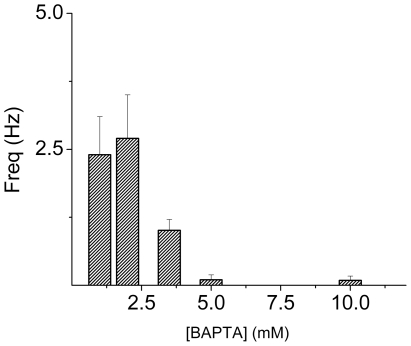
To examine the roles of IA on SAPs in developing HCs, we employed pharmacological strategies [9], [46]. We applied 2.5 mM 4-AP, voltage-dependent K+-current (IA) blocker, to spontaneously active HCs from the developing basilar papilla. Shown in Figures 1A and B are the effects of 4-AP on the patterning of SAPs. An immediate observation is that 4-AP induces marked alterations in the frequency of AP firing, which is reflected in a patent reduction in the inter-spike intervals plotted on the right panels (Fig. 1). For example, 4-AP induced a 10-fold increase in AP firing in developing HCs at the apical aspects of the basilar papilla at E12 (pre-4-AP: 0.11±0.05 Hz; post-4-AP: 1.1±0.2 Hz, p<0.01; n = 7). Similarly, basal HCs at E12 fire APs at the rate of ∼0.5 Hz (0.5±0.2 Hz, n = 9). Moreover, after application of 4-AP, the frequency of firing increased to ∼2 Hz (2.1±0.6 Hz, n = 9; p<0.05). These experiments were performed using 2 mM BAPTA in the pipette solution to mimic physiological buffering capacity [47]. Spontaneous action potentials in developing HCs are Ca2+-dependent [9], and to assess the role of intracellular Ca2+ (Ca2+ i) in 4-AP-mediated changes in AP firing rates, we used 10 mM pipette-BAPTA. Surprisingly, the typical phasic and burst pattern seen in E12 apical HCs (Fig. 1A) was replaced with tonic AP firing in the presence of 10 mM BAPTA (Fig. 1C). Even more startlingly was the resulting lack of 4-AP-mediated changes in the presence of 10 mM BAPTA. Changes in frequency of firing versus pipette-BAPTA concentrations are shown (Fig. 2). The correlation between 4-AP-mediated effects and high concentrations of BAPTA suggests that the 4-AP-sensitive current (IA) may be sensitive to Ca2+ I availability. Additionally, the data hinted that IA regulates the firing pattern of developing HCs in a Ca2+ I-dependent manner. The effects of BAPTA and 4-AP on individual action potentials are outlined in Table 1.
Figure 1. The pattern of spontaneous electrical activity in developing HCs is altered by IA blocker and changes in Ca2+ I.
(A) Spontaneous electrical activity recorded from apical E12 HCs using 2-mM pipette BAPTA, for 80 s before (upper trace) and after (lower trace) application of 2.5 mM 4-AP. The interspike interval distribution histogram is shown beside (right) the recorded spontaneous action potentials (SAPs). (B) SAPs recorded from basal HCs at E12 using 2 mM BAPTA as in (A) for 80 s before (upper trace) and after (lower trace) bath application of 2.5 mM 4-AP. (C) SAPs recorded from a basal E12 HC using 10-mM pipette BAPTA for 80 s before (upper trace) and after (lower trace) addition of 2.5 mM 4-AP. Inhibition of the 4-AP-sensitve current promoted tonic firing. Moreover, the inhibitory effect of the 4-AP was attenuated using 10-mM pipette BAPTA. Thus, IA contributes towards the patterning of SAPs in developing HCs, and this effect may be Ca2+-dependent.
Figure 2. Changes in firing frequency versus intracellular BAPTA.
Summary histogram illustrating the changes in firing frequency with changes in pipette BAPTA concentrations. On average, the firing frequency declined as the concentration of BAPTA was increased.
Table 1. Summary data on the effects of position and intracellular Ca+2 buffering on spike width, and rate of change of voltage of the depolarizing and repolarizing phase of spikes at E12.
| Max left slope (dV/dt, V/s) | Max right slope (dV/dt, V/s) | Half width (ms) | ||||
| Control | 4-AP | Control | 4-AP | Control | 4-AP | |
| Apical 2 mM BAPTA | 6.9±0.7 | 2.9±1.9 | 6.4±0.6 | 4.2±1.8 | 6.3±0.4 | 4.4±1.5 |
| Basal 2 mM BAPTA | 5.9±0.3 | 5.9±0.8 | 5.9±0.2 | 5.8±0.7 | 5.9±0.2 | 4.2±2.6 |
| Basal 10 mM BAPTA | 15.9±1.2 | 15.6±1.1 | 5.9±0.7 | 5.9±0.7 | 9.9±1.5 | 10.1±1.5 |
Increase in intracellular buffering significantly affected the spike width, and rate of change of voltage of the depolarizing and repolarizing phases of spikes. The data is expressed as mean ± SD (n = 9 cells for each experiment).
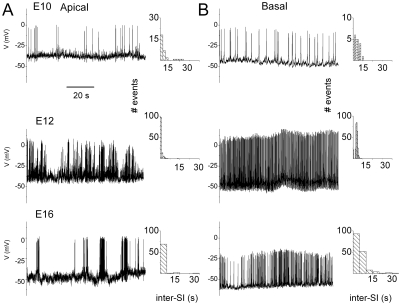
The structure of SAPs in developing HCs not only differs between apical and basal cells, but also varies at different developmental stages as shown in figure 3. Along the tonotopic axes, the general trend varied from phasic bursting apical cells to tonic bursting basal cells (Fig. 3). Thus, we reasoned that different kinetics and the magnitude of IA during development, and tonotopic expression of the current could, in part, be responsible for diverse spiking activity (Fig. 3).
Figure 3. Changes in the structure of spontaneous electrical activity in developing HCs.
Examples of the spontaneous activity recorded using perforated patch from apical (A) and basal (B) aspects of the developing chicken basilar papilla at E10, E12 and E16. The inter-spike interval distributions are shown.
IA is expressed at the earliest stages of HC development
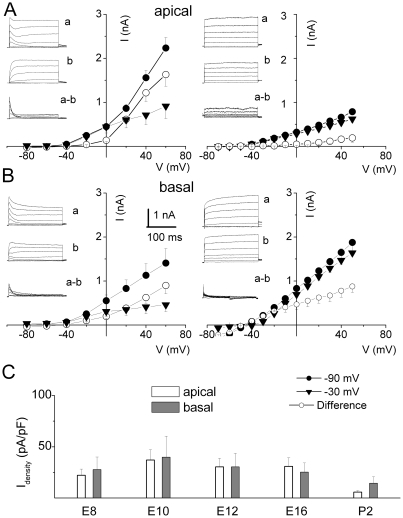
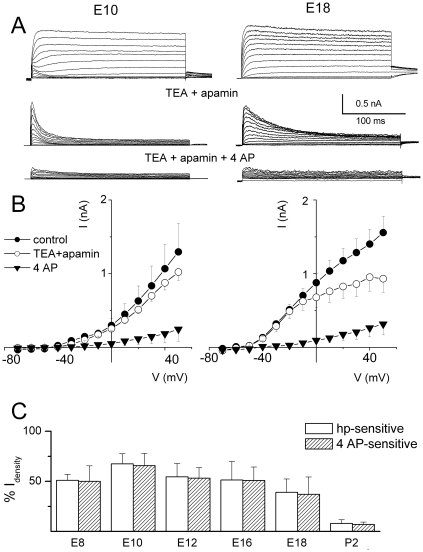
Previous studies have shown that Kv4.2 and Kv1.x channels are the presumptive channels that generate IA in chicken HCs. These channels were expressed, at the level of mRNA, at the earliest stages of development [48]{Sokolowski, 2004 #192, [49]}. However, functional studies in mature HCs showed that the current was limited to basal HCs [50], [51]. We determined the functional expression and kinetics of IA in HCs with respect to developmental age and position along the tonotopic axis. Figure 4 shows examples of whole-cell current profiles and current-voltage relations in HCs at the apical (Fig. 4A) and basal (Fig. 4B) aspects of the basilar papilla elicited from different holding potentials at E8-P2 (Fig. 4C; summary data). The transient component of the current was remarkably sensitive to holding voltages throughout development. The difference-current between current traces generated at a holding potential of −90 and −30 mV was the main transient component. The magnitude of the transient current plummeted as HCs matured (Fig. 4C), and the transient outward current was virtually absent in mature apical HCs. To ensure that the transient current was indeed IA, we examined the sensitivity of the current to 4-AP [50], [51]. A sizable portion (∼50% at E10) of the sustained component of the outward K+ current elicited from a holding potential of −90 mV was suppressed upon application of 20 mM TEA and 300 nM apamin in the bath, revealing a fast inactivating current that was sensitive to 2.5 mM 4-AP (Fig. 5A). Figure 5B illustrates the current-voltage relations at E10 and E18, and figure 5C shows the summary data, revealing a striking agreement between the magnitudes of the 4-AP- and holding potential-sensitive currents across different developmental stages of basal HCs. The result is in keeping with molecular biological evidence showing the expression of Kv4.2 channels in developing HCs [48].
Figure 4. The transient K+ currents displayed sensitivity towards holding potentials, and the magnitude changes during development.
(A–B) Examples of current traces recorded at E12 and P2 from HCs from apical and basal aspects of the basilar papilla. Current traces were elicited using 250-ms depolarizing voltage steps in 10-mV increments from −80 to 50 mV. For clarity, traces are shown in 20 mV increments. The holding potentials were −90 mV (a) and −30 mV (b). The difference in current (a–b) is shown as well. (A–B) Plots of the mean current-voltage relationships are shown, corresponding to changes in the magnitude of the transient current at different developmental stages. (C) Mean difference current density at +0 mV at apical and basal regions of the basilar papilla (pA/pF) at E8, E10, E12, E16, and P2. The holding potential-sensitive current density decreased during development. (E8, n = 4; E10, n = 7; E12, n = 16; E16, n = 5; P2, n = 9).
Figure 5. Holding potential-sensitive K+ currents are sensitive to 4-AP.
(A) An example of whole cell current recorded from apical HCs at E12 and E18 showing TEA and 4-AP-sensitive components, using the protocol described in Figure 1. (B) Mean peak current-voltage relationships are plotted below the traces. (E12, n = 11; E18, n = 5). (C) Histogram showing the holding potential-sensitive currents was similar in magnitude to the 4-AP-sensitive currents. Additionally, the magnitude of the holding potential- and 4-AP-sensitive current decreased with maturation (n = 6).
Changes in voltage-dependent activation and inactivation of IA during development
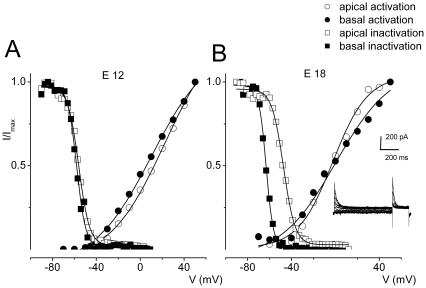
The voltage-dependence of the activation and inactivation of IA varied with age (Figure 6, Tables 2, 3, 4). Differences in voltage-dependent properties of IA between apical and basal HCs were stark at E18 compared to E12 (Fig. 6B). At E12, the V1/2 of the activation curve was ∼0.5 mV for apical and ∼−5.5 mV for basal cells. The half-activation voltage (V1/2) of inactivation was ∼−56 mV for apical and ∼−59 mV for basal cells. By E18, the transient outward current in basal HCs inactivated at more negative potentials than apical HCs (Figure 5B; Table 2). At E18, the V1/2 of inactivation was ∼−47 mV for apical and −63 mV for basal cells. Consistent with previous reports, the data suggest that as HCs mature, IA is mainly confined to cells at the basal aspects of the cochlea [50]–[52].
Figure 6. Voltage dependence of activation and inactivation of IA changes with maturation of HCs.
A–B The voltage-dependence of activation and inactivation of the transient current from HCs at apical and basal aspects of the basilar papilla at E12 and E18 were assessed. Steady-state inactivation properties of the transient current were determined by presenting pre-pulses of ∼1-sec duration, at different membrane potentials (−90 to −10 mV), followed by a test pulse at 0 mV for 300 ms (see inset for examples of current traces). The Boltzmann function fits for steady-state activation and inactivation are plotted with solid lines. The half activation (V1/2) and inactivation voltages as well as slope factors are summarized in Tables 2, 3, 4.
Table 2. Summary data on the effects of development and tonotopic position of HC-A-current activation and inactivation (V1/2 (mV), k (mV)) with 2 mM BAPTA in pipette solution.
| Activation | Inactivation | |||||||
| Apical | Basal | Apical | Basal | |||||
| Age | V1/2 | k | V1/2 | k | V1/2 | k | V1/2 | k |
| E12 | 0.5±1.1 | 25.4±2.5 | −5.5±3.6 | 26.6±3.2 | −56.0±0.2 | 4.9±0.2 | −59.2±0.9; | 4.8±0.9 |
| E18 | −0.5±2.1 | 25.5±7.3 | −2.4±2.1 | 15.8±2.1 | −47.3±0.3 | 5.2±0.3 | −63.0±0.2; | 3.3±0.2 |
Although there is a small difference in voltage dependence of inactivation between apical and basal region of the papilla, this difference becomes significant at more mature stages (n = 7 cells).
Table 3. Voltage dependence of activation (V1/2 (mV), k (mV)).
| 1 mM BAPTA | 2 mM BAPTA | 5 mM BAPTA | 10 mM BAPTA | 5 mM EGTA | 10 mM EGTA | |||||||
| Age | V1/2 | k | V1/2 | k | V1/2 | k | V1/2 | k | V1/2 | k | V1/2 | k |
| E12 | 0.6±1.9 | 22.8±1.4 | 0.5±1.1 | 25.4±2.5 | 8.9±2.6 | 25.1±1.8 | 23.1±5.7 | 24.5±1.9 | −0.8±0.4 | 16.3±2.5 | 23.3±4.3 | 25.3±2.6 |
| E18 | −3±0.9 | 22.1±0.9 | −10.1±0.8 | 16.9±0.9 | 7.1±1.4 | 22.9±1.0 | 6.5±0.7 | 20.9±0.6 | - | - | ||
The table compares the voltage dependence of the steady state activation at different stages of development and intracellular Ca2+ buffering. Increased buffering shifts the activation to more positive potentials (n = 8 cells).
Table 4. Voltage dependence of inactivation (V1/2 (mV), k (mV)).
| Age | 1 mM BAPTA | 2 mM BAPTA | 5 mM BAPTA | 10 mM BAPTA | ||||
| V1/2 | k | V1/2 | k | V1/2 | k | V1/2 | k | |
| E12 | −50.1±2.0 | 0.50±0.1 | −56.1±0.2 | 4.8±0.2 (a) | −52.3±0.2 | 3.9±0.2 | −48.4±0.5 | 2.6±0.7(a) |
| −57.5±0.3 | 4.3±0.3 | −59.2±0.9 | 8.1±0.9 (b) | −55.6±0.7 | 9.2±0.6(b) | |||
| E16 | - | −59.1±2.1 | 4.1±2.2 | −57.1±0.1 | 3.3±0.1 | −52.5±0.7 | 2.2±0.5(a) | |
| 53.4±8.1 | 1.5±3.5(b) | |||||||
| E18 | - | −55.7±0.3; | 4.2±0.3 (a) | −46.2±0.7 | 3.3±0.4 (a) | −48.9±1.4 | 1.6±1.2(a) | |
| −63.1±0.2 | 3.4±0.2 (b) | −47.4±0.4 | 5.2±0.4 (b) | |||||
The table illustrates a comparison of voltage dependence of steady-state inactivation at different stages of development and the concentrations of intracellular Ca2+ buffer. Increased buffering shifts the activation to more positive potential (a = apical, b = basal hair cells; n = 7).
Changes in Ca2+ I buffering have a profound effect on IA
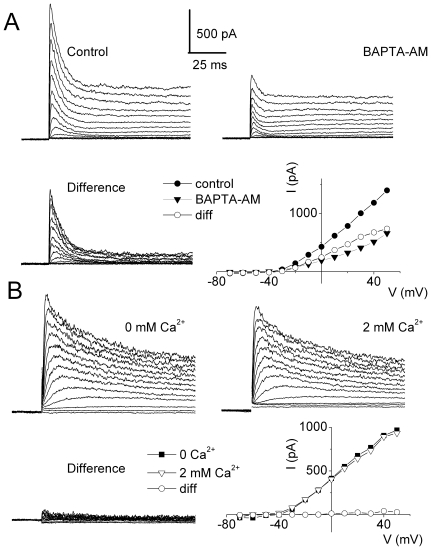
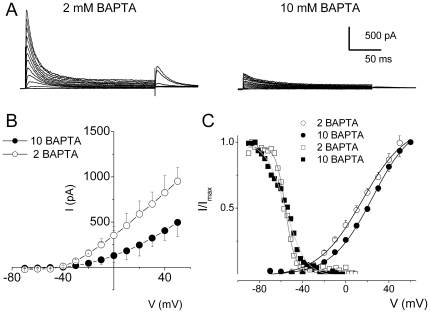
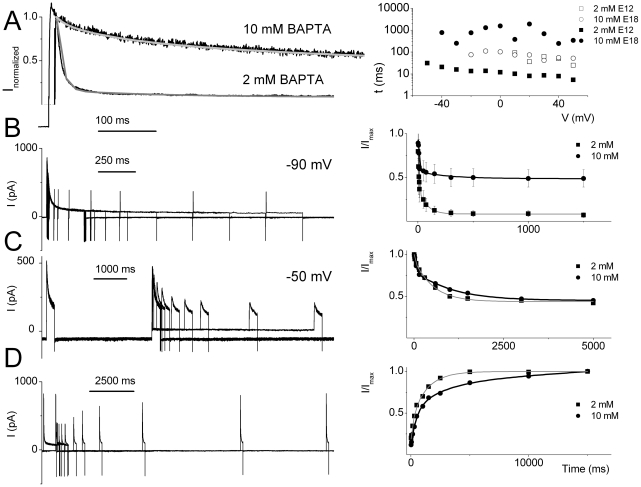
To examine the underlying mechanisms for the BAPTA-induced 4-AP-insensitivity to SAPs described in figure 1, we tested IA sensitivity to acute changes in Ca2+ chelators. We used BAPTA-AM, a selective Ca2+ chelator that is the cell-permeable analog of BAPTA. Application of 5 mM BAPTA-AM to basal HCs produced a marked reduction of the transient K+ current (Fig. 7A). Moreover, raising the external Ca2+ from 0 to 2 mM had no effect on the transient current (Fig. 7B), hinting that Ca2+ entry via Ca2+ channels may not be sufficient to affect IA. Rather, the release of Ca2+ i may be the Ca2+ source to alter IA. We probed the Ca2+-dependence of IA further by examining the voltage- and time-dependent properties of the current using varying concentrations of BAPTA (Tables 3, 4, 5). Figure 8 illustrates the effects of 2 and 10 mM intracellular BAPTA on IA in an apical E12 HC. Reducing the available Ca2+ I by using 10 mM pipette BAPTA produced a significant shift in the voltage-sensitivity of activation. The V1/2s of the steady-state activation were (in mV) ∼0 and 23 using (in mM) 2 and 10 BAPTA, respectively. Moreover the V1/2s of the steady-state inactivation were ∼−56 mV and −48 mV using (in mM) 2 and 10 BAPTA, respectively. Additionally, we examined the time-dependence of the development of inactivation after varying durations at −50 mV and −90 mV. The time constants of inactivation (τI) were compared at different stages of development and with respect to different concentrations of Ca2+ I buffer (Table 5). At all developmental stages tested (E12–E18), the kinetics of decay of the current were fitted with two τs. As shown in figure 9, the use of different concentrations of BAPTA had a marked effect on the amplitude and inactivation kinetics of IA. For example, for an apical E12 HC, the amplitude of the current measured at +40 mV was ∼825 pA in 2 mM BAPTA and ∼405 pA in 10 mM BAPTA. Moreover, inactivation time constants (τIs) of IA were ∼5 ms and 75 ms, using 2 mM BAPTA. Using 10 mM BAPTA the τs were ∼75 ms and 300 ms (Fig. 9A). Similarly, the time dependence of development and recovery from inactivation were duly affected (Figs. 9B–D). Whereas the current shows complete inactivation within ∼75 ms, using 2 mM BAPTA, the time constant of inactivation was prolonged by ∼ 4-fold (∼300 ms) in the presence of 10 mM BAPTA (Figure 9C). Meanwhile, the current recovered from inactivation with a time constant of ∼450 ms in 2 mM BAPTA and ∼1200 ms in 10 mM BAPTA (Fig. 9D). The results clearly suggest that the 4-AP-sensitive current is regulated tightly by Ca2+ i.
Figure 7. IA is sensitivity to Ca2+ I buffering.
(A) Examples of current traces recorded from different apical HCs at E14 using 1 mM pipette BAPTA in the presence of 20 mM TEA and 200 nM apamin in the bath solution before and 30 mins after application of bath solution containing 5 mM BAPTA-AM. The difference-current traces are shown. An increase in Ca2+ I buffering altered the transient K+ current. The current-voltage relationship is shown. (B) Examples of currents recorded from apical HCs at E14 in the presence of 20 mM TEA and 200 nM apamin before and after application of a bath solution containing 2 mM Ca2+, as well as the difference current. The currents were elicited with the same protocol as described in Figure 1. The plot shows the current-voltage relationship.
Table 5. Comparison of the time constants (τ) of decay at different stages of development and with respect to different concentrations of Ca2+ I buffer.
| Age | 2 mM BAPTA | τ (ms) | 10 mM BAPTA | τ (ms) |
| τ | τ2 | τ1 | τ2 | |
| E12 | 5 | 75 | 60 | 298 |
| E16 | 30 | 250 | 40 | 230 |
| E18 | 50 | 600 | 50 | 700 |
At all developmental stages tested (E12–E18), the kinetics of decay of the current were fitted with two time constants.
Figure 8. The voltage-dependent activation and inactivation of IA and availability of Ca2+ I.
(A) Current traces recorded from apical HCs at E12 using pipette BAPTA concentrations, 2 (left panel) and 10 mM (right panel) BAPTA. (B) Mean current-voltage relationship for data obtained for the two conditions (2 and 10 mM pipette BAPTA; n = 9). (C) The voltage-dependence of activation and inactivation of the transient K+ current from E12 apical HCs using 2 and 10 mM pipette BAPTA. Steady state inactivation properties of the transient current were determined using the protocol described in Figure 6. Steady-state activation and inactivation of the currents were determined as in Figure 6. The Boltzmann function fits are shown in solid lines. Half-activation voltages were (in mV) 0.5±1.1 and 33.1±5.7 for 2, and 10 mM BAPTA, respectively. The maximum slope factors (k) were (in mV): 25.4±2.5 and 24.5±1.9 (n = 9 cells) for 2 and 10 mM BAPTA, respectively. The half-inactivation voltages were (in mV) −56.1±0.2 and −48.4±0.5 for 2, and 10 mM BAPTA, respectively. The maximum slope factors (k) were 4.8±0.2 and 2.6±0.7 (n = 9 cells) for 2, and 10 mM BAPTA, respectively. Notice the currents' activation and inactivation is shifted to more positive potentials with increased Ca2+ buffering (see Tables 4).
Figure 9. Kinetics of inactivation of IA in the developing HCs is affected by Ca2+ I availability.
(A) Normalized current traces elicited using ∼1 s pulse for E12 cells using 2 mM (dark gray line) and 10 mM BAPTA (light gray line) in the pipette (Left). The fast components of decay were eliminated with increased BAPTA as well as with maturation. Holding potential was −90 mV and voltage steps were in 10 mV increments. Current decay could be best fitted with two different time constants (τ) at all stages of development. The time constants were prolonged with an increase in intracellular BAPTA as well as with maturation [τs (in ms) for E12, using 2 mM BAPTA were: 5±3, and 75±13 (n = 11 cells); τs for 10 mM BAPTA were 67±3, and 498±13 (n = 10 cells) and for E18: 52±13, and 611±25 (n = 7 cells)]. For the example shown at E12, the exponential fits yielded τ1 = 5 ms and τ2 = 70 ms for 2 mM BAPTA. The current traces illustrated from the E18 HCs were fitted with τ1 = 50 ms and τ2 = 600 ms. See Table 4 of summary data. (B) The time course of the development of inactivation at −90 mV (Left) and the τs of development of inactivation were determined (Right) for current traces recorded at E12 for 2 mM BAPTA and 10 mM BAPTA [τs for 2 BAPTA: 5.2±2.3, 75.2±28.8 (n = 8 cells); τ for 10 BAPTA: 8.7±4.1 ms; 289±32.9 (n = 8 cells)]. (C) Examples of traces generated to examine the time course of the development of inactivation at −50 mV for E12 currents. An example of such protocol on an E12 cell is shown (Left). The exponential fits to the data are shown on the right; τs (in ms) for E12: 515±161 using 2 mM BAPTA and 997±203 ms using 10 mM BAPTA in the pipette (n = 6 cells). (D) To estimate how quickly the current recovered from inactivation, we measured recovery kinetics after 1-second at the holding potential of −90 mV, using standard recovery time protocol. We measured the amplitude of the transient potassium currents by depolarizing to a fixed potential after variable time at −90 mV. Amplitude of these currents was normalized to the amplitude of the currents activated from −90 mV and plotted against the duration of steps to −90 mV. Examples of traces generated to examine the time course of the recovery from inactivation for E12 currents (Left). The right panel shows the time course and the exponential fits [Fits in solid lines, ts for E12: 446±56 ms using 2 mM BAPTA and 1286±78 ms using 10 mM BAPTA in the pipette (n = 5 cells)]. Amplitude of the currents was normalized to the amplitude of the currents activated from a holding potential of −90 mV and plotted against the duration of step to −90 mV.
Discussion
The transient outward K+ current (IA) in the developing chicken HC was identified functionally by Murrow (1994) and Griguer and Fuchs (1996) [51], [53] and the molecular characteristics were revealed later [48] {Rajeevan, 1999 #193, [52]}. Moreover, the short and long-term modulation of IA in developing chicken HC is unknown, despite the currents purported role in spike timing in SAPs. Also important, roles of IA and its regulation and the ensuing effects on the structure of SAPs in developing HCs are unclear. This study fills in major gaps in our understanding of the patterning of SAPs in HCs. Our findings include; 1) IA contributes towards the patterning of SAPs. Since the current dictates the spike timing and firing pattern, it is conceivable to suggest that it may regulate the release of neurotransmitters in the developing cochlea to sculpt synapse formation. 2) Expression of IA is regulated developmentally and tonotopically. At the apical aspects of the basilar papilla the expression of IA is prominent only in early development. By contrast, IA persists in HCs at the basal aspects of the matured basilar papilla. 3) Alterations of Ca2+ I by Ca2+ buffers produced marked effects on the functional expression, voltage-dependence and kinetics of IA. Increased concentrations of the Ca2+ I buffer, BAPTA shifted the voltage-dependence of activation and inactivation to more positive potentials and reduced the number of functional channels expressed. These findings reaffirm the tight interplay that occurs between Ca2+ I, and K+ currents.
Suppression of IA visibly alters spike timing and frequency, transforming phasic action potential burst into tonic firing in spontaneously active chicken HCs. The results are reminiscent of the effects of a transient outward current in the developing mouse HC [16]. However, after increased Ca2+ buffer, not only did the phasic patterning of spikes appear tonic, but also suppression of IA had no effect on the firing pattern, raising the possibility that reduced Ca2+ I could stifle the availability of IA. The deduced amino acid sequence of the α-subunits of Kv1.2, Kv1.3 and Kv1.5 and the auxiliary subunit, Kvβ1 that confer A-type transient current reveals multiple putative phosphorylation sites at the N- and C-termini [48] {Rajeevan, 1999 #193 [52], [54]}. Indeed, several of these potential regulatory sites and the second messengers involved have been demonstrated to be Ca2+-dependent. For example, there is a Src tyrosine kinase proline-rich binding site at the N-terminal of Kv1.5 that confers Ca2+-dependent modulation of the kinetics and voltage-dependent activation of transient K+ currents in Schwann cells [55], [56]. Alternatively, it is conceivable that the presences of multiple potential Ca2+-dependent regulatory sites at the C-terminus of the channel and other interacting partners that form the channel complex could affect the localization, expression and specific functional properties of the native K+ conductance, as observed in cardiac myocytes and neurons [57]–[63].
Ca2+ handling in the developing chicken basilar papilla may undergo marked plasticity to account for varying demands for the expression of Ca2+-dependent processes and increased Ca2+ influx through increased transduction channel numbers [64]. For example the expression of the mobile Ca2+ buffer, calbindin, is regulated during development and along the tonotopic axis of the cochlear in accordance with the demands' of Ca2+ regulation [64]. Similar assortments of Ca2+ regulation can be seen in the apico-basal gradient of the basilar papilla [65]. The differential and increased expression of Ca2+ buffers during development dovetails well with the expression pattern of Ca2+ buffers [64]. In keeping with the expression pattern of Ca2+ buffers in HCs of the developing basilar papilla and our findings, the kinetics and voltage-dependence of IA are expected to be altered. Voltage dependence of the activation and inactivation of IA are shifted to more positive potentials with increased Ca2+ buffers. Throughout development, basal HCs express IA of faster kinetics of inactivation than at the apical aspects of the basilar papilla. Moreover, with maturation this difference is magnified as apical HCs lose the transient component of K+ currents. At the basal aspects, the ratio of IA to the total outward K+ current is diminished with maturation. Whereas these findings are in accordance with changes in Ca2+ handling in the chicken basilar papilla, they are in stark contrast to reports on the expression of 4-AP sensitive current, presumably IA, in the developing mouse HC, where the expression of the current increases with development and persists in mature HCs [16], [66]. Together, our data demonstrates that reduction of Ca2+ I availability has profound effects not only on the kinetics of IA and the number of channels expressed in HCs, but also on the ensuing SAP, which is sculpted by the current.
Acknowledgments
We thank Dr. N. Chiamvimonvat and members of our laboratory for their comments on the initial draft of the manuscript.
Footnotes
Competing Interests: The authors have declared that no competing interests exist.
Funding: This work was supported by the National Institutes of Health (NIH) DC003826. The funders had no role in study design, data collection and analysis, decision to publish, or preparation of the manuscript.
References
- 1.Zhang LI, Poo M-m. Electrical activity and development of neural circuits. Nat Neurosci. 2001 doi: 10.1038/nn753. [DOI] [PubMed] [Google Scholar]
- 2.Moody WJ, Bosma MM. Ion channel development, spontaneous activity, and activity-dependent development in nerve and muscle cells. Physiol Rev. 2005;85:883–941. doi: 10.1152/physrev.00017.2004. [DOI] [PubMed] [Google Scholar]
- 3.Katz LC, Shatz CJ. Synaptic activity and the construction of cortical circuits. Science. 1996;274:1133–1138. doi: 10.1126/science.274.5290.1133. [DOI] [PubMed] [Google Scholar]
- 4.Blankenship AG, Feller MB. Mechanisms underlying spontaneous patterned activity in developing neural circuits. Nat Rev Neurosci. 2010;11:18–29. doi: 10.1038/nrn2759. [DOI] [PMC free article] [PubMed] [Google Scholar]
- 5.Abitbol I, Peretz A, Lerche C, Busch AE, Attali B. Stilbenes and fenamates rescue the loss of I(KS) channel function induced by an LQT5 mutation and other IsK mutants. EMBO J. 1999;18:4137–4148. doi: 10.1093/emboj/18.15.4137. [DOI] [PMC free article] [PubMed] [Google Scholar]
- 6.Worley PF, Bhat RV, Baraban JM, Erickson CA, McNaughton BL, et al. Thresholds for synaptic activation of transcription factors in hippocampus: correlation with long-term enhancement. J Neurosci. 1993;13:4776–4786. doi: 10.1523/JNEUROSCI.13-11-04776.1993. [DOI] [PMC free article] [PubMed] [Google Scholar]
- 7.Fields RD, Itoh K. Neural cell adhesion molecules in activity-dependent development and synaptic plasticity. Trends Neurosci. 1996;19:473–480. doi: 10.1016/S0166-2236(96)30013-1. [DOI] [PubMed] [Google Scholar]
- 8.Johnson SL, Adelman JP, Marcotti W. Genetic deletion of SK2 channels in mouse inner hair cells prevents the developmental linearization in the Ca2+ dependence of exocytosis. The Journal of Physiology. 2007;583:631–646. doi: 10.1113/jphysiol.2007.136630. [DOI] [PMC free article] [PubMed] [Google Scholar]
- 9.Levic S, Nie L, Tuteja D, Harvey M, Sokolowski BH, et al. Development and regeneration of hair cells share common functional features. Proc Natl Acad Sci U S A. 2007;104:19108–19113. doi: 10.1073/pnas.0705927104. [DOI] [PMC free article] [PubMed] [Google Scholar]
- 10.Kros CJ, Ruppersberg JP, Rüsch A. Expression of a potassium current in inner hair cells during development of hearing in mice. Nature. 1998;394:281–284. doi: 10.1038/28401. [DOI] [PubMed] [Google Scholar]
- 11.Beutner D, Moser T. The Presynaptic Function of Mouse Cochlear Inner Hair Cells during Development of Hearing. The Journal of Neuroscience. 2001;21:4593–4599. doi: 10.1523/JNEUROSCI.21-13-04593.2001. [DOI] [PMC free article] [PubMed] [Google Scholar]
- 12.Glowatzki E, Fuchs PA. Transmitter release at the hair cell ribbon synapse. Nat Neurosci. 2002;5:147–154. doi: 10.1038/nn796. [DOI] [PubMed] [Google Scholar]
- 13.Marcotti W, Johnson SL, Rusch A, Kros CJ. Sodium and calcium currents shape action potentials in immature mouse inner hair cells. J Physiol. 2003;552:743–761. doi: 10.1113/jphysiol.2003.043612. [DOI] [PMC free article] [PubMed] [Google Scholar]
- 14.Brandt N, Kuhn S, Münkner S, Braig C, Winter H, et al. Thyroid Hormone Deficiency Affects Postnatal Spiking Activity and Expression of Ca2+ and K+ Channels in Rodent Inner Hair Cells. The Journal of Neuroscience. 2007;27:3174–3186. doi: 10.1523/JNEUROSCI.3965-06.2007. [DOI] [PMC free article] [PubMed] [Google Scholar]
- 15.Born DE, Rubel EW. Afferent influences on brain stem auditory nuclei of the chicken: neuron number and size following cochlea removal. J Comp Neurol. 1985;231:435–445. doi: 10.1002/cne.902310403. [DOI] [PubMed] [Google Scholar]
- 16.Marcotti W, Johnson SL, Holley MC, Kros CJ. Developmental changes in the expression of potassium currents of embryonic, neonatal and mature mouse inner hair cells. J Physiol. 2003;548:383–400. doi: 10.1113/jphysiol.2002.034801. [DOI] [PMC free article] [PubMed] [Google Scholar]
- 17.Saunders JC, Adler HJ, Cohen YE, Smullen S, Kazahaya K. Morphometric changes in the chick nucleus magnocellularis following acoustic overstimulation. J Comp Neurol. 1998;390:412–426. [PubMed] [Google Scholar]
- 18.Jones TA, Jones SM, Paggett KC. Primordial Rhythmic Bursting in Embryonic Cochlear Ganglion Cells. The Journal of Neuroscience. 2001;21:8129–8135. doi: 10.1523/JNEUROSCI.21-20-08129.2001. [DOI] [PMC free article] [PubMed] [Google Scholar]
- 19.Jones TA, Jones SM, Paggett KC. Emergence of Hearing in the Chicken Embryo. J Neurophysiol. 2006;96:128–141. doi: 10.1152/jn.00599.2005. [DOI] [PubMed] [Google Scholar]
- 20.Lippe WR. Rhythmic spontaneous activity in the developing avian auditory system. J Neurosci. 1994;14:1486–1495. doi: 10.1523/JNEUROSCI.14-03-01486.1994. [DOI] [PMC free article] [PubMed] [Google Scholar]
- 21.Johnson SL, Eckrich T, Kuhn S, Zampini V, Franz C, et al. Position-dependent patterning of spontaneous action potentials in immature cochlear inner hair cells. Nat Neurosci. 2011;14:711–717. doi: 10.1038/nn.2803. [DOI] [PMC free article] [PubMed] [Google Scholar]
- 22.Kandler K, Clause A, Noh J. Tonotopic reorganization of developing auditory brainstem circuits. Nat Neurosci. 2009;12:711–717. doi: 10.1038/nn.2332. [DOI] [PMC free article] [PubMed] [Google Scholar]
- 23.Tritsch NX, Rodriguez-Contreras A, Crins TTH, Wang HC, Borst JGG, et al. Calcium action potentials in hair cells pattern auditory neuron activity before hearing onset. Nat Neurosci. 2010;13:1050–1052. doi: 10.1038/nn.2604. [DOI] [PMC free article] [PubMed] [Google Scholar]
- 24.Kennedy HJ, Meech RW. Fast Ca2+ signals at mouse inner hair cell synapse: a role for Ca2+-induced Ca2+ release. J Physiol. 2002;539:15–23. doi: 10.1113/jphysiol.2001.013171. [DOI] [PMC free article] [PubMed] [Google Scholar]
- 25.Tritsch NX, Bergles DE. Developmental Regulation of Spontaneous Activity in the Mammalian Cochlea. The Journal of Neuroscience. 2010;30:1539–1550. doi: 10.1523/JNEUROSCI.3875-09.2010. [DOI] [PMC free article] [PubMed] [Google Scholar]
- 26.Alladi PA, Roy T, Singh N, Wadhwa S. Developmentally regulated expression of c-Fos and c-Jun in the brainstem auditory nuclei of Gallus domesticus is modified by prenatal auditory enrichment. J Neurobiol. 2005;62:92–105. doi: 10.1002/neu.20071. [DOI] [PubMed] [Google Scholar]
- 27.Alladi PA, Roy T, Singh N, Wadhwa S. Prenatal auditory enrichment with species-specific calls and sitar music modulates expression of Bcl-2 and Bax to alter programmed cell death in developing chick auditory nuclei. Int J Dev Neurosci. 2005;23:363–373. doi: 10.1016/j.ijdevneu.2004.12.009. [DOI] [PubMed] [Google Scholar]
- 28.Greenberg ME, Ziff EB, Greene LA. Stimulation of neuronal acetylcholine receptors induces rapid gene transcription. Science. 1986;234:80–83. doi: 10.1126/science.3749894. [DOI] [PubMed] [Google Scholar]
- 29.Spitzer NC. Activity-dependent neuronal differentiation prior to synapse formation: the functions of calcium transients. J Physiol Paris. 2002;96:73–80. doi: 10.1016/s0928-4257(01)00082-1. [DOI] [PubMed] [Google Scholar]
- 30.West AE, Chen WG, Dalva MB, Dolmetsch RE, Kornhauser JM, et al. Calcium regulation of neuronal gene expression. Proc Natl Acad Sci U S A. 2001;98:11024–11031. doi: 10.1073/pnas.191352298. [DOI] [PMC free article] [PubMed] [Google Scholar]
- 31.Baxter DA, Byrne JH. Ionic conductance mechanisms contributing to the electrophysiological properties of neurons. Curr Opin Neurobiol. 1991;1:105–112. doi: 10.1016/0959-4388(91)90017-2. [DOI] [PubMed] [Google Scholar]
- 32.Connor JA, Stevens CF. Voltage clamp studies of a transient outward membrane current in gastropod neural somata. J Physiol. 1971;213:21–30. doi: 10.1113/jphysiol.1971.sp009365. [DOI] [PMC free article] [PubMed] [Google Scholar]
- 33.Llinas RR. The intrinsic electrophysiological properties of mammalian neurons: insights into central nervous system function. Science. 1988;242:1654–1664. doi: 10.1126/science.3059497. [DOI] [PubMed] [Google Scholar]
- 34.Wang L, Duff HJ. Developmental changes in transient outward current in mouse ventricle. Circ Res. 1997;81:120–127. doi: 10.1161/01.res.81.1.120. [DOI] [PubMed] [Google Scholar]
- 35.Dukes ID, Morad M. The transient K+ current in rat ventricular myocytes: evaluation of its Ca2+ and Na+ dependence. J Physiol. 1991;435:395–420. doi: 10.1113/jphysiol.1991.sp018516. [DOI] [PMC free article] [PubMed] [Google Scholar]
- 36.Park SY, Choi JY, Kim RU, Lee YS, Cho HJ, et al. Downregulation of voltage-gated potassium channel alpha gene expression by axotomy and neurotrophins in rat dorsal root ganglia. Mol Cells. 2003;16:256–259. [PubMed] [Google Scholar]
- 37.Perrier E, Perrier R, Richard S, Benitah JP. Ca2+ controls functional expression of the cardiac K+ transient outward current via the calcineurin pathway. J Biol Chem. 2004;279:40634–40639. doi: 10.1074/jbc.M407470200. [DOI] [PubMed] [Google Scholar]
- 38.Schrader LA, Ren Y, Cheng F, Bui D, Sweatt JD, et al. Kv4.2 is a locus for PKC and ERK/MAPK cross-talk. Biochem J. 2009;417:705–715. doi: 10.1042/BJ20081213. [DOI] [PMC free article] [PubMed] [Google Scholar]
- 39.Varga AW, Yuan LL, Anderson AE, Schrader LA, Wu GY, et al. Calcium-calmodulin-dependent kinase II modulates Kv4.2 channel expression and upregulates neuronal A-type potassium currents. J Neurosci. 2004;24:3643–3654. doi: 10.1523/JNEUROSCI.0154-04.2004. [DOI] [PMC free article] [PubMed] [Google Scholar]
- 40.Dupont G, Dumollard R. Simulation of calcium waves in ascidian eggs: insights into the origin of the pacemaker sites and the possible nature of the sperm factor. J Cell Sci. 2004;117:4313–4323. doi: 10.1242/jcs.01278. [DOI] [PubMed] [Google Scholar]
- 41.Hofer T, Venance L, Giaume C. Control and plasticity of intercellular calcium waves in astrocytes: a modeling approach. J Neurosci. 2002;22:4850–4859. doi: 10.1523/JNEUROSCI.22-12-04850.2002. [DOI] [PMC free article] [PubMed] [Google Scholar]
- 42.Venance L, Stella N, Glowinski J, Giaume C. Mechanism involved in initiation and propagation of receptor-induced intercellular calcium signaling in cultured rat astrocytes. J Neurosci. 1997;17:1981–1992. doi: 10.1523/JNEUROSCI.17-06-01981.1997. [DOI] [PMC free article] [PubMed] [Google Scholar]
- 43.Wagner J, Fall CP, Hong F, Sims CE, Allbritton NL, et al. A wave of IP3 production accompanies the fertilization Ca2+ wave in the egg of the frog, Xenopus laevis: theoretical and experimental support. Cell Calcium. 2004;35:433–447. doi: 10.1016/j.ceca.2003.10.009. [DOI] [PubMed] [Google Scholar]
- 44.Hamburger V, Hamilton HL. A series of normal stages in the development of the chick embryo. 1951. Dev Dyn. 1992;195:231–272. doi: 10.1002/aja.1001950404. [DOI] [PubMed] [Google Scholar]
- 45.Neher E. Correction for liquid junction potentials in patch clamp experiments. Methods Enzymol. 1992;207:123–131. doi: 10.1016/0076-6879(92)07008-c. [DOI] [PubMed] [Google Scholar]
- 46.Marcotti W, Johnson SL, Kros CJ. Effects of intracellular stores and extracellular Ca(2+) on Ca(2+)-activated K(+) currents in mature mouse inner hair cells. J Physiol. 2004;557:613–633. doi: 10.1113/jphysiol.2003.060137. [DOI] [PMC free article] [PubMed] [Google Scholar]
- 47.Moser T, Brandt A, Lysakowski A. Hair cell ribbon synapses. Cell Tissue Res. 2006;326:347–359. doi: 10.1007/s00441-006-0276-3. [DOI] [PMC free article] [PubMed] [Google Scholar]
- 48.Duzhyy DE, Sakai Y, Sokolowski BH. Cloning and developmental expression of Shaker potassium channels in the cochlea of the chicken. Brain Res Mol Brain Res. 2004;121:70–85. doi: 10.1016/j.molbrainres.2003.10.022. [DOI] [PubMed] [Google Scholar]
- 49.Rajeevan MS, Hu S, Sakai Y, Sokolowski BH. Cloning and expression of Shaker alpha- and beta-subunits during inner ear development. Brain Res Mol Brain Res. 1999;66:83–93. doi: 10.1016/s0169-328x(99)00012-1. [DOI] [PubMed] [Google Scholar]
- 50.Fuchs PA, Evans MG. Potassium currents in hair cells isolated from the cochlea of the chick. J Physiol. 1990;429:529–551. doi: 10.1113/jphysiol.1990.sp018271. [DOI] [PMC free article] [PubMed] [Google Scholar]
- 51.Murrow BW. Position-dependent expression of potassium currents by chick cochlear hair cells. J Physiol. 1994;480(Pt 2):247–259. doi: 10.1113/jphysiol.1994.sp020357. [DOI] [PMC free article] [PubMed] [Google Scholar]
- 52.Sokolowski BH, Sakai Y, Harvey MC, Duzhyy DE. Identification and localization of an arachidonic acid-sensitive potassium channel in the cochlea. J Neurosci. 2004;24:6265–6276. doi: 10.1523/JNEUROSCI.1291-04.2004. [DOI] [PMC free article] [PubMed] [Google Scholar]
- 53.Griguer C, Fuchs PA. Voltage-dependent potassium currents in cochlear hair cells of the embryonic chick. J Neurophysiol. 1996;75:508–513. doi: 10.1152/jn.1996.75.1.508. [DOI] [PubMed] [Google Scholar]
- 54.Sewing S, Roeper J, Pongs O. Kv beta 1 subunit binding specific for shaker-related potassium channel alpha subunits. Neuron. 1996;16:455–463. doi: 10.1016/s0896-6273(00)80063-x. [DOI] [PubMed] [Google Scholar]
- 55.Peretz A, Sobko A, Attali B. Tyrosine kinases modulate K+ channel gating in mouse Schwann cells. J Physiol. 1999;519 Pt 2:373–384. doi: 10.1111/j.1469-7793.1999.0373m.x. [DOI] [PMC free article] [PubMed] [Google Scholar]
- 56.Holmes TC, Fadool DA, Ren R, Levitan IB. Association of Src tyrosine kinase with a human potassium channel mediated by SH3 domain. Science. 1996;274:2089–2091. doi: 10.1126/science.274.5295.2089. [DOI] [PubMed] [Google Scholar]
- 57.Birnbaum SG, Varga AW, Yuan LL, Anderson AE, Sweatt JD, et al. Structure and function of Kv4-family transient potassium channels. Physiol Rev. 2004;84:803–833. doi: 10.1152/physrev.00039.2003. [DOI] [PubMed] [Google Scholar]
- 58.An WF, Bowlby MR, Betty M, Cao J, Ling HP, et al. Modulation of A-type potassium channels by a family of calcium sensors. Nature. 2000;403:553–556. doi: 10.1038/35000592. [DOI] [PubMed] [Google Scholar]
- 59.Suko J, Maurer-Fogy I, Plank B, Bertel O, Wyskovsky W, et al. Phosphorylation of serine 2843 in ryanodine receptor-calcium release channel of skeletal muscle by cAMP-, cGMP- and CaM-dependent protein kinase. Biochim Biophys Acta. 1993;1175:193–206. doi: 10.1016/0167-4889(93)90023-i. [DOI] [PubMed] [Google Scholar]
- 60.Jahn H, Nastainczyk W, Rohrkasten A, Schneider T, Hofmann F. Site-specific phosphorylation of the purified receptor for calcium-channel blockers by cAMP- and cGMP-dependent protein kinases, protein kinase C, calmodulin-dependent protein kinase II and casein kinase II. Eur J Biochem. 1988;178:535–542. doi: 10.1111/j.1432-1033.1988.tb14480.x. [DOI] [PubMed] [Google Scholar]
- 61.Cai SQ, Li W, Sesti F. Multiple modes of a-type potassium current regulation. Curr Pharm Des. 2007;13:3178–3184. doi: 10.2174/138161207782341286. [DOI] [PubMed] [Google Scholar]
- 62.Harootunian AT, Kao JP, Paranjape S, Tsien RY. Generation of calcium oscillations in fibroblasts by positive feedback between calcium and IP3. Science. 1991;251:75–78. doi: 10.1126/science.1986413. [DOI] [PubMed] [Google Scholar]
- 63.Rebecchi MJ, Pentyala SN. Structure, function, and control of phosphoinositide-specific phospholipase C. Physiol Rev. 2000;80:1291–1335. doi: 10.1152/physrev.2000.80.4.1291. [DOI] [PubMed] [Google Scholar]
- 64.Hiel H, Navaratnam DS, Oberholtzer JC, Fuchs PA. Topological and developmental gradients of calbindin expression in the chick's inner ear. J Assoc Res Otolaryngol. 2002;3:1–15. doi: 10.1007/s101620010071. [DOI] [PMC free article] [PubMed] [Google Scholar]
- 65.Ricci AJ, Fettiplace R. The effects of calcium buffering and cyclic AMP on mechano-electrical transduction in turtle auditory hair cells. J Physiol. 1997;501(Pt 1):111–124. doi: 10.1111/j.1469-7793.1997.111bo.x. [DOI] [PMC free article] [PubMed] [Google Scholar]
- 66.Housley GD, Marcotti W, Navaratnam D, Yamoah EN. Hair cells–beyond the transducer. J Membr Biol. 2006;209:89–118. doi: 10.1007/s00232-005-0835-7. [DOI] [PubMed] [Google Scholar]


