Abstract
Objective
Reports in humans advocate a link between hypoglycemia and altered mood. Such observations, however, have not been mechanistically explored. Here we examined depressive-like behaviors in mice resulting from acute hypoglycemia.
Materials/Methods
Mice were fasted for 12 h then administered intraperitoneal (IP) insulin to induce a blood glucose nadir of 50 mg/dl at 0.75 h after injection which by 2 h post-injection had returned to normal. The behaviors of locomotion, forced swim, saccharin preference and novel object recognition were subsequently examined.
Results
Mice made hypoglycemic showed depressive-like behaviors 24 h after resolution of hypoglycemia as evidenced by increased immobility in the forced swim test (FST) and reduced saccharin preference. Movement and memory were not impacted by hypoglycemia 24 h after its resolution. By 48 h post hypoglycemia, depressive-like behaviors resolved. In contrast, neither peripheral insulin administration without resultant hypoglycemia nor intracerebroventricular (ICV) insulin administration altered performance in the FST. The antidepressants fluoxetine and desipramine prevented hypoglycemia-induced immobility in the FST as did the anti-adrenergic agents phentolamine, metoprolol and butoxamine. Epinephrine and norepinephrine administration caused increased immobility in the FST at 24 h post administration which subsequently resolved by 48 h.
Conclusions
These data indicate that in mice acute hypoglycemia through adrenergic pathways caused depressive-like behaviors that exist well beyond the resolution of hypoglycemia.
Keywords: insulin, forced swim test, saccharin preference test, antidepressants, catecholamines
Introduction
Hypoglycemia is the most common side effect of insulin treatment (1,2). While much is known about the acute features of insulin-induced hypoglycemia, especially as related to neuroglycopenia (3), little is known about the non-cognitive brain-based complications of hypoglycemia. Studies by Gold et al. in the early 1990’s reported changes in mood during the course of insulin-induced hypoglycemia (4,5). Gold et al. found that in healthy volunteers acute hypoglycemia caused negative mood states including tense-tiredness, a reduction in hedonic tone, an increase in tense arousal and a decrease in energetic arousal that lasted for at least 30 min after return to euglycemia (5). Curiously, limited work has been done in this area since, despite hypoglycemia remaining a considerable barrier to the use of insulin therapy in diabetes (6,7). In contrast, cognitive decline and depression associated with diabetes has generated considerable interest (8,9) and diabetes-associated neurodegeneration, particularly Alzheimer’s disease-type neurodegeneration has been coined by some as “type 3 diabetes” (10).
Conceptually, a link between hypoglycemia and depression seems apparent. Hypoglycemia triggers a robust activation of the autonomic nervous system (11,12) with marked changes in circulating (13) and brain-based catecholamines (14). In turn, dysfunction in the monoamine systems of the brain involving serotonin, dopamine and norepinephrine are well tied to mood disorders and major depression (15) with acute severe stress a notable perceived antecedent to a variety of psychiatric disorders (16). The symptoms elicited by acute severe stress overlap those of hypoglycemia because both manifest, in part, from adrenergic signals delivered by the sympathetic nervous system (17). Additionally, analogous regions of the brain appear to be involved in both hypoglycemia and mood as the ventromedial hypothalamus is important to glucose sensing (18), energy homeostasis (19) and anxiety (20).
We have previously shown that hypoglycemia-dependent activation of the autonomic nervous system is associated with social withdrawal in mice and that this impact of hypoglycemia on social behavior resolves within 4 h after a return to euglycemia. In addition, this catecholamine-mediated loss of social exploration requires a beta-2 adrenergic receptor (AR)-dependent pathway and not an alpha or beta-1 AR pathway (21). These findings relate to human disease because catecholamines, especially epinephrine, causes restlessness and apprehension (22). Traditionally, such feelings of discomfort are often linked to the impact of epinephrine on the cardiovascular system, skeletal muscle and/or intermediary metabolism (22) and not directly associated to an effect of catecholamines in the central nervous system. Given the intersection of symptoms, neurotransmitters and brain areas and that nearly one-third of young adults with type 1 diabetes experience psychological distress that often revolves around iatrogenic hypoglycemia (23) we sought to show that hypoglycemia caused depressive-like symptoms in mice that depend on adrenergic signals
Materials and Methods
Materials
All reagents and chemicals were purchased from Sigma-Aldrich (St. Louis, MO) except for Humalin R (insulin), which was purchased from Eli Lilly (Indianapolis, IN).
Animals, fasting and testing for glucose, epinephrine and norepinephrine
Mouse use was conducted in accordance with Institutional Animal Care and Use Committee approved protocols at the University of Illinois. Male C57BL/6J mice 3–4 wks of age were purchased from Jackson Laboratories. Mice were housed (4 × cage) in standard shoebox cages (length 28 cm; width 17 cm; height 12.5cm) and allowed water and food ad libitum. Mice were fed pelleted food (NIH 5K52; LabDiet; Purina Mills). Housing temperature (23°C) and humidity (45–55%) were controlled as was a 12/12 h reversed dark-light cycle (2000-0800 h). Male 10- to 12-wk-old animals were used for all experiments. When 12 h fasting was performed (2000-0800 h), mice were transferred to a new cage and singly housed. Fasted mice were provided water ad libitum. If insulin was administered to a 12 h fasted mouse, food was re-introduced 0.75 h after insulin administration. Mouse tail blood glucose was recorded using a FreeStyle Freedom blood glucose monitor (Abbott) after the tail was cleaned with 70% ethanol and lanced with a sterile 18 gauge hypodermic needle (BD). Plasma for catecholamine testing was derived from left ventricular blood after mice were deeply anesthetized with sodium ketamine hydrochloride:xylazine hydrochloride (80 mg/ml:12 mg/ml, ketamine:xylazine) at 5 ml/kg body weight. Catecholamine (epinephrine and norepinephrine) detection was performed at the Mouse Metabolic Phenotyping Center at Vanderbilt University by HPLC. Measurement of catecholamines was performed on cohorts of mice independent from those being examined for blood glucose and behavior.
ICV cannula placement
Mice were anesthetized using an intraperitoneal (IP) sodium ketamine hydrochloride/xylazine hydrochloride solution delivering 80 mg/kg ketamine and 12 mg/kg xylazine at 1.5 ml/kg body weight. A Kopf stereotaxic instrument (David Kopf Instruments) was used to place a mouse-specific brain infusion cannula (Plastics One) at the coordinates: 0.6 mm posterior, 1.5 mm lateral to the bregma and 2.5 mm ventral from the skull surface using The Mouse Brain in Stereotaxic Coordinates (24). Cannulas were affixed to the skull with cyanoacrylate gel adhesive (Plastics One) and protected by a plastic guard. Animals were allowed 1 wk for recovery.
Treatments
Insulin was administered IP at 0.8 units/kg/mouse or ICV at 0.4 units/mouse. Epinephrine and norepinephrine were administered IP at 1.5 mg/kg. The pan-alpha AR antagonist - phentolamine (1 mg/kg/mouse), the beta-1 AR antagonist metoprolol (10 mg/kg/mouse) or the beta-2 AR antagonist butoxamine (5 mg/kg/mouse) were administered IP twice, 30 min prior to insulin injection and 30 min prior to the FST. Antidepressants fluoxetine (10 mg/kg/mouse) or desipramine (5 mg/kg/mouse) were administered IP 30 min prior to the FST. Insulin, epinephrine and norepinephrine were administered at the beginning of the dark cycle (0800 h).
Forced swim test
Testing was initiated by individually transferring mice from their home cage to a clean novel white cylindrical PVC container (diameter 16 cm; height 31 cm) containing 20 cm of water maintained at 25 ± 1° C. Total swim duration was 6 min and immobility was evaluated from the video record using EthoVision XT 7 (Noldus Information Technology) encompassing the final 5 min of the swim. After testing, mice were allowed to dry in a warmed environment (28 ± 1° C) for 10 min then returned to their home cage. Testing occurred 2 hr after the beginning of the dark cycle (1000 h). Video recording of animal behavior was performed under red light using a Night Shot capable video camera (Sony HDR-XR500V). Forced swim testing was performed on cohorts of mice independent from those being examined for all other behaviors. Where indicated mice were examined at both 24 h and 48 h after insulin administration.
Saccharin preference test
Three days prior to insulin administration (adaptation phase) mice were singly housed in standard cages adapted for two bottle water access. Bottles contained either saccharin as a 0.4% sodium saccharin solution or water (saccharin and water were randomized to right verses left bottles). After adaptation, mice were administered insulin with or without pre-treatments as indicated and returned to the cage in which they were adapted in the presence of both water and saccharin (testing phase). Fluid consumption was recorded every 24 h. Fluid consumption was determined by bottle weight. Saccharin preference testing was performed on cohorts of mice independent from those being examined for all other behaviors.
Movement/exploration
Mice were examined in their home cage by video recording for 5 min. Movement was quantified using EthoVision XT 7 (Noldus Information Technology). Testing occurred 3 h after the beginning of the dark cycle (1100 h). Video recording of animal behavior was performed under red light using a Night Shot capable video camera. Movement/exploration, line crossings and novel object recognition testing were performed as a test battery on single cohorts of mice.
Line crossings
Mice were examined in their home cage by video recording for 5 min. The cage was divided into four identical rectangles and line crossing quantified by a trained observer blind to experimental treatments. A line was crossed if the fore and hind limbs of a mouse entered a new rectangle. Testing occurred 3 h after the beginning of the dark cycle (1100 h). Video recording of animal behavior was performed under red light using a Night Shot capable video camera.
Novel object recognition
One hr prior to testing, mice were individually removed from their home cage and placed for 5 min in a novel arena (home cage sized with light bedding) containing two identical objects positioned 10 cm apart at the short-side wall end 5 cm from the short side wall and 6.5 cm from the long-side wall. After training, mice were returned to their home cage for 1 hr. Testing was initiated by returning mice to the testing arena where one of the identical objects (familiar object) was replaced (randomized to right or left) by an unfamiliar object (novel object). Investigative behavior was video recorded for 5 min and evaluated from the video record using EthoVision XT 7 (Noldus Information Technology). Percent investigation was calculated by dividing the time spent examining each object by the total time spent investigating both objects. Testing occurred 4.5 h after the beginning of the dark cycle (1200 h). Video recording of animal behavior was performed under red light using a Night Shot capable video camera.
Statistical analysis
Data are presented as mean ± SEM. The experimental design for behavioral experiments was a completely randomized design (CRD). All data were analyzed using SAS (Cary, NC). Where appropriate the experimental design for behavioral experiments was a CRD with a 2 × 2 factorial arrangement of treatment (2 levels of pretreatment and 2 levels of treatment). The statistical model in the behavior experiments included the effects of insulin, agonist/antagonist and time. Post-hoc comparisons of individual group means was performed with the Tukey’s test. Experimental data, where appropriate, were analyzed by ANOVA. Statistical significance was denoted at p<0.05.
Results
Depressive-like behaviors but not movement or memory deficits exist 24 h after insulin-induced hypoglycemia
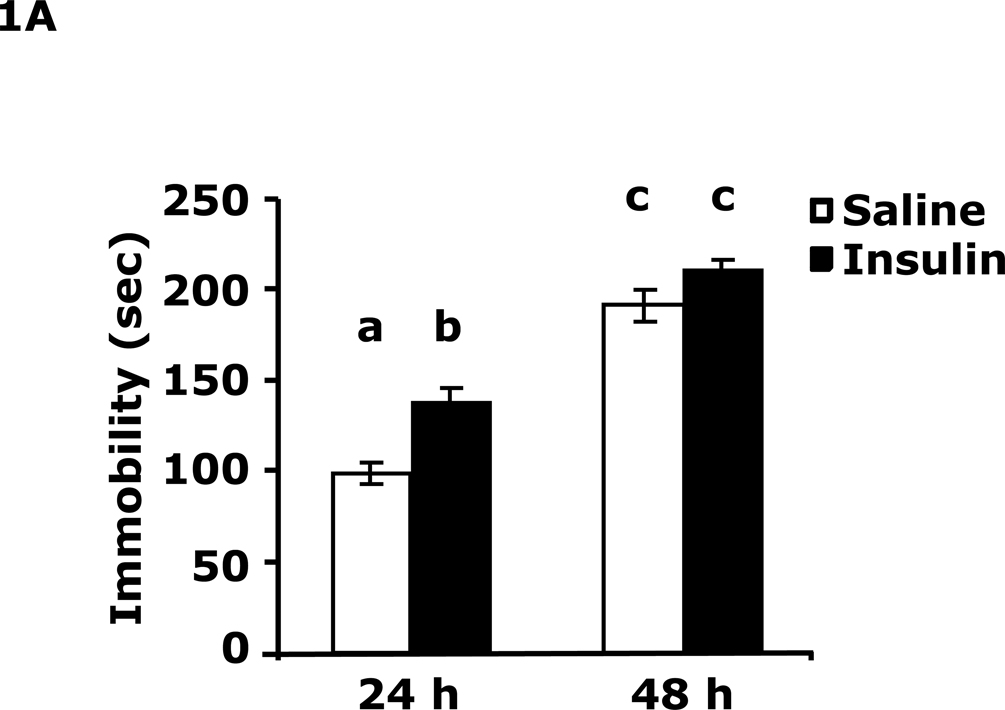
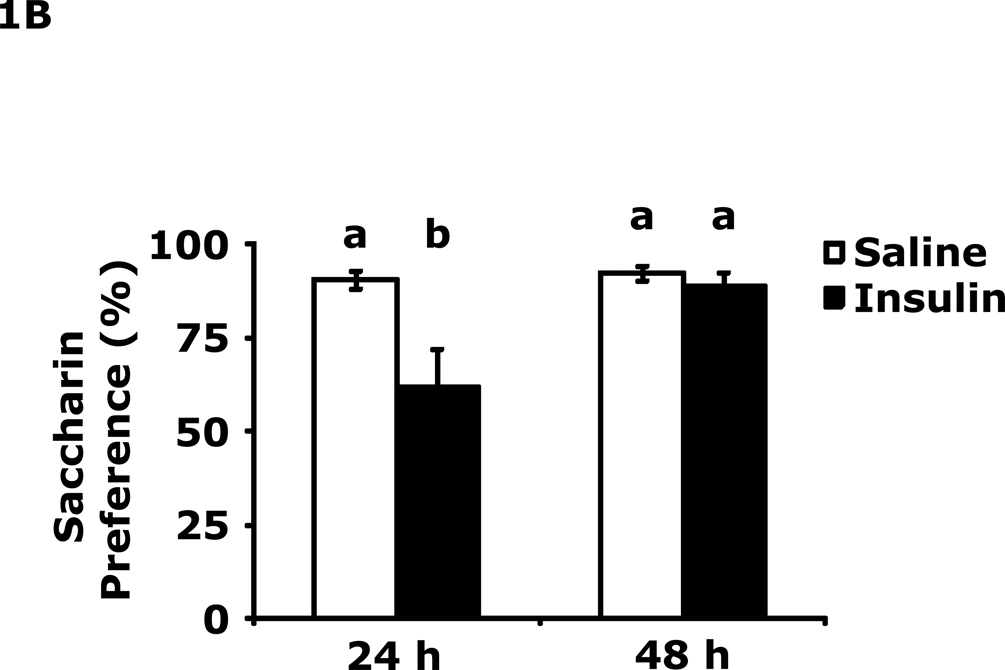
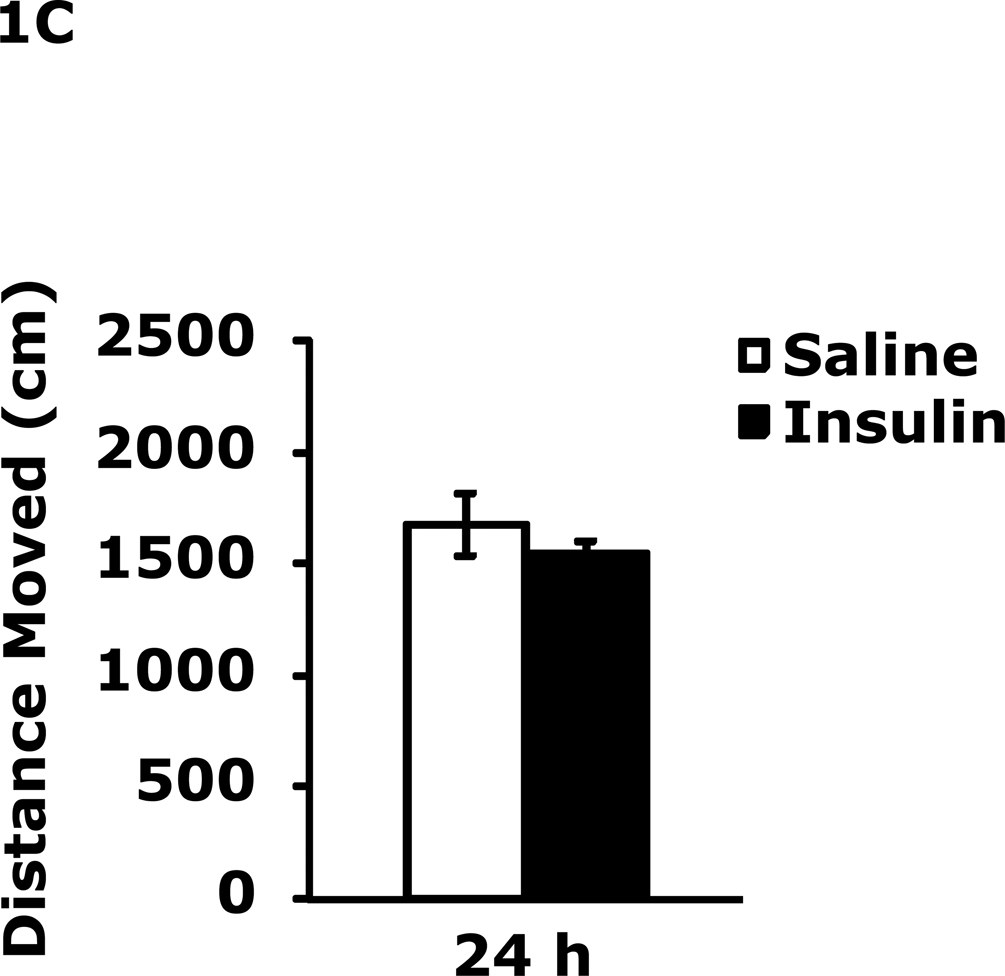
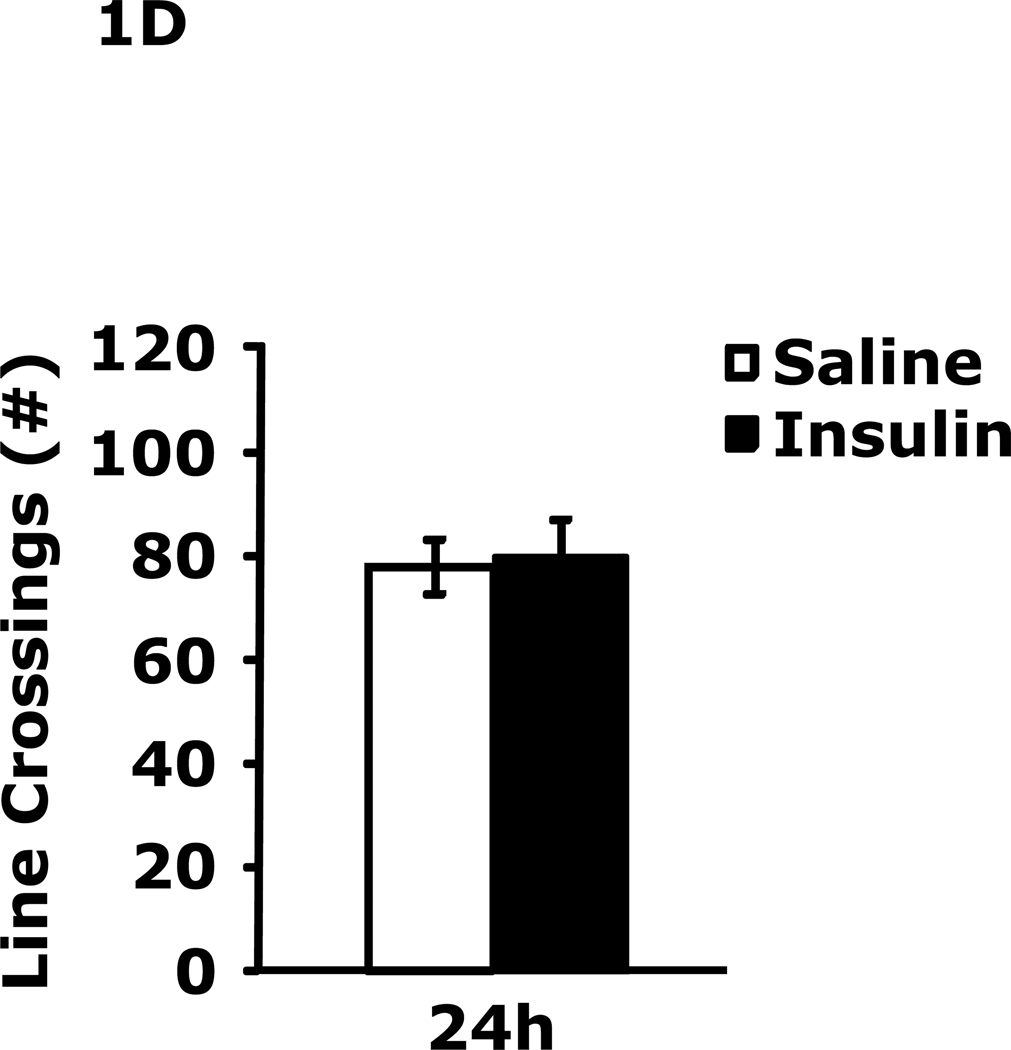
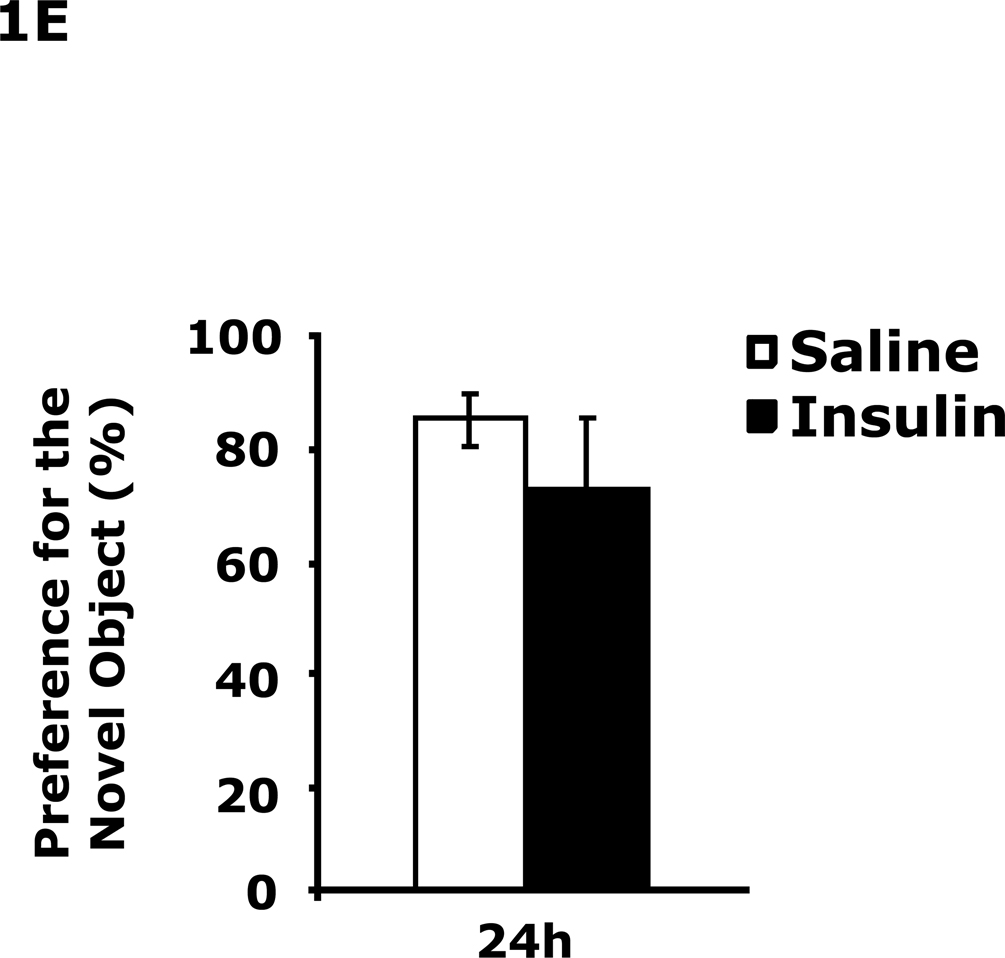
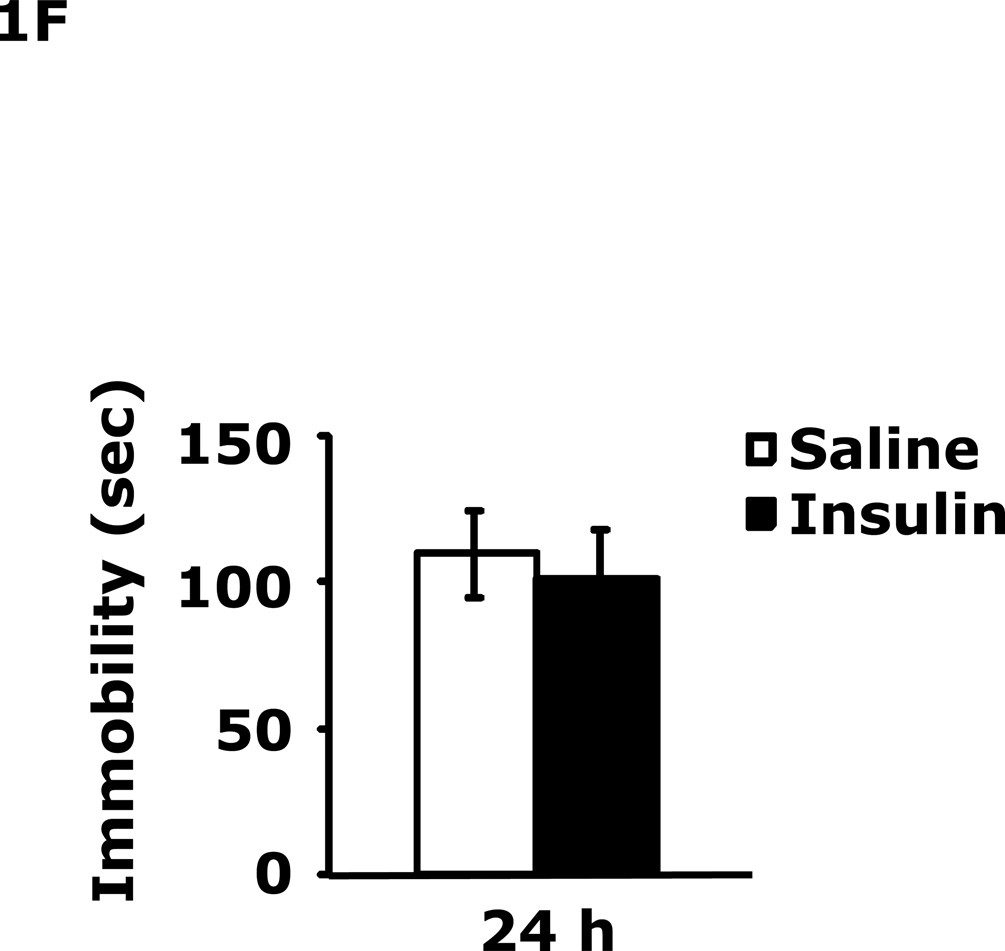
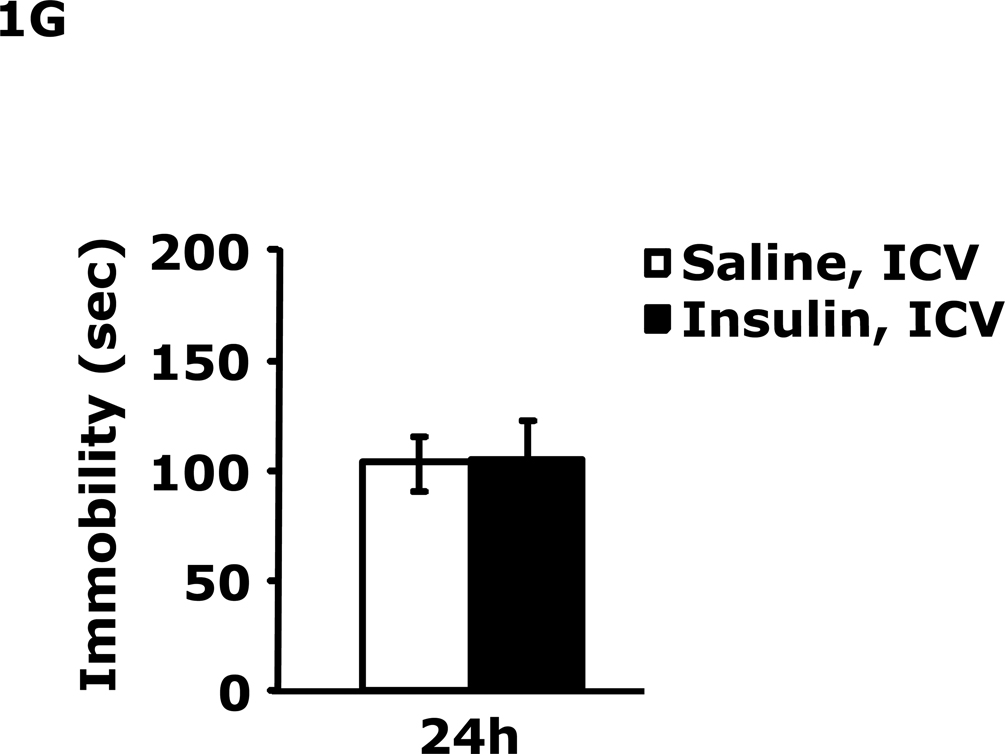
Table 1 demonstrates that IP insulin administration in mice fasted for 12 h caused hypoglycemia. Re-feeding 0.75 h after insulin administration restored blood glucose within 1.25 h of hypoglycemia. Fig. 1A shows that 24 h after insulin-induced hypoglycemia mice had increased immobility in the FST (138 ± 9 seconds vs 99 ± 6 sec). This difference resolved by 48 h after insulin administration. Fig. 1B shows that 24 h after insulin-induced hypoglycemia mice had decreased preference for saccharin (62 ± 10 % vs 91± 2%, insulin vs saline) and that this difference resolved by 48 h after insulin administration. Figs.1C–E demonstrate that 24 h after insulin-induced hypoglycemia mouse locomotor activity, line crossings and novel object recognition were unaffected by antecedent hypoglycemia. Table 2 demonstrates that if mice were provided food ad libitum and were not fasted for 12 h, blood glucose after insulin administration did not fall below 85 mg/dl. Fig. 1F shows that if mice were provided food ad libitum and were not fasted for 12 h, insulin administration did not impact immobility in the FST 24 h after insulin injection. Table 3 shows that ICV insulin administration in mice fasted for 12 h did not cause hypoglycemia. Fig. 1G demonstrates that if mice were fasted for 12 h, ICV insulin had no impact on immobility in the FST 24 h post insulin administration.
Table 1.
Blood glucose (mg/dl) before fasting (−12 h) after fasting (0 h) and after insulin administration and re-feeding (0.75–24 h)
| −12 h | 0 h | 0.75 h | 2 h | 4 h | 24 h | |
|---|---|---|---|---|---|---|
| Saline | 152 ± 6a | 99 ± 4b | 105 ± 4b | 172 ± 5a | 150 ± 10a | 152 ± 7a |
| Insulin | 149 ± 6a | 103 ± 3b | 50 ± 2c | 166 ± 4a | 148 ± 10a | 145 ± 8a |
Results are expressed as mean ± SEM, n=3–8 per group. Two-way ANOVA revealed main effects of time (p<0.001), treatment (p=0.002) and time-treatment interaction (p<0.001). Results without a common superscript letter are different (p<0.05).
Fig. 1. Depressive-like behaviors but not movement or memory deficits exist 24 h after insulin-induced hypoglycemia.
A, After a 12 h fast, mice were administered either saline or insulin IP. Immobility in the FST was measured at 24 h and 48 h after saline or insulin injection. Results are expressed as mean ± SEM; n=14–15/group. Two-way ANOVA revealed main effects of treatment (p=0.003) and time (p<0.001). Bars without a common superscript letter are different (p<0.05). B, After a 12 h fast, mice were administered either saline or insulin IP. Saccharin preference was measured at 24 h and 48 h after saline or insulin injection. Results are expressed as mean ± SEM; n=4/group. Two-way ANOVA revealed main effects of treatment (p=0.0482), time (p=0.0118) and treatment-time interaction (p=0.0196). Bars without a common superscript letter are different (p<0.05). C, After a 12 h fast, mice were administered either saline or insulin IP. Locomotor activity was measured 24 h after saline or insulin injection. Results are expressed as mean ± SEM; n=4–8/group. D, After a 12 h fast, mice were administered either saline or insulin IP. Line crossings were measured 24 h after saline or insulin injection. Results are expressed as mean ± SEM; n=4–8/group. E, After a 12 h fast, mice were administered either saline or insulin IP. Novel object recognition was measured 24 h after saline or insulin injection. Results are expressed as mean ± SEM; n=4–8/group. F, Un-fasted mice were administered either saline or insulin IP. Immobility in the FST was measured at 24 h after saline or insulin injection. Results are expressed as mean ± SEM; n=3–4/group. G, After a 12 h fast, mice were administered either saline or insulin ICV. Immobility in the FST was measured at 24 h after saline or insulin injection. Results are expressed as mean ± SEM; n=3–4/group.
Table 2.
Blood glucose (mg/dl) after insulin administration without fasting
| 0 min | 10 min | 20 min | 40 min | 60 min | 80 min | |
|---|---|---|---|---|---|---|
| Saline | 141 ± 6a | 152 ± 12a | 167 ± 7a | 177 ± 7a | 172 ± 3a | 166 ± 5a |
| Insulin | 131 ± 15a | 99 ± 11b | 101 ± 6b | 122 ± 1b | 168 ± 10a | 172 ± 10a |
Results are expressed as mean ± SEM, n=3–8 per group. Two-way ANOVA revealed main effects of time (p<0.001), treatment (p<0.001) and time-treatment interaction (p<0.001). Results without a common superscript letter are different (p<0.05).
Table 3.
Blood Glucose (mg/dl) after Insulin ICV Injection
| −12 h | 0 h | 0 h | 2 h | 4 h | 24 h | |
|---|---|---|---|---|---|---|
| Saline, ICV | 161 ± 13a | 114 ± 3b | 114 ± 3b | 132 ± 5a | 131 ± 13a | 142 ± 13a |
| Insulin, ICV | 156 ± 9a | 108 ± 6b | 108 ± 6b | 141 ± 13a | 136 ± 7a | 151 ± 14a |
Results are expressed as mean ± SEM, n=3–4 per group. Two-way ANOVA revealed main effect of time (p<0.001). Insulin ICV at 0.2 units/mouse/2 7l injection. Results without a common superscript letter are different (p<0.05).
Insulin-induced immobility in the forced swim test is prevented by antidepressants
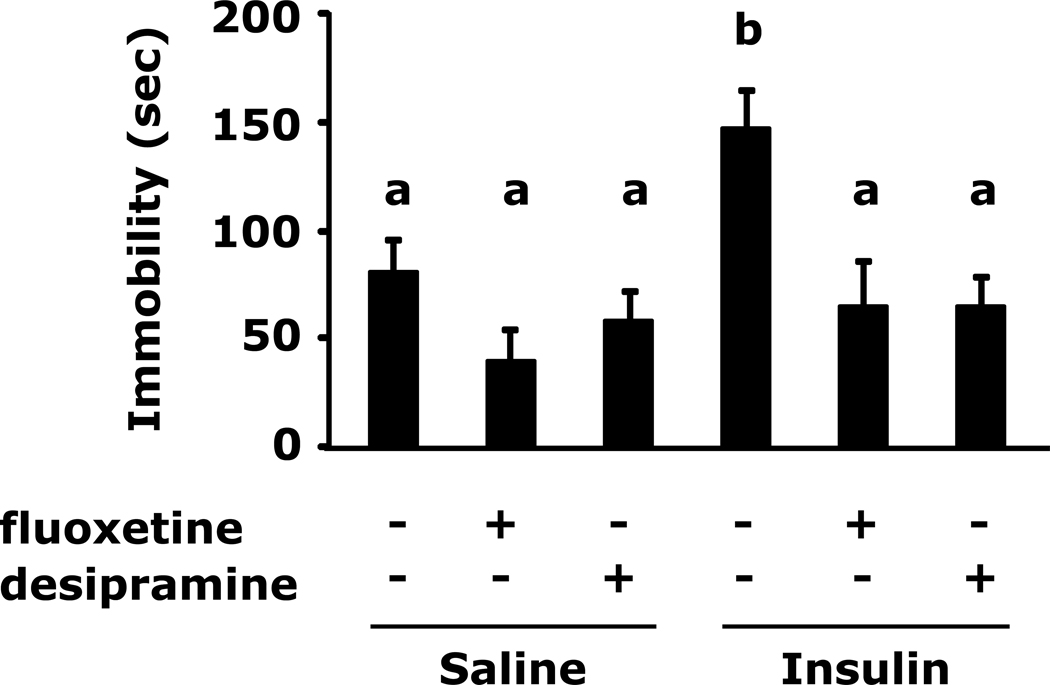
Fig.2 shows that insulin-induced immobility in the FST was prevented by pre-treatment with the fluoxetine or desipramine (148 ± 16 sec vs 82 ± 14 sec, insulin vs saline; 148 ± 16 sec vs 41 ± 14 se, insulin vs saline + fluoxetine; 148 ± 16 sec vs 58 ± 12 sec, insulin vs saline + desipramine, 148 ± 16 sec vs 65 ± 21 sec insulin vs insulin + fluoxetine, 148 ± 16 sec vs 65 ± 12 sec, insulin vs insulin + desipramine).
Fig. 2. Insulin-induced immobility in the forced swim test is prevented by antidepressants.
After a 12 h fast mice were administered either saline or insulin IP. Immobility in the FST was measured at 24 h after saline or insulin injection in the presence or absence of the indicated antidepressants. Results are expressed as mean ± SEM; n=9/group. Two-way ANOVA reveals main effect of pretreatment (p<0.001) and treatment (p= 0.0121). Bars without a common superscript letter are different (p<0.05).
Catecholamines induce immobility in the forced swim test
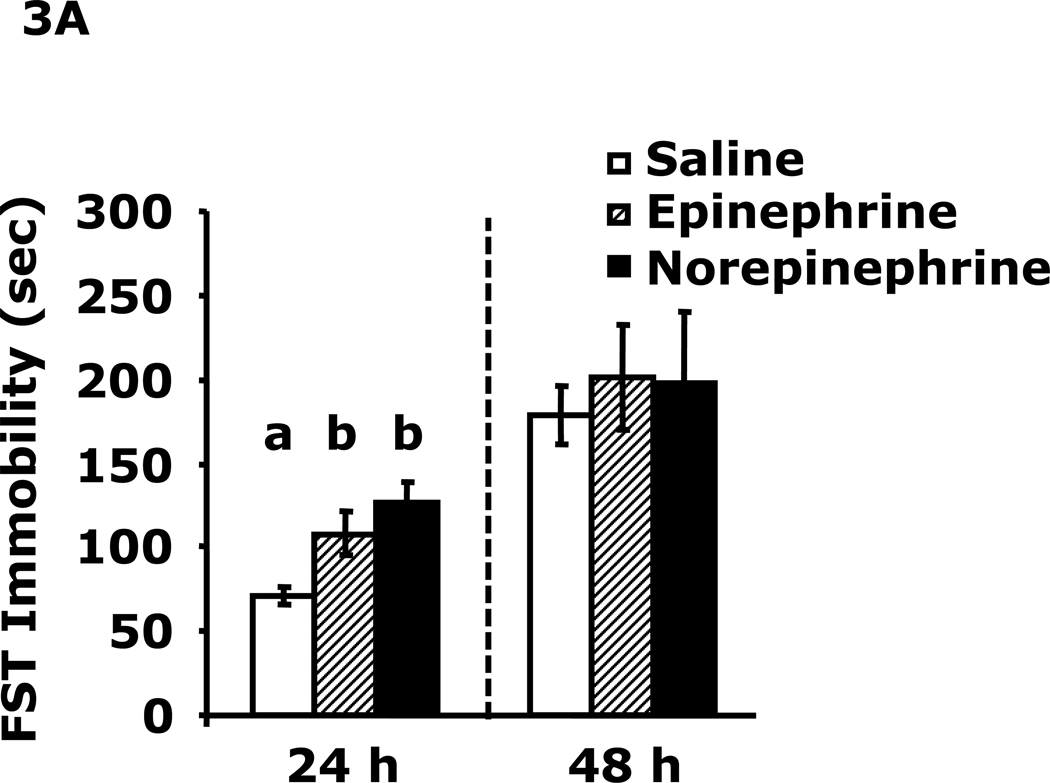
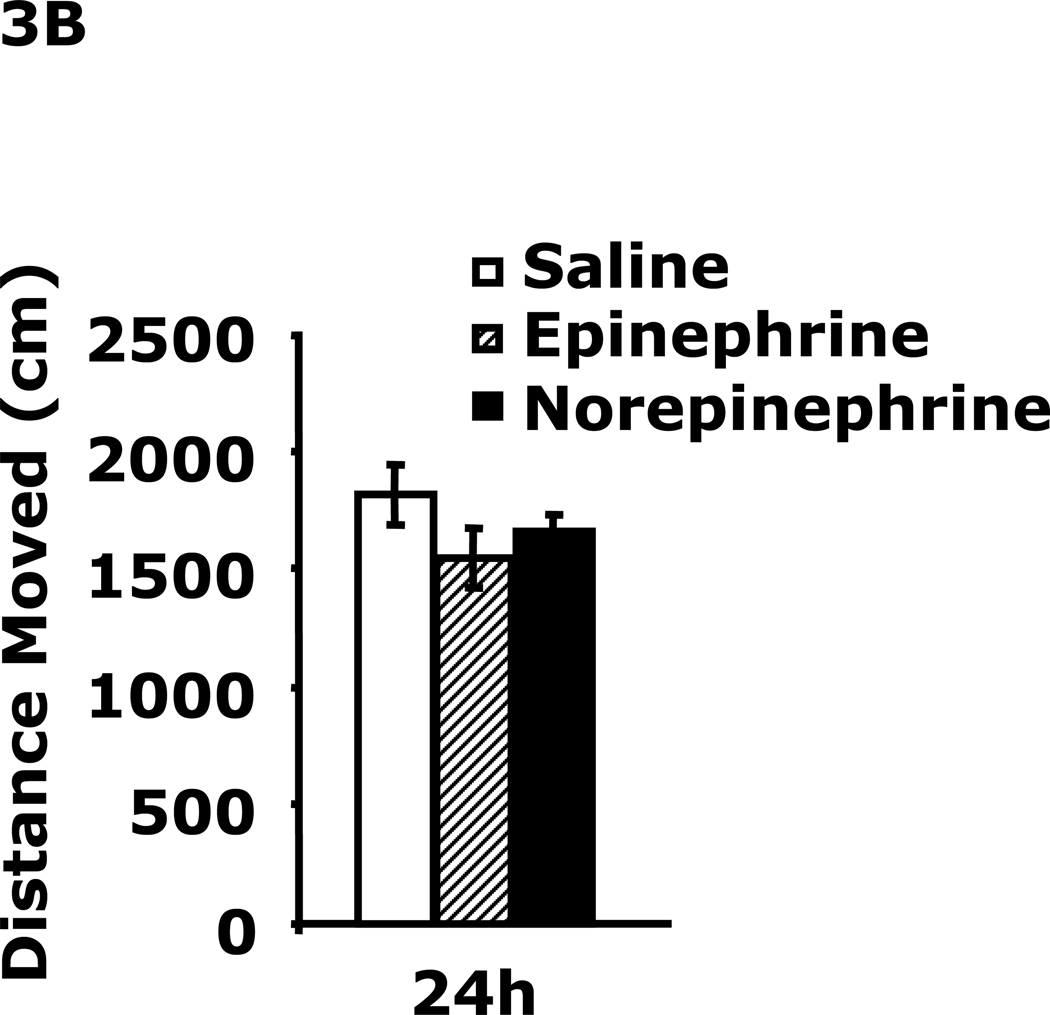
Fig.3A demonstrates that 24 h after epinephrine or norepinephrine administration mice had increased immobility in the FST (108 ± 13 sec vs. 71 ± 5 sec, epinephrine vs saline; 127 ± 13 sec vs. 71 ± 5 sec, norepinephrine vs saline). This difference resolved by 48 h after catecholamine administration. Fig.3B shows that mouse locomotor activity after catecholamine administration was unaffected at 24 h.
Fig. 3. Catecholamines induce immobility in the forced swim test.
A, After a 12 h fast mice were administered saline, epinephrine or norepinephrine IP. Immobility in the FST was measured at 24 h and 48 h after saline, epinephrine or norepinephrine injection. Results are expressed as mean ± SEM; n=4/group. One-way ANOVA revealed main effect of treatment (p=0.007). B, After a 12 h fast mice were administered saline, epinephrine or norepinephrine IP. Locomotor activity was measured 24 h after saline, epinephrine or norepinephrine injection. Results are expressed as mean ± SEM; n=4/group
Adrenergic antagonists block insulin-induced immobility and loss of saccharin preference
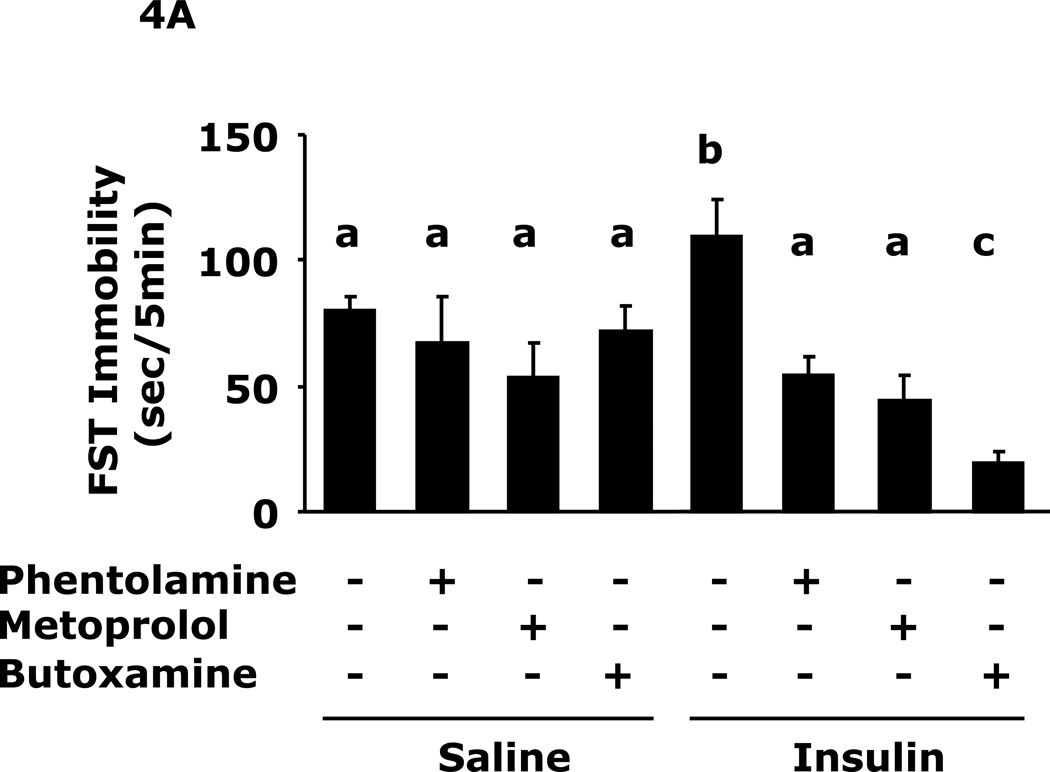
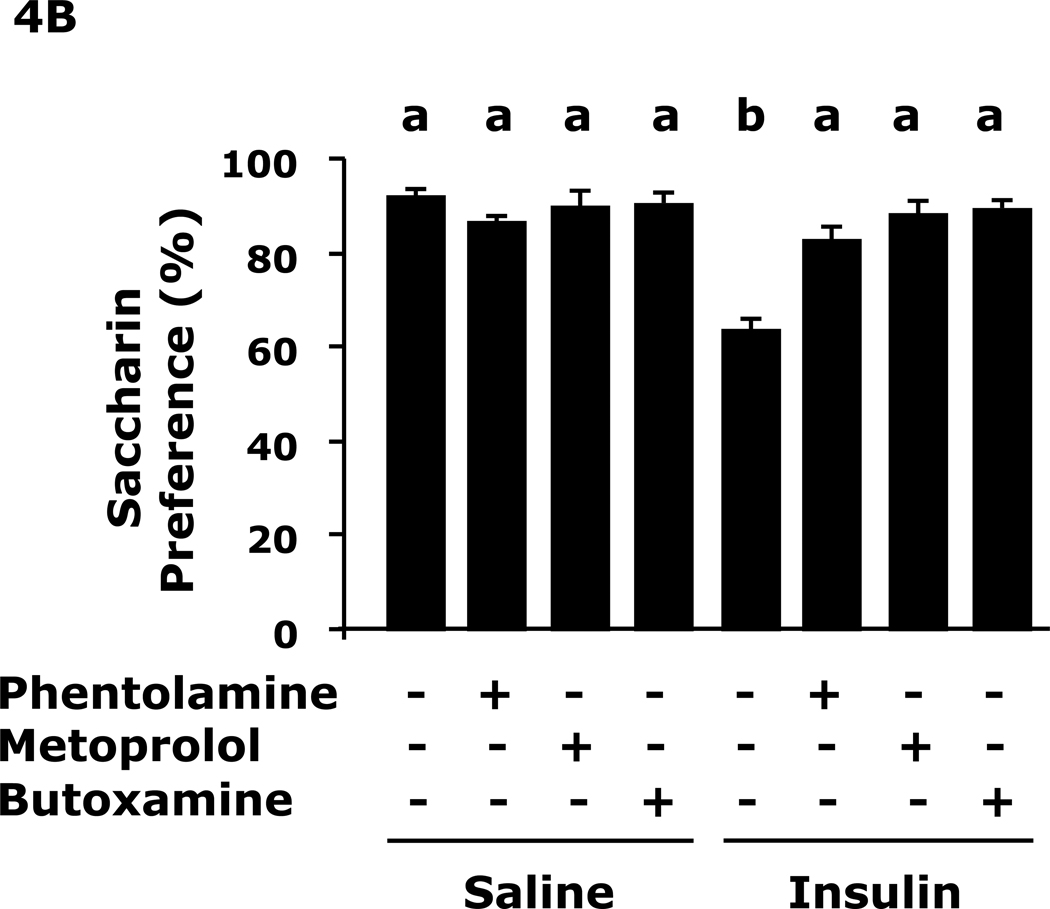
Fig.4A shows that insulin-induced immobility in the FST was prevented by pre-treatment with the pan-alpha AR antagonist phentolamine, the beta-1 AR antagonist metoprolol or the beta-2 AR antagonist butoxamine (109 ± 15 sec vs 80 ± 6 sec, insulin vs saline, 109 ± 15 sec vs 54 ± 7 sec, insulin vs insulin + phentolamine, 109 ± 15 sec vs 46 ± 9 sec, insulin vs insulin + metoprolol, 109 ± 15 sec vs 19 ± 5 sec, insulin vs insulin + butoxamine). Fig.4B shows that insulin-induced loss of saccharin preference was prevented by pre-treatment with the pan-alpha AR antagonist phentolamine, the beta-1 AR antagonist metoprolol or the beta-2 AR antagonist butoxamine (64 ± 8% vs 92 ± 1%, insulin vs saline, 64 ± 8 % vs 82 ± 3%, insulin vs insulin + phentolamine, 64 ± 8% vs 88 ± 3%, insulin vs insulin + metoprolol, 64 ± 8% vs 89 ± 1% insulin vs insulin + butoxamine). Table 4 shows that epinephrine and norepinephrine levels were not significantly impacted by insulin 24 h after insulin administration.
Fig. 4. Adrenergic antagonists block insulin-induced immobility and loss of saccharin preference.
A, After a 12 h fast mice were administered either saline or insulin IP. Immobility in the FST was measured at 24 h after saline or insulin injection in the presence or absence of the indicated adrenergic antagonists. Results are expressed as mean ± SEM; n=8/group. Two-way ANOVA revealed main effects of pretreatment (p<0.001) and pretreatment-treatment interaction (p=0.008). Bars without a common superscript letter are different (p<0.05). B, After a 12 h fast, mice were administered either saline or insulin IP. Saccharin preference was measured at 24 h after saline or insulin injection in the presence or absences of the indicated adrenergic antagonists. Results are expressed as mean ± SEM; n=8/group. Two-way ANOVA revealed main effects of pretreatment (p=0.0022), treatment (p<0.001) and pretreatment-treatment interaction (p<0.001). Bars without a common superscript letter are different (p<0.05).
Table 4.
Plasma catecholamines (pg/ml) 24 h after saline or insulin
| Saline (IP) | Insulin (IP) | |
|---|---|---|
| Epinephrine | 1471 ± 743 | 2345 ± 1034 |
| Norepinephrine | 1317 ± 304 | 1961 ± 490 |
Results are expressed as mean ± SEM; n=7–8 per group
Discussion
Hypoglycemia precipitates a range of symptoms that become more severe with decreasing plasma glucose. In general, epinephrine secretion is triggered at a plasma glucose concentration between 65–70 mg/dl with neurogenic and neuroglycopenic symptoms first becoming manifest at plasma glucose concentrations between 50–55 mg/dl (25). As we have previously shown, mice with insulin induced hypoglycemia near 50 mg/dl develop almost complete loss of social exploration and movement at 0.75 h after insulin administration that resolves at about 3 h after re-feeding (21). Here we achieved a blood glucose of 50 mg/dl at 0.75 h that with re-feeding rebounded to normal within 1.25 h of re-feeding. At 24 h post return to euglycemia, mouse movement and learning/memory were normal but immobility in the FST was increased indicative of depressed behavior. The FST is a powerful tool for demonstrating depressive-like behavior and is currently the most widely and frequently used experimental paradigm for detecting antidepressant activity (26). To confirm the presence of depressive-like behavior we used saccharin preference testing (27). The reason tail-suspension testing was not used as a corroborative test is that C57Bl/6J mice are significantly motoric with an aggressive tail-climbing phenotype which tends to confound and invalidate the tail-suspension test in these animals (26). Notably, initial development of hypoglycemia was a key to the behaviors seen because insulin administration (peripheral or central) without adjacent hypoglycemia was not sufficient to induce depressive-like behaviors. This was not surprising because we have previously shown that central (ICV) administration of insulin to mice increased by as much as 50% social exploratory activity that lasts for over 22 h post insulin administration (28). Interestingly, Robertson et al. has just shown that insulin can down-regulate surface expression of the high-affinity norepinephrine transporter in mouse hippocampal slices and superior cervical ganglion neuron boutons (29). While reduced brain norepinephrine and/or norepinephrine signaling may be tied to anxious depression (17) the limbic circuit rather than the hippocampus is probably more relevant to this type of mood imbalance. Furthermore, Robertson et al. did not report on behavioral manifestations that result from their identified decline in norepinephrine transporters (29).
Pharmacologic validation of depression was achieved with either the selective serotonin reuptake inhibitor (SSRI) fluoxetine or the tricylic desipramine. Given that both were equally effective at reducing immobility in the FST it is difficult to speculate on the monoamine pathways essential to hypoglycemia-associated depression. In addition, it was not surprising that both antidepressants were effective, since each has been shown to impact both serotonin and norepinephrine pathways (30,31). It was surprising, that epinephrine and norepinephrine caused increased depressive-like behavior measurable 24 h after administration. It has been shown that drugs that reduce central catecholamines (more so than serotonin) impact the FST (31). In addition, it was our initial thought that hypoglycemia might trigger focal transient norepinephrine depletion in the hypothalamus due to activity of glucose-sensing neurons. With such depletion, the potential would exist for depressive-like behavior to manifest. However, since both epinephrine and norepinephrine induced depressive-like behavior, such behavior may be more reliant on increases rather than decreases in catecholamine-dependent neuronal pathways. Our work lends support to that of Tanaka et al. who demonstrated that rats exposed to a variety of stressful and fear-inducing conditions had increased norepinephrine release in the hypothalamus, amygdala and locus coeruleus that when mitigated reduced anxiety (32). Evidence for catecholamine involvement in mood change has been widely reported (33) and individuals with mood disorders often present with some degree of increased plasma catecholamines (34–36). More recently the brainstem noradrenergic system has gained credence as a potential regulator of stress, anxiety and depression (37).
Finally, administration of alpha and beta AR antagonists blocked hypoglycemia-associated depressive behavior indicating that adrenergic pathways are important to this process. Based on our previous findings these data were somewhat unexpected because hypoglycemia-associated social withdrawal is blocked specifically by the beta 2 receptor antagonist butoxamine and not the pan-alpha AR antagonist phentolamine nor the beta 1 AR antagonist metoprolol (21). However, given the complex pathways involved in depressive behaviors, we should have expected that a multiplicity of ARs were involved. Even within well-defined norepinephrine pathways pre- and post-synaptic alpha and beta ARs can impact a cornucopia of neurotransmitters and neurotrophic factors (38). Therefore, it was quite significant that hypoglycemia-associated immobility in the FST and loss of saccharin preference could be blocked by peripheral administration of AR antagonists. Why such depressive behaviors manifest or persist after resolution of the triggering event is not clear, as we have reviewed (39), but is a very active area research. While we did not detect a statistically significant difference in plasma epinephrine or norepinephrine at 24 h after insulin administration there was a trend toward catecholamine elevation and, as noted above, such findings are frequently seen in the individual presenting with depression. In sum, our results underscore the importance of acute adrenergic stress to depressive behaviors and suggest that the reluctance of some individuals to continue insulin therapy for the treatment of diabetes may be more than conditioned aversion due to iatrogenic hypoglycemia but generalized loss of motivation due to depression. In addition, peripherally administered AR antagonists may have a role in the management of stressful events that are considered depressogenic.
Acknowledgments
Support
This research was supported by the National Institutes of Health (DK064862, NS058525 and AA019357 to G.G.F.), USDA National Institute of Food and Agriculture, Hatch project number #ILLU-971-32
Abbreviations
- AR
adrenergic receptor
- CRD
completely randomized design
- FST
forced swim test
- ICV
intracerebroventricular
- IP
intraperitoneal
- SSRI
selective serotonin reuptake inhibitor
Footnotes
No conflict of interest for any authors
No financial conflicts
Author's contribution(s)
MJP: designed and executed study, analyzed data and wrote paper.
SWY: executed study
BSC: executed study
RD: designed study
GGF: designed study, analyzed data and wrote paper
References
- 1.Frier BM. How hypoglycaemia can affect the life of a person with diabetes. Diabetes Metab. Res. Rev. 2008;24:87–92. doi: 10.1002/dmrr.796. [DOI] [PubMed] [Google Scholar]
- 2.Becker DJ, Ryan CM. Hypoglycemia: a complication of diabetes therapy in children. Trends Endocrinol. Metab. 2000;11:198–202. doi: 10.1016/s1043-2760(00)00259-9. [DOI] [PubMed] [Google Scholar]
- 3.Desouza CV, Bolli GB, Fonseca V. Hypoglycemia, diabetes, and cardiovascular events. Diabetes Care. 2010;33:1389–1394. doi: 10.2337/dc09-2082. [DOI] [PMC free article] [PubMed] [Google Scholar]
- 4.Gold AE, Deary IJ, Frier BM. Hypoglycaemia and non-cognitive aspects of psychological function in insulin-dependent (type 1) diabetes mellitus (IDDM) Diabet. Med. 1997;14:111–118. doi: 10.1002/(SICI)1096-9136(199702)14:2<111::AID-DIA309>3.0.CO;2-S. [DOI] [PubMed] [Google Scholar]
- 5.Gold AE, MacLeod KM, Frier BM, Deary IJ. Changes in mood during acute hypoglycemia in healthy participants. J. Pers. Soc. Psychol. 1995;68:498–504. doi: 10.1037//0022-3514.68.3.498. [DOI] [PubMed] [Google Scholar]
- 6.Hughes CS, Patek SD, Breton MD, Kovatchev BP. Hypoglycemia Prevention via Pump Attenuation and Red-Yellow-Green "Traffic" Lights Using Continuous Glucose Monitoring and Insulin Pump Data. J. Diabetes Sci. Technol. 2010;4:1146–1155. doi: 10.1177/193229681000400513. [DOI] [PMC free article] [PubMed] [Google Scholar]
- 7.Karter AJ, Subramanian U, Saha C, Crosson JC, Parker MM, Swain BE, Moffet HH, Marrero DG. Barriers to insulin initiation: the translating research into action for diabetes insulin starts project. Diabetes Care. 2010;33:733–735. doi: 10.2337/dc09-1184. [DOI] [PMC free article] [PubMed] [Google Scholar]
- 8.Jaser SS. Psychological problems in adolescents with diabetes. Adolesc. Med. State. Art Rev. 2010;21:138, x–151. [PMC free article] [PubMed] [Google Scholar]
- 9.Luchsinger JA. Diabetes, related conditions, and dementia. J. Neurol. Sci. 2010;299:35–38. doi: 10.1016/j.jns.2010.08.063. [DOI] [PMC free article] [PubMed] [Google Scholar]
- 10.de la Monte SM, Wands JR. Alzheimer's disease is type 3 diabetes-evidence reviewed. J. Diabetes Sci. Technol. 2008;2:1101–1113. doi: 10.1177/193229680800200619. [DOI] [PMC free article] [PubMed] [Google Scholar]
- 11.Amiel SA. Hypoglycemia: from the laboratory to the clinic. Diabetes Care. 2009;32:1364–1371. doi: 10.2337/dc09-0113. [DOI] [PMC free article] [PubMed] [Google Scholar]
- 12.Hoffman RP. Sympathetic mechanisms of hypoglycemic counterregulation. Curr. Diabetes Rev. 2007;3:185–193. doi: 10.2174/157339907781368995. [DOI] [PubMed] [Google Scholar]
- 13.Herzog RI, Chan O, Yu S, Dziura J, McNay EC, Sherwin RS. Effect of acute and recurrent hypoglycemia on changes in brain glycogen concentration. Endocrinology. 2008;149:1499–1504. doi: 10.1210/en.2007-1252. [DOI] [PMC free article] [PubMed] [Google Scholar]
- 14.de Vries MG, Lawson MA, Beverly JL. Dissociation of hypothalamic noradrenergic activity and sympathoadrenal responses to recurrent hypoglycemia. Am. J. Physiol. Regul. Integr. Comp. Physiol. 2004;286:R910–R915. doi: 10.1152/ajpregu.00254.2002. [DOI] [PubMed] [Google Scholar]
- 15.Ruhe HG, Mason NS, Schene AH. Mood is indirectly related to serotonin, norepinephrine and dopamine levels in humans: a meta-analysis of monoamine depletion studies. Mol. Psychiatry. 2007;12:331–359. doi: 10.1038/sj.mp.4001949. [DOI] [PubMed] [Google Scholar]
- 16.Chen LP, Murad MH, Paras ML, Colbenson KM, Sattler AL, Goranson EN, Elamin MB, Seime RJ, Shinozaki G, Prokop LJ, Zirakzadeh A. Sexual abuse and lifetime diagnosis of psychiatric disorders: systematic review and meta-analysis. Mayo Clin. Proc. 2010;85:618–629. doi: 10.4065/mcp.2009.0583. [DOI] [PMC free article] [PubMed] [Google Scholar]
- 17.Goddard AW, Ball SG, Martinez J, Robinson MJ, Yang CR, Russell JM, Shekhar A. Current perspectives of the roles of the central norepinephrine system in anxiety and depression. Depress. Anxiety. 2010;27:339–350. doi: 10.1002/da.20642. [DOI] [PubMed] [Google Scholar]
- 18.McCrimmon RJ, Song Z, Cheng H, McNay EC, Weikart-Yeckel C, Fan X, Routh VH, Sherwin RS. Corticotrophin-releasing factor receptors within the ventromedial hypothalamus regulate hypoglycemia-induced hormonal counterregulation. J. Clin. Invest. 2006;116:1723–1730. doi: 10.1172/JCI27775. [DOI] [PMC free article] [PubMed] [Google Scholar]
- 19.Xu Y, Hill JW, Fukuda M, Gautron L, Sohn JW, Kim KW, Lee CE, Choi MJ, Lauzon DA, Dhillon H, Lowell BB, Zigman JM, Zhao JJ, Elmquist JK. PI3K signaling in the ventromedial hypothalamic nucleus is required for normal energy homeostasis. Cell. Metab. 2010;12:88–95. doi: 10.1016/j.cmet.2010.05.002. [DOI] [PMC free article] [PubMed] [Google Scholar]
- 20.Kim KW, Zhao L, Parker KL. Central nervous system-specific knockout of steroidogenic factor 1. Mol. Cell. Endocrinol. 2009;300:132–136. doi: 10.1016/j.mce.2008.09.026. [DOI] [PubMed] [Google Scholar]
- 21.Park MJ, Guest CB, Barnes MB, Martin J, Ahmad U, York JM, Freund GG. Blocking of beta-2 adrenergic receptors hastens recovery from hypoglycemia-associated social withdrawal. Psychoneuroendocrinology. 2008;33:1411–1418. doi: 10.1016/j.psyneuen.2008.08.005. [DOI] [PMC free article] [PubMed] [Google Scholar]
- 22.Westfall TC, Westfall DP. Adrenergic Agonists and Antagonists. In: Brunton LL, editor. Goodman & Gilman's The Pharmacological Basis of Therapeutics. Ohio: McGraw-Hill; 2006. [Google Scholar]
- 23.Hislop AL, Fegan PG, Schlaeppi MJ, Duck M, Yeap BB. Prevalence and associations of psychological distress in young adults with Type 1 diabetes. Diabet. Med. 2008;25:91–96. doi: 10.1111/j.1464-5491.2007.02310.x. [DOI] [PubMed] [Google Scholar]
- 24.Franklin KBJ, Paxinos G. The Mouse Brain in Stereotaxic Coordinates. Third Edition. New York: Academic Press; 2008. [Google Scholar]
- 25.Cryer PE, Davis SN, Shamoon H. Hypoglycemia in diabetes. Diabetes Care. 2003;26:1902–1912. doi: 10.2337/diacare.26.6.1902. [DOI] [PubMed] [Google Scholar]
- 26.Cryan JF, Mombereau C. In search of a depressed mouse: utility of models for studying depression-related behavior in genetically modified mice. Mol. Psychiatry. 2004;9:326–357. doi: 10.1038/sj.mp.4001457. [DOI] [PubMed] [Google Scholar]
- 27.Katz RJ. Animal model of depression: pharmacological sensitivity of a hedonic deficit. Pharmacol. Biochem. Behav. 1982;16:965–968. doi: 10.1016/0091-3057(82)90053-3. [DOI] [PubMed] [Google Scholar]
- 28.Lin KI, Johnson DR, Freund GG. LPS-dependent suppression of social exploration is augmented in type 1 diabetic mice. Brain Behav. Immun. 2007;21:775–782. doi: 10.1016/j.bbi.2007.01.004. [DOI] [PubMed] [Google Scholar]
- 29.Robertson SD, Matthies HJ, Owens WA, Sathananthan V, Christianson NS, Kennedy JP, Lindsley CW, Daws LC, Galli A. Insulin reveals Akt signaling as a novel regulator of norepinephrine transporter trafficking and norepinephrine homeostasis. J. Neurosci. 2010;30:11305–11316. doi: 10.1523/JNEUROSCI.0126-10.2010. [DOI] [PMC free article] [PubMed] [Google Scholar]
- 30.Frazer A. Serotonergic and noradrenergic reuptake inhibitors: prediction of clinical effects from in vitro potencies. J. Clin. Psychiatry. 2001;62 Suppl 12:16–23. [PubMed] [Google Scholar]; Perry KW, Fuller RW. Fluoxetine increases norepinephrine release in rat hypothalamus as measured by tissue levels of MHPG-SO4 and microdialysis in conscious rats. J. Neural Transm. 1997;104:953–966. doi: 10.1007/BF01285563. [DOI] [PubMed] [Google Scholar]
- 31.Porsolt RD, Bertin A, Blavet N, Deniel M, Jalfre M. Immobility induced by forced swimming in rats: effects of agents which modify central catecholamine and serotonin activity. Eur. J. Pharmacol. 1979;57:201–210. doi: 10.1016/0014-2999(79)90366-2. [DOI] [PubMed] [Google Scholar]
- 32.Tanaka M, Yoshida M, Emoto H, Ishii H. Noradrenaline systems in the hypothalamus, amygdala and locus coeruleus are involved in the provocation of anxiety: basic studies. Eur. J. Pharmacol. 2000;405:397–406. doi: 10.1016/s0014-2999(00)00569-0. [DOI] [PubMed] [Google Scholar]
- 33.Potter WZ, Manji HK. Catecholamines in depression: an update. Clin. Chem. 1994;40:279–287. [PubMed] [Google Scholar]
- 34.Roy A, Pickar D, Linnoila M, Potter WZ. Plasma norepinephrine level in affective disorders. Relationship to melancholia. Arch. Gen. Psychiatry. 1985;42:1181–1185. doi: 10.1001/archpsyc.1985.01790350055010. [DOI] [PubMed] [Google Scholar]
- 35.Barnes RF, Veith RC, Borson S, Verhey J, Raskind MA, Halter JB. High levels of plasma catecholamines in dexamethasone-resistant depressed patients. Am. J. Psychiatry. 1983;140:1623–1625. doi: 10.1176/ajp.140.12.1623. [DOI] [PubMed] [Google Scholar]
- 36.Lake CR, Pickar D, Ziegler MG, Lipper S, Slater S, Murphy DL. High plasma norepinephrine levels in patients with major affective disorder. Am. J. Psychiatry. 1982;139:1315–1318. doi: 10.1176/ajp.139.10.1315. [DOI] [PubMed] [Google Scholar]
- 37.Itoi K, Sugimoto N. The brainstem noradrenergic systems in stress, anxiety and depression. J. Neuroendocrinol. 2010;22:355–361. doi: 10.1111/j.1365-2826.2010.01988.x. [DOI] [PubMed] [Google Scholar]
- 38.Herrmann N, Lanctot KL, Khan LR. The role of norepinephrine in the behavioral and psychological symptoms of dementia. J. Neuropsychiatry Clin. Neurosci. 2004;16:261–276. doi: 10.1176/jnp.16.3.261. [DOI] [PubMed] [Google Scholar]
- 39.Dantzer R, O'Connor JC, Freund GG, Johnson RW, Kelley KW. From inflammation to sickness and depression: when the immune system subjugates the brain. Nat. Rev. Neurosci. 2008;9:46–56. doi: 10.1038/nrn2297. [DOI] [PMC free article] [PubMed] [Google Scholar]


