Abstract
Background/Aims
Reports of the prevalence of and trends in metabolic syndrome in Korea have been inconsistent. Thus, we investigated the reasons underlying these inconsistencies.
Methods
We estimated the prevalence of metabolic syndrome using different diagnostic criteria, exclusion criteria, and sampling weights among 5,509 respondents, aged 20-79, who participated in the 2001 Korean National Health and Nutrition Examination Surveys (KNHANES). Trends in metabolic syndrome were assessed by examining the 1998 (n = 6,747), 2001 (n = 4,337), and 2005 (n = 5,139) KNHANES.
Results
The estimated prevalence of metabolic syndrome in 2001 ranged from 1.6 to 29.6% in males and from 10.1 to 32.8% in females, depending on the diagnostic criteria used. The exclusion criteria and sampling weights did not significantly affect the prevalence estimates. The prevalence of metabolic syndrome first significantly increased and then decreased between 1998, 2001, and 2005 in males (26.2, 29.6, and 27.2%, respectively) and females (29.2, 32.8, and 24.7%, respectively). Among the individual metabolic variables, triglyceride levels in 2001 were significantly higher than in 1998 and 2005, whereas other variables remained relatively constant during the same period. The exceptionally high triglyceride levels in 2001 might have contributed to the increased prevalence of metabolic syndrome between 1998 and 2001.
Conclusions
Different diagnostic criteria for metabolic syndrome represent a major cause of the inconsistent estimates of prevalence, and the absence of standardized laboratory methods might have affected the trend estimates.
Keywords: Metabolic syndrome, Prevalence, Trends, Epidemiology, Korea
INTRODUCTION
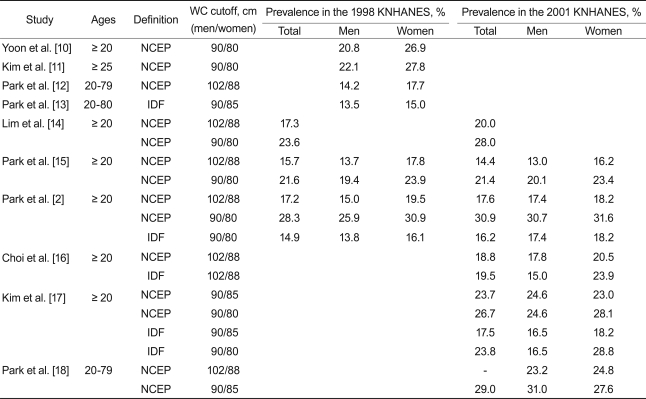
Metabolic syndrome refers to a cluster of several cardiovascular risk factors most commonly including obesity, type 2 diabetes, dyslipidemia, and hypertension [1]. Due to increasing consumption of high-fat diets and decreasing physical activity, obesity has become more prevalent in Korea. Consequently, the prevalence of metabolic syndrome is also expected to increase [2]. However, projections of prevalence of and trends in metabolic syndrome in Korea have been inconsistent. Prevalence estimates of metabolic syndrome vary widely, from 5.2 to 35.3% for men and 9.0 to 39.2% for women [2-18]. Although some inconsistencies may be due to differences in study population and design [3-9], even studies analyzing the same data have reported inconsistent prevalence and trend estimates (Table 1) [2,10-18]. For example, using data from the Korea National Health and Nutrition Examination Survey (KNHANES), one study reported a rapid increase of metabolic syndrome between 1998 and 2001 [14], whereas another reported no increase during the same period [15]. Different estimates of prevalence or trajectories of metabolic syndrome can create confusion not only for the public but also among health care professionals. Indeed, it is impossible to identify a single study to represent the best approach to assessing metabolic syndrome in Korea because each involves unique objectives and rationales for the methodologies employed. Thus, it is important to consider the potential causes of different estimates when reporting and interpreting data on the prevalence and trajectory of metabolic syndrome. The purpose of this study was to assess the effect of different diagnostic and exclusion criteria and different statistical methods on estimates of the prevalence of metabolic syndrome.
Table 1.
Prevalence of metabolic syndrome based on the 1998 and 2001 Korea National Health and Nutrition Examination Surveys (KNHANES)
WC, waist circumference; NCEP, National Cholesterol Education Program-Adult Treatment Panel III; IDF, International Diabetes Federation.
METHODS
This study analyzed findings from the KNHANES, which was conducted by the Korean Ministry of Health and Welfare in 1998, 2001, and 2005. The KNHANES consisted of a health interview, medical examinations, and nutrition surveys. A stratified multistage probability sampling design was used, with selection made from sampling units based on geographical area and type of residence. In the present study, the effects of different diagnostic criteria, exclusion criteria, and statistical methods were assessed using the 2001 KNHANES data. A total of 5,509 (2,349 males and 3,160 females) individuals aged 20 to 79 years completed health examinations for the 2001 KNHANES. Of these, 490 males and 644 females had not fulfilled the fasting requirements (8 hours) when their blood samples were taken, and 43 females (including five excluded due to the fasting requirement) were currently pregnant. To compare the prevalence of metabolic syndrome in the different survey years, we analyzed data obtained from all subjects who met fasting and non-pregnant criteria in each survey: 6,747 (3,054 males and 3,693 females) participants in the 1998 KNHANES, 4,337 (1,850 males and 2,478 females) participants in the 2001 KNHANES, and 5,139 (2,204 males and 2,935 females) participants in the 2005 KNHANES.
Waist circumference was measured to the nearest 0.1 cm at the midpoint between the lower borders of the rib cage and the iliac crest. Systolic blood pressure (SBP) and diastolic blood pressure (DBP) were measured using a standard mercury sphygmomanometer at phase I and V Korotkoff sounds, respectively. At least two SBP and DBP readings were recorded, and their averages were used for analysis. Blood samples were taken after an overnight fasting period and then analyzed at a central certified laboratory to determine serum concentrations of fasting glucose, total cholesterol, triglycerides, and high-density lipoprotein (HDL)-cholesterol using an autoanalyzer (Hitachi 747, Tokyo, Japan). Medical history and current medication status were ascertained via self-administered questionnaires.
The definition of metabolic syndrome was based on the those of the National Cholesterol Education Program (NCEP) Adult Treatment Panel III [19] and the International Diabetes Federation (IDF) [20], including variously modified cutoff points. Individuals demonstrating three or more of the following five abnormalities were diagnosed by the NCEP with metabolic syndrome, and those who met the criteria for central obesity plus two or more other abnormalities were diagnosed with metabolic syndrome by the IDF. Central obesity was defined as waist circumference > 102 cm or > 90 cm for men and > 88 cm, > 85 cm, or > 80 cm for women. High fasting glucose was defined as ≥ 110 mg/dL or ≥ 100 mg/dL by the NCEP, but as only ≥ 100 mg/dL by the IDF. Low HDL-cholesterol was defined as < 40 mg/dL for men and < 50 mg/dL or < 40 mg/dL for women. High blood pressure (SBP ≥ 130 mmHg or DBP ≥ 85 mmHg), and high triglycerides (≥ 150 mg/dL) were uniformly defined. Participants receiving anti-hypertensive or anti-diabetic medications were considered as having high blood pressure or high fasting glucose, respectively. Information on medications specific for elevated triglycerides and reduced HDL-cholesterol was unavailable.
All statistical analyses were conducted using SAS version 9.12 (SAS Institute Inc., Cary, NC, USA), taking into account the sampling weights unless otherwise indicated. The prevalence of metabolic syndrome and its 95% confidence interval (CI) were calculated using the varying definitions of the syndrome. In this analysis, individuals who fasted for < 8 hours or who were pregnant were excluded, and the sampling weights were adjusted taking into consideration the different exclusion rates by sex and age. Age-specific prevalence was calculated both with and without consideration of the sampling weights, and both including and excluding inappropriate subjects to assess the effects of sampling weights and exclusion criteria. For this analysis, metabolic syndrome was defined according to the revised NCEP definition with modified waist circumference cutoff points (> 90 cm for males; > 80 cm females). Results of the 1998, 2001, and 2005 KNHANES were compared in terms of individual metabolic variables and the combined metabolic syndrome. The median and inter-quartile ranges of each metabolic variable and the prevalence of metabolic syndrome were obtained for each survey year. To assess the impact of year-to-year variability in triglyceride levels on the prevalence estimation, we calculated the prevalence of metabolic syndrome using both absolute and relative criteria for elevated triglycerides. The absolute criterion was triglycerides ≥ 150 mg/dL in all three years, and the relative criterion was the sex-specific highest quartile value in each survey.
RESULTS
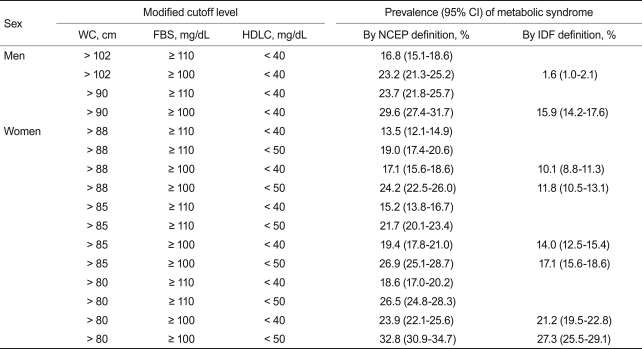
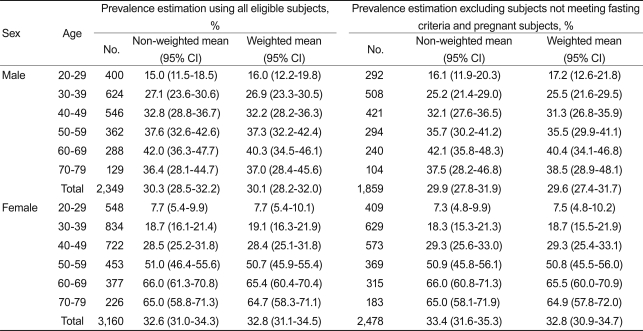
The prevalence of metabolic syndrome varied widely according to the particular definition and modified cutoff points for individual metabolic abnormalities (Table 2). The highest prevalence was 29.6% (95% CI, 27.4 to 31.7) in males and 32.8% (95% CI, 30.9 to 34.7) in females when we used the modified NCEP definition with the Asian-specific waist circumference cutoff (> 90/80 cm for men/women). Sampling weights and exclusion criteria did not significantly affect the prevalence. In a subgroup of 60-69 years old the prevalence of metabolic syndrome differed by 1.7% between unweighted and weighted estimates, but this was not significant (Table 3).
Table 2.
Prevalence of metabolic syndrome in the 2001 Korea National Health and Nutrition Examination Surveys (KNHANES) with modified cutoff levels
Cutoff points for high blood pressure (systolic blood pressure/diastolic blood pressure ≥ 130/85 mmHg) and elevated triglyceride (≥ 150 mg/dL) are constant.
WC, waist circumference; FBS, fasting blood glucose; HDLC, high-density lipoprotein cholesterol; CI, confidence interval; NCEP, National Cholesterol Education Program-Adult Treatment Panel III; IDF, International Diabetes Federation.
Table 3.
Effects of sampling weights and exclusion criteria on the prevalence of metabolic syndrome
Metabolic syndrome was defined according to the revised NCEP criteria with modified waist circumference cutoff points (> 90/80 cm).
CI, confidence interval; NCEP, National Cholesterol Education Program-Adult Treatment Panel III.
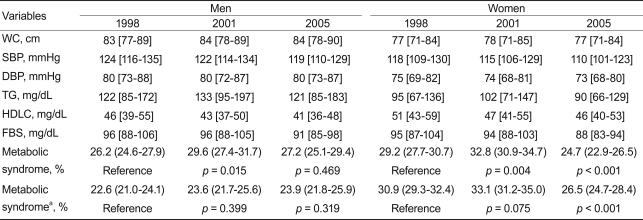
We compared the distributions of individual metabolic variables and prevalence of metabolic syndrome in 1998, 2001, and 2005 (Table 4). Distributions of waist circumference and blood pressure remained relatively stable during this period. Fasting triglyceride levels increased by 11 mg/dL in males and by 7 mg/dL in females between 1998 and 2001, but decreased by 8 mg/dL in males and by 12 mg/dL in females between 2001 and 2005. HDL-cholesterol and fasting glucose levels decreased continuously between 1998 and 2005. The prevalence of metabolic syndrome significantly increased between 1998 and 2001 in both males (26.2-29.6%; p = 0.015) and females (29.2-32.8%; p = 0.004). In 2005, the prevalence in males decreased to a level similar to that of 1998 (27.2%; p = 0.469), and the prevalence among women fell to a level below that in 1998 (24.7%; p < 0.001). However, when the relative criteria defined above were used to establish elevated triglycerides, no significant change in prevalence between 1998 and 2001 was found, and the decrease between 2001 and 2005 was limited to females.
Table 4.
Trends in metabolic syndrome in the 1998, 2001, and 2005 Korea National Health and Nutrition Examination Surveys (KNHANES)
Values are presented as median [25th-75th percentiles] or prevalence (95% CI).
Metabolic syndrome was defined according to the revised NCEP criteria with modified WC cutoff points (> 90/80 cm)
WC, waist circumference; SBP, systolic blood pressure; DBP, diastolic blood pressure; TG, triglyceride; HDLC, high-density lipoprotein cholesterol; FBS, fasting blood glucose; CI, confidence interval; NCEP, National Cholesterol Education Program-Adult Treatment Panel III.
aElevated TG was defined the sex-specific highest quartile in each year.
DISCUSSION
Currently, the most common definitions of metabolic syndrome include that proposed by the NCEP [19], its revised version developed by the American Heart Association and the National Heart, Lung, and Blood Institute (revised NCEP) [21], and the definition proposed by the IDF [20]. These three have been commonly used in Korean studies, with some modifications for Korean populations. Lowered waist circumference cutoff points represent the most common modification, based on the fact that Asians are more vulnerable than Caucasians to cardiovascular disease at a given level of obesity [22,23]. However, Korean data showing the risk for cardiovascular diseases at different waist circumferences are limited, and a standard definition of central obesity for Koreans has not yet been established [24]. The original NCEP definition placed the waist circumference cutoff point at 102/88 cm (for males/females), and it has since been lowered to 90/80 cm [20,21,25] or 90/85 cm [26] for male/female Asians. Our results showed that those modifications significantly changed the estimated prevalence of metabolic syndrome (Table 2). Modified waist-circumference cutoff points especially affect the prevalence of metabolic syndrome based on the IDF definition because this definition requires central obesity as an essential component for the diagnosis of the syndrome [20]. When we used the revised NCEP definition, lowering the waist circumference cutoff points from 102/88 to 90/80 cm increased the prevalence of metabolic syndrome from 23.2 to 29.6% for males and from 24.2 to 32.8% for females. When we used the IDF definition, the same modification caused a much larger increase: from 1.6 to 15.9% for males and from 11.8 to 27.3% for females. Thus, it is important to pay special attention to the diagnosis of central obesity when evaluating reports on the prevalence of metabolic syndrome.
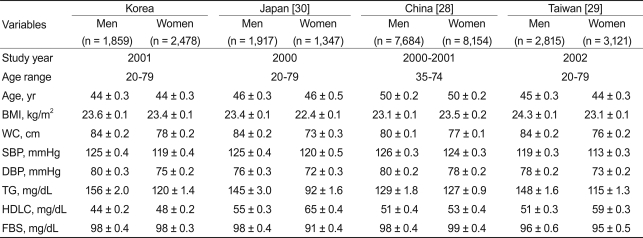
Elevated fasting glucose has been defined as both ≥ 110 and ≥ 100 mg/dL. Lowered cutoff points might increase the metabolic syndrome prevalence estimates by more than 5%. However, as both the revised NCEP and the IDF definitions suggested a threshold of 100 mg/dL [20,21], most recent studies have defined an elevated fasting glucose as 100 mg/dL or higher. The cutoff point for reduced HDL-cholesterol represents an additional issue. Although Koreans have a relatively low prevalence of obesity, the prevalence of metabolic syndrome in Korea has been reported to be similar to that in Western populations. The most important factor contributing to the high prevalence of metabolic syndrome in Korea involves low serum HDL-cholesterol levels. In the 2001 KNHANES, 36.3% of males had HDL-cholesterol < 40 mg/dL, and 58.5% of females had HDL-cholesterol < 50 mg/dL [15]. The NCEP criteria for reduced HDL-cholesterol might not be appropriate for Asian populations, and some studies have used a cutoff for reduced HDL-cholesterol of < 40 mg/dL for both sexes [27,28]. Indeed, HDL-cholesterol levels among Koreans are even lower than those of other East Asian populations [28-30] and show only a small sex difference (Table 5). However, the causes and effects of low HDL-cholesterol among Koreans remain unknown, and the modified cutoff points have not been used in Korean studies.
Table 5.
Mean values of metabolic variables in nationwide surveys conducted in East Asian nations
Values are presented as mean ± standard error.
BMI, body mass index; WC, waist circumference; SBP, systolic blood pressure; DBP, diastolic blood pressure; TG, triglyceride; HDLC, high-density lipoprotein cholesterol; FBS, fasting blood glucose.
Methods of statistical analysis should be clearly described in disease-prevalence studies because the method used also can affect prevalence estimates. First, inclusion and exclusion criteria for the analysis should be considered. In the 1998 and 2001 KNHANES, blood samples were drawn from all eligible participants with their fasting hours recorded. However, in the 2005 KNHANES, participants who had fasted for less than 8 hours were rescheduled for a second visit. Among the participants aged 20-79 years who completed health examinations, 14% in 1998 and 21% in 2001 had fasted for an insufficient period of time or were currently pregnant, but only 3% failed to meet these criteria (i.e., fasting and not pregnant) in 2005. Both insufficient fasting period and pregnancy can lead to overestimation of metabolic syndrome, but they had only minimal effects on the prevalence of metabolic syndrome in our analyses (Table 3). This might be attributed to the fact that a majority (71.3%) of insufficient fasting times fell between six to eight hours, and the pregnancy rate was low. However, these variables may influence the estimates for smaller subgroups, as both insufficient fasting and pregnancy rates depend on age and sex. Second, sampling weights used in some studies should be considered. The KNHANES applied unequal selection probabilities and assigned different sampling weights to each sample unit. Many, but not all, of the KNHANES studies considered the sampling weights to estimate the prevalence of metabolic syndrome. Some studies did not consider sampling weights simply because estimating prevalence was not their primary objective, but even prevalence studies often have not reported whether sampling weights were considered [13,14]. In the present study, the sampling weights did not significantly affect the estimated prevalence of metabolic syndrome. Sampling units and their weights in the KNHANES were related to geographic regions and residential types. Although socioeconomic factors have been associated with metabolic syndrome [18,31-33], regional differences in its prevalence may be too modest to affect national prevalence estimates. Adjustment for age must also be considered, as some studies have reported age-adjusted prevalence [13-16].
Of the individual metabolic variables, triglyceride levels increased and HDL-cholesterol levels decreased between 1998 and 2001, while others (waist circumference, blood pressure, and fasting glucose) remained relatively constant during the same period. The exceptionally high triglyceride level in 2001 might have contributed to the increased prevalence of metabolic syndrome between 1998 and 2001. Thus, we estimated the prevalence of metabolic syndrome using both absolute (150 mg/dL) and relative (75th percentile) cutoffs for determining elevated triglycerides. When we used the absolute criterion, the prevalence of metabolic syndrome increased significantly between 1998 and 2001 and decreased between 2001 and 2005. However, when we used the relative criterion, no significant change was observed in males. In females, the prevalence of metabolic syndrome did not differ between 1998 and 2001, but that in 2005 was lower than the levels in 1998 and 2001. It is reasonable to hypothesize that the reports of the abrupt increase and decrease in metabolic syndrome during this short period resulted, at least in part, from non-standardized laboratory methods for measuring triglycerides.
This study has some limitations. First, we did not assess all factors that could affect the prevalence of metabolic syndrome. For example, Kahn et al. [1] noted that the ambiguity in definitions of individual metabolic abnormalities represented one of the limitations in the concept of metabolic syndrome. Most studies have considered individuals receiving anti-hypertensive treatment as hypertensive; nonetheless, definitions of antihypertensive treatment might differ. The KNHANES included many different variables relating to the treatment of hypertension: known hypertension, physician-diagnosed hypertension, otherwise-diagnosed hypertension, overall anti-hypertensive treatment, treatment within last two weeks, frequency of treatment, pharmacologic treatment, and non-pharmacologic treatment. Thus, treated hypertension can be defined in many different ways, and the different definitions may affect identification of people with high blood pressure. Although the same cutoff point is used, a man with waist circumference 90 cm would be considered centrally obese in some studies [2,5,7,11,13,15,16] but normal in others [8-10,14]. However, these factors are unlikely to have a significant impact on studies, such as KNHANES, with large sample sizes. Second, the comparisons between years covered in this study might be inappropriate because our analyses were based primarily on three different cross-sectional surveys. Although the methodology of the KNHANES has been generally similar over time, changes in survey methods and participating institutions have also occurred. Third, this study compared different definitions of metabolic syndrome and individual metabolic abnormalities but could not suggest which definitions are appropriate for Korean populations.
In summary, the disparate reports of the prevalence of metabolic syndrome in Korea are due primarily to differing definitions of the syndrome and modified criteria for individual metabolic abnormalities. Non-standardized laboratory techniques also can affect estimates of the prevalence of metabolic syndrome. Different statistical methods and exclusion criteria, and ambiguous definitions of individual metabolic abnormalities may also affect such estimates. However, the effects of these factors on overall estimates of prevalence were minimal, at least in regard to the KNHANES. The absence of a standard definition for metabolic syndrome renders estimates and comparisons of the prevalence rate problematic. A consensual definition of metabolic syndrome in Korea is necessary for effective monitoring and management of the syndrome. Unfortunately, insufficient prospective data are available for the development of a Korean-specific definition of metabolic syndrome. Thus, it is important to be aware of the potential causes of different estimates when reporting and interpreting the prevalence of metabolic syndrome. At the same time, prospective studies are needed to define appropriate cutoff points for each metabolic risk factor based on its predictive power.
Acknowledgments
This study analyzed the data provided by the First (1998), Second (2001), and Third (2005) Korean National Health and Nutrition Examination Surveys, which were conducted by the Korea Institute for Health and Social Affairs and the Korea Centers for Disease Control and Prevention. This work was supported by a grant from the Korea Healthcare Technology R&D Project, Ministry of Health and Welfare, Republic of Korea (A102065).
Footnotes
No potential conflict of interest relevant to this article was reported.
References
- 1.Kahn R, Buse J, Ferrannini E, Stern M. The metabolic syndrome: time for a critical appraisal: joint statement from the American Diabetes Association and the European Association for the Study of Diabetes. Diabetologia. 2005;48:1684–1699. doi: 10.1007/s00125-005-1876-2. [DOI] [PubMed] [Google Scholar]
- 2.Park HS, Park CY, Oh SW, Yoo HJ. Prevalence of obesity and metabolic syndrome in Korean adults. Obes Rev. 2008;9:104–107. doi: 10.1111/j.1467-789X.2007.00421.x. [DOI] [PubMed] [Google Scholar]
- 3.Park JS, Park HD, Yun JW, Jung CH, Lee WY, Kim SW. Prevalence of the metabolic syndrome as defined by NCEP-ATPIII among the urban Korean population. Korean J Med. 2002;63:290–298. [Google Scholar]
- 4.Oh JY, Hong YS, Sung YA, Barrett-Connor E. Prevalence and factor analysis of metabolic syndrome in an urban Korean population. Diabetes Care. 2004;27:2027–2032. doi: 10.2337/diacare.27.8.2027. [DOI] [PubMed] [Google Scholar]
- 5.Song J, Kim E, Shin C, et al. Prevalence of the metabolic syndrome among South Korean adults: the Ansan study. Diabet Med. 2004;21:1154–1155. doi: 10.1111/j.1464-5491.2004.01399.x. [DOI] [PubMed] [Google Scholar]
- 6.Kim ES, Han SM, Kim YI, et al. Prevalence and clinical characteristics of metabolic syndrome in a rural population of South Korea. Diabet Med. 2004;21:1141–1143. doi: 10.1111/j.1464-5491.2004.01398.x. [DOI] [PubMed] [Google Scholar]
- 7.Lee WY, Park JS, Noh SY, Rhee EJ, Kim SW, Zimmet PZ. Prevalence of the metabolic syndrome among 40,698 Korean metropolitan subjects. Diabetes Res Clin Pract. 2004;65:143–149. doi: 10.1016/j.diabres.2003.12.007. [DOI] [PubMed] [Google Scholar]
- 8.Kwon HS, Park YM, Lee HJ, et al. Prevalence and clinical characteristics of the metabolic syndrome in middle-aged Korean adults. Korean J Intern Med. 2005;20:310–316. doi: 10.3904/kjim.2005.20.4.310. [DOI] [PMC free article] [PubMed] [Google Scholar]
- 9.Choi SH, Ahn CW, Cha BS, et al. The prevalence of the metabolic syndrome in Korean adults: comparison of WHO and NCEP criteria. Yonsei Med J. 2005;46:198–205. doi: 10.3349/ymj.2005.46.2.198. [DOI] [PMC free article] [PubMed] [Google Scholar]
- 10.Yoon YS, Oh SW, Baik HW, Park HS, Kim WY. Alcohol consumption and the metabolic syndrome in Korean adults: the 1998 Korean National Health and Nutrition Examination Survey. Am J Clin Nutr. 2004;80:217–224. doi: 10.1093/ajcn/80.1.217. [DOI] [PubMed] [Google Scholar]
- 11.Kim MH, Kim MK, Choi BY, Shin YJ. Prevalence of the metabolic syndrome and its association with cardiovascular diseases in Korea. J Korean Med Sci. 2004;19:195–201. doi: 10.3346/jkms.2004.19.2.195. [DOI] [PMC free article] [PubMed] [Google Scholar]
- 12.Park HS, Oh SW, Cho SI, Choi WH, Kim YS. The metabolic syndrome and associated lifestyle factors among South Korean adults. Int J Epidemiol. 2004;33:328–336. doi: 10.1093/ije/dyh032. [DOI] [PubMed] [Google Scholar]
- 13.Park HS, Lee SY, Kim SM, Han JH, Kim DJ. Prevalence of the metabolic syndrome among Korean adults according to the criteria of the International Diabetes Federation. Diabetes Care. 2006;29:933–934. doi: 10.2337/diacare.29.04.06.dc06-0069. [DOI] [PubMed] [Google Scholar]
- 14.Lim S, Park KS, Lee HK, Cho SI Korean National Health and Nutrition Examination Surveys. Changes in the characteristics of metabolic syndrome in Korea over the period 1998-2001 as determined by Korean National Health and Nutrition Examination Surveys. Diabetes Care. 2005;28:1810–1812. doi: 10.2337/diacare.28.7.1810. [DOI] [PubMed] [Google Scholar]
- 15.Park HS, Kim SM, Lee JS, et al. Prevalence and trends of metabolic syndrome in Korea: Korean National Health and Nutrition Survey 1998-2001. Diabetes Obes Metab. 2007;9:50–58. doi: 10.1111/j.1463-1326.2005.00569.x. [DOI] [PubMed] [Google Scholar]
- 16.Choi KM, Kim SM, Kim YE, et al. Prevalence and cardiovascular disease risk of the metabolic syndrome using National Cholesterol Education Program and International Diabetes Federation definitions in the Korean population. Metabolism. 2007;56:552–558. doi: 10.1016/j.metabol.2006.12.003. [DOI] [PubMed] [Google Scholar]
- 17.Kim HM, Kim DJ, Jung IH, Park C, Park J. Prevalence of the metabolic syndrome among Korean adults using the new International Diabetes Federation definition and the new abdominal obesity criteria for the Korean people. Diabetes Res Clin Pract. 2007;77:99–106. doi: 10.1016/j.diabres.2006.10.009. [DOI] [PubMed] [Google Scholar]
- 18.Park MJ, Yun KE, Lee GE, Cho HJ, Park HS. A cross-sectional study of socioeconomic status and the metabolic syndrome in Korean adults. Ann Epidemiol. 2007;17:320–326. doi: 10.1016/j.annepidem.2006.10.007. [DOI] [PubMed] [Google Scholar]
- 19.Expert Panel on Detection, Evaluation, and Treatment of High Blood Cholesterol in Adults. Executive Summary of The Third Report of The National Cholesterol Education Program (NCEP) Expert Panel on Detection, Evaluation, And Treatment of High Blood Cholesterol In Adults (Adult Treatment Panel III) JAMA. 2001;285:2486–2497. doi: 10.1001/jama.285.19.2486. [DOI] [PubMed] [Google Scholar]
- 20.Alberti KG, Zimmet P, Shaw J. Metabolic syndrome--a new world-wide definition: a Consensus Statement from the International Diabetes Federation. Diabet Med. 2006;23:469–480. doi: 10.1111/j.1464-5491.2006.01858.x. [DOI] [PubMed] [Google Scholar]
- 21.Grundy SM, Cleeman JI, Daniels SR, et al. Diagnosis and management of the metabolic syndrome: an American Heart Association/National Heart, Lung, and Blood Institute Scientific Statement. Circulation. 2005;112:2735–2752. doi: 10.1161/CIRCULATIONAHA.105.169404. [DOI] [PubMed] [Google Scholar]
- 22.Wang J, Thornton JC, Russell M, Burastero S, Heymsfield S, Pierson RN., Jr Asians have lower body mass index (BMI) but higher percent body fat than do whites: comparisons of anthropometric measurements. Am J Clin Nutr. 1994;60:23–28. doi: 10.1093/ajcn/60.1.23. [DOI] [PubMed] [Google Scholar]
- 23.Deurenberg P, Deurenberg-Yap M, Guricci S. Asians are different from Caucasians and from each other in their body mass index/body fat per cent relationship. Obes Rev. 2002;3:141–146. doi: 10.1046/j.1467-789x.2002.00065.x. [DOI] [PubMed] [Google Scholar]
- 24.Lee IK. The prevalence and clinical characteristics of the metabolic syndrome in Korean adults. Korean J Med. 2005;68:350–353. doi: 10.3904/kjim.2005.20.4.310. [DOI] [PMC free article] [PubMed] [Google Scholar]
- 25.Tan CE, Ma S, Wai D, Chew SK, Tai ES. Can we apply the National Cholesterol Education Program Adult Treatment Panel definition of the metabolic syndrome to Asians? Diabetes Care. 2004;27:1182–1186. doi: 10.2337/diacare.27.5.1182. [DOI] [PubMed] [Google Scholar]
- 26.Lee SY, Park HS, Kim DJ, et al. Appropriate waist circumference cutoff points for central obesity in Korean adults. Diabetes Res Clin Pract. 2007;75:72–80. doi: 10.1016/j.diabres.2006.04.013. [DOI] [PubMed] [Google Scholar]
- 27.He J, Gu D, Reynolds K, et al. Serum total and lipoprotein cholesterol levels and awareness, treatment, and control of hypercholesterolemia in China. Circulation. 2004;110:405–411. doi: 10.1161/01.CIR.0000136583.52681.0D. [DOI] [PubMed] [Google Scholar]
- 28.Gu D, Reynolds K, Wu X, et al. Prevalence of the metabolic syndrome and overweight among adults in China. Lancet. 2005;365:1398–1405. doi: 10.1016/S0140-6736(05)66375-1. [DOI] [PubMed] [Google Scholar]
- 29.Hwang LC, Bai CH, Chen CJ. Prevalence of obesity and metabolic syndrome in Taiwan. J Formos Med Assoc. 2006;105:626–635. doi: 10.1016/S0929-6646(09)60161-3. [DOI] [PubMed] [Google Scholar]
- 30.Arai H, Yamamoto A, Matsuzawa Y, et al. Prevalence of metabolic syndrome in the general Japanese population in 2000. J Atheroscler Thromb. 2006;13:202–208. doi: 10.5551/jat.13.202. [DOI] [PubMed] [Google Scholar]
- 31.Kim MH, Kim MK, Choi BY, Shin YJ. Educational disparities in the metabolic syndrome in a rapidly changing society: the case of South Korea. Int J Epidemiol. 2005;34:1266–1273. doi: 10.1093/ije/dyi175. [DOI] [PubMed] [Google Scholar]
- 32.Lim S, Jang HC, Lee HK, Kimm KC, Park C, Cho NH. A rural-urban comparison of the characteristics of the metabolic syndrome by gender in Korea: the Korean Health and Genome Study (KHGS) J Endocrinol Invest. 2006;29:313–319. doi: 10.1007/BF03344102. [DOI] [PubMed] [Google Scholar]
- 33.Jung CH, Park JS, Lee WY, Kim SW. Effects of smoking, alcohol, exercise, level of education, and family history on the metabolic syndrome in Korean adults. Korean J Med. 2002;63:649–659. [Google Scholar]


