Abstract
According to the quality of response they mediate, autoreactive T cells recognizing islet β cell peptides could represent both disease effectors in the development of type 1 diabetes (T1DM) and directors of tolerance in nondiabetic individuals or those undergoing preventative immunotherapy. A combination of the rarity of these cells, inadequate technology, and poorly defined epitopes, however, has hampered examination of this paradigm. We have identified a panel of naturally processed islet epitopes by direct elution from APCs bearing HLA-DR4. Employing these epitopes in a sensitive, novel cytokine enzyme-linked immunosorbent spot assay, we show that the quality of autoreactive T cells in patients with T1DM exhibits extreme polarization toward a proinflammatory Th1 phenotype. Furthermore, we demonstrate that rather than being unresponsive, the majority of nondiabetic, HLA-matched control subjects also manifest a response against islet peptides, but one that shows extreme T regulatory cell (Treg, IL-10–secreting) bias. We conclude that development of T1DM depends on the balance of autoreactive Th1 and Treg cells, which may be open to favorable manipulation by immune intervention.
Introduction
Type 1 diabetes (T1DM) is the result of the immune-mediated destruction of insulin-secreting pancreatic β cells (1). It is widely assumed that this process is orchestrated by autoreactive T cells, but to date these disease effectors have been difficult to identify in humans and therefore remain poorly characterized. Studying the natural history of islet autoreactive T cells is an important research goal for several reasons, not least of which is because it represents our best chance of deciphering the underlying disease process. In addition, however, there is a further research impetus. Therapeutic intervention trials in patients with T1DM and those at risk of the disease are fast becoming a major focus for clinical research (2–5), so the need for disease markers that represent islet-damaging or islet-protective events, such as numbers and phenotype of circulating islet autoreactive T cells, has become more urgent.
In terms of distinguishing pathological from protective responses, it has been proposed that proinflammatory (type 1) T cell immunity is responsible for islet damage, while humoral (type 2) immunity may be protective, or at least benign (6). These speculations are largely based on studies in animal models, however, and even then the findings have not always been consistent with the hypothesis (7, 8). In addition, it is proposed that naturally arising, regulatory T cell populations are available to curb autoimmune potential (9), but as yet there is no evidence for islet antigen-specific regulatory cell populations existing in humans. Obtaining answers to these key questions has been hampered by technical difficulties, since the constraints on assay design for the detection of islet autoreactive T cells are considerable. Studies can only make use of peripheral blood, in which islet autoreactive T cells are likely to be rare, so assays must be highly sensitive. Ideally, in the context of therapeutic intervention trials using immune modulators, the readout for islet autoreactive T cells should represent a phenotype relevant to ongoing islet inflammation or the restoration of tolerance. Finally, to achieve accurate enumeration of responder cells, assays should avoid in vitro expansion steps.
The cytokine enzyme-linked immunosorbent spot (ELISPOT) assay has many of the requisite qualities (10). Detection sensitivities as low as one responder cell per million have been claimed. Various different qualities of the immune response can be analyzed, including types 1, 2, and regulatory responses, through the detection of IFN-γ–, IL-4–, and IL-10–secreting cells, respectively, and each of these cell types may be relevant to T1DM pathogenesis and therapy. The choice of antigenic stimulus is particularly important, however. Detection of rare T cell events is particularly sensitive to nonspecific stimulatory and inhibitory effects mediated by impurities present in whole antigen preparations (11, 12). Synthetic peptides are preferable since they can be obtained in highly purified form, and ideally only those peptides known to be displayed by APCs after natural processing of intact autoantigen should be used. To gather this level of information in relation to islet autoantigens, we previously developed an approach for the identification of naturally processed epitopes in which they are eluted directly from antigen-pulsed APCs (13). Initially, we focused on identification of natural epitopes of a single islet autoantigen, insulinoma associated-2 (IA-2), but in the present study we reasoned that enhanced discrimination between disease and tolerance in a T cell assay could be achieved by the use of multiple peptides from multiple islet autoantigens. In some senses this approach is the natural extension of the well-established use of multiple autoantibody specificities to identify individuals at-risk for T1DM (14).
First, therefore, we extended our autoantigenic peptide repertoire by identifying additional naturally processed proinsulin (PI) peptides presented by HLA-DR4, one of the class II HLA molecules associated with T1DM development (15). These novel PI epitopes were combined with IA-2 peptides identified previously to create a multiepitope, multiantigen panel to study proinflammatory (Th1), inflammatory (Th2), and anti-inflammatory (T regulatory, or Treg) cytokine–secreting T cells, to examine whether the Th1 paradigm of T1DM pathogenesis is upheld, and to determine whether there is evidence for a state of IL-10–mediated tolerance in nondiabetic individuals.
Methods
Subjects.
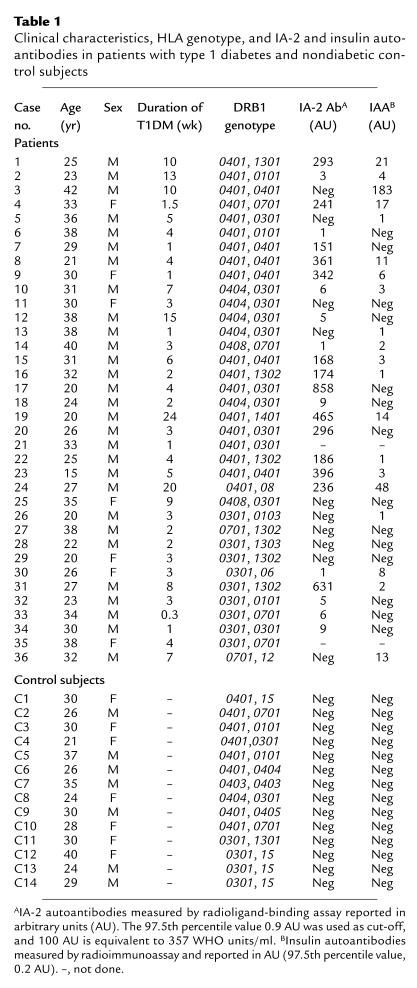
Fresh heparinized and clotted blood samples were obtained from 36 Caucasian type 1 diabetes mellitus (DM) patients with acute onset of symptoms requiring insulin from the time of diagnosis and 14 healthy Caucasian nondiabetic control subjects without a history of first-degree relatives with type 1 DM matched for age and HLA type (Table 1). Fresh PBMCs were isolated on density gradients (Lymphoprep; Nycomed Pharma, Oslo, Norway) and washed in RPMI-1640 (Life Technologies Ltd., Paisley, United Kingdom) twice before use. Autoantibodies against IA-2 and insulin were detected by immunoprecipitation as described (16). These studies were carried out with the approval of the Local Research Ethics Committee, and informed consent was obtained from all participants.
Table 1.
Clinical characteristics, HLA genotype, and IA-2 and insulin autoantibodies in patients with type 1 diabetes and nondiabetic control subjects
Identification of peptides of PI naturally processed and presented by HLA-DR4.
The procedure for identification of naturally processed and presented peptide epitopes (NPPEs) was similar to that described previously (13). The cDNA representing the entire sequence of pre-PI (obtained from D.F. Steiner, University of Chicago, Chicago, Illinois, USA) was cloned into a pET-12a vector (Novagen Inc., Madison, Wisconsin, USA) modified to include a 6-histidine purification tag and biotinylation sequence at the 5′ end. It was then transformed into BLR(DE3)pLysS–competent cells (Novagen Inc.) for expression and purification under denaturing conditions, followed by refolding using a glutathione redox reaction (17) and confirmation of correct folding by analysis of V8 protease-digestion products (18). Recombinant PI was delivered to the surface of APCs (Priess EBV-transformed B cells obtained from the UK Transplant Service, Bristol, United Kingdom) and homozygous for the type 1 DM-permissive DRB1*0401, [DR4/DRw53], DQA1*0301/DQB1*0302 [DQ8] genotype) and HLA-DR4 purified (13). Naturally processed peptide repertoires were acid eluted, separated by reverse-phase HPLC, and mass spectra collected for each 1-minute fraction at optimum laser intensities in reflector mode using a time-of-flight mass spectrometer (Voyager Elite; PerSeptive Biosystems, Framingham, Massachusetts, USA) with both internal and external calibration.
Synthetic peptides and peptide-binding assays.
Peptides representing NPPEs of IA-2 and PI were synthesized by standard Fmoc chemistry (Interactiva Biotechnologie GmbH, Ulm, Germany) to more than 90% purity using reverse-phase HPLC and mass spectrometry. The following IA-2 peptides were used: 652-680 SRVSSVSSQFSDAAQASPSSHSSTPSWCE; 709-736 LAKEWQALCAYQAEPNTCATAQGEGNIK; 752-775 KLKVESSPSRSDYINASPIIEHDP; 793-817 DFWQMVWESGCTVIVMLTPLVEDGV; 853-872 SFYLKNVQTQETRTLTQFHF; 955-976 SKDQFEFALTAVAEEVNAILKA. Synthetic PI peptides were assessed for their ability to bind soluble HLA-DR4 in vitro in a direct competition binding assay against a biotinylated indicator peptide (98-117 of the MHC class II invariant chain) (19). Binding affinity was expressed as IC50, determined as that required to inhibit binding of 2.5 μM biotinylated indicator peptide 50%.
In addition, we used a set of seven peptides as controls for the specificity of the T cell response. These peptides included the promiscuous HLA-DR–binding MHC class II invariant chain peptide, residues 98-117 PKPPKPVSKMRMATPLLMQA, and six non-autoantigenic peptides, of which three are promiscuous HLA-DR–binding peptides and common T cell epitopes from tetanus toxin, NNFTVSWLRVPKVSASHLEQ, RDIIDDFTNESSQKTT, and YIKANSKFIGITELK (20). Also included are peptides from the Coxsackievirus B4 P2C protein 55-75 LLESQIATIEQSAPSQSDQEQ, 133-154 AGKSVATNLIGRSLAEKLNSSV, and 191-213 CQMVSSVDFVPPMAALEEKGILF, identified as having good binding properties for HLA-DR4 (IC50 values 8.2, 2.1, and 0.3 μM, respectively; R.J. Ellis and M. Peakman, unpublished observations).
Cytokine ELISPOT analysis.
Fresh PBMCs were dispensed into 48-well plates at a density of 2 × 10⁶ in 0.5 ml in RPMI-1640 supplemented with antibiotics (TC medium; Life Technologies Ltd.) and 10% human AB serum (Harlan Sera-Lab Ltd., Leicestershire, United Kingdom) supplemented with peptide to a final concentration of 10 μM and incubated at 37°C, 5% CO2, tilted by 5°. Control wells contained TC medium with an equivalent concentration of peptide diluent alone (DMSO), tetanus toxoid (final concentration, 100 ng/ml), or PMA/ionomycin (5 ng/ml and 745 ng/ml final concentrations, respectively). In some assays, to examine the nature of the responder cells, PBMCs were cultured as above or depleted of CD4 T cells by positive selection (Miltenyi Biotech, Surrey, United Kingdom). CD4-depleted PBMCs were typically more than 97% non-CD4 cells. On day +1, 0.5 ml prewarmed TC medium/10% AB serum was added, and on day +2, nonadherent cells were resuspended using prewarmed TC medium/2% AB serum, washed, brought to a concentration of 106/300 μl, and 100 μl dispensed in triplicate into wells of 96-well ELISA plates (Nunc Maxisorp; Merck Ltd., Poole, United Kingdom) preblocked with 1% BSA in PBS and precoated with monoclonal anti–IFN-γ, anti–IL-10, or anti–IL4 capture Ab (U-Cytech, Utrecht, The Netherlands). When sufficient cells were available, all three cytokines were analyzed for each test peptide, otherwise they were analyzed in the order of IFN-γ, IL-10, IL-4. After capture at 37°C, 5% CO2 for 7 hours, cells were lysed in ice-cold water, plates washed in PBS/Tween 20, and spots developed according to the manufacturer’s instructions. Plates were dried and spots of 80–120 μm counted in a BioReader 3000 (BioSys, Karben, Germany).
This assay demonstrated good performance characteristics in terms of sensitivity and reproducibility in a recent workshop (21). Intra-assay and interassay coefficients of variation for the cytokine ELISPOT assays were evaluated by measuring spot numbers for low-level recall responses using repeated measures within the same assay and repeated measures between assays, using the same donor over a period of 1 year. Low-level tetanus (100 ng/ml) was used as the stimulus. In addition, blood samples from control individuals testing positive for IFN-γ and IL-10 were subject to repeat testing to confirm positivity. Triplicate values were pooled to provide mean (SEM) spots per 300,000 cells, the approximate number of PBMCs from the bulk starter culture for each ELISPOT well. Mean values in test wells were compared with means of the background (DMSO) wells to derive a stimulation index (SI).
Statistical analysis.
Since the cytokine ELISPOT for the detection of autoreactive T cell responses to NPPEs represents a novel assay format, for which criteria for determining positive and negative responses do not exist, we used a conventional approach for identifying appropriate cut-off values. The test’s diagnostic sensitivity (true-positive rate) was plotted against one minus specificity (false-positive rate) for all possible cut-off values, generating a receiver-operator characteristic (ROC) curve (22, 23). By convention, we selected the cut-off value that provides an operating position nearest that of the “perfect test” (i.e., closest approximation to the operating position of 100% sensitivity and 100% specificity in the top left corner of the plot).
The frequency of responses in different clinical groups was compared using Fisher’s exact tests and χ2 analysis. Analyses of the relationship of paired IFN-γ and IL-10 responses and paired T cell and autoantibody responses were carried out using the Wilcoxon signed rank test for pairing. Differences in age of diabetes onset according to the quality of the cytokine response (e.g., IL-10) were compared using the Mann Whitney U test. Correlations between T cell responses and autoantibodies were analyzed using the Spearman rank correlation test.
Results
Identification of PI peptides naturally processed and presented by HLA-DR4.
We previously developed a direct cellular and biochemical approach to identify naturally processed epitopes of IA-2 presented by HLA-DR4 (B1*0401), relying upon high-efficiency pulsing of APCs with autoantigen using a lectin-based antigen-delivery system (ADS) followed by purification of HLA-DR4 and identification of eluted peptides by high-accuracy mass matching (13). In the present study, 1010 Priess EBV B cells (homozygous HLA-DRB1*0401) were pulsed with recombinant PI and the same number with ADS alone (control preparation). HLA-DR4 was purified from each cell pellet, bound peptides eluted and separated by reverse-phase HPLC, and each of 100 fractions analyzed by matrix-assisted laser desorption time-of-flight mass spectrometry. The mass spectra for the HLA-DR4 peptide repertoire isolated from Priess cells pulsed with PI and the control preparation were compared to identify novel mass-to-charge ratio (m/z) values corresponding to peptides derived from PI.
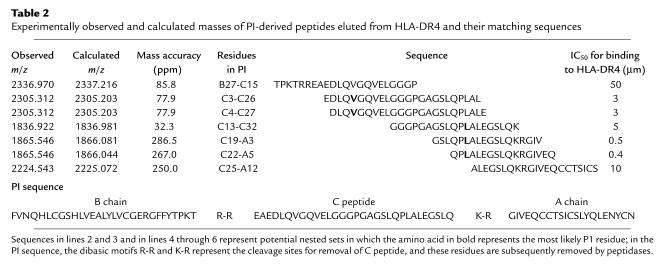
Five masses were identified as being unique to the PI-pulsed peptide preparation corresponding to seven PI sequences (Table 2). All sequences span an extended region of PI from the end of the B chain to the middle of the A chain. The peptides circumscribed two potential nested sets that are characteristic of class II MHC processing (C3-C27 and C13-A5) and contain clear amino acid–binding preferences for HLA-DR4 (B1*0401) (24), confirmed by in vitro binding studies (Table 2). Our aim was to identify naturally processed epitopes unique to the PI molecule for the study of tolerance to β cell–restricted antigens (PI is almost entirely confined in its distribution to the β cell, while insulin and C peptide are more widely distributed secretory products). Only one of the nested sets (C13-A5) fulfills this criterion; its sequences are unique to PI and none is present solely in the mature insulin or C peptide molecules (Table 2). We therefore focused our T cell studies on these three peptides.
Table 2.
Experimentally observed and calculated masses of PI-derived peptides eluted from HLA-DR4 and their matching sequences
Detection of proinflammatory IFN-γ–secreting T cells recognizing naturally processed IA-2 and PI peptides.
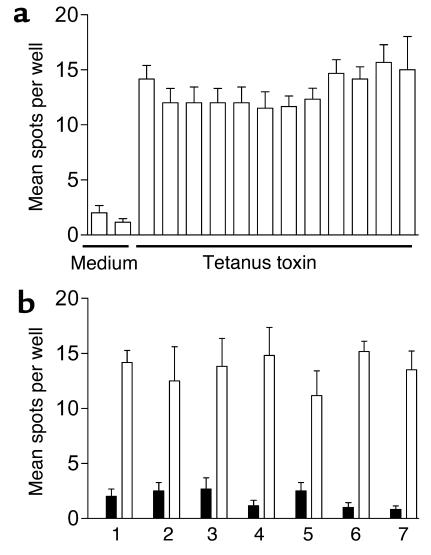
Intra-assay and interassay variability of the cytokine ELISPOT assay on repeated measures is indicated in Figure 1. Coefficients of intra-assay and interassay variability ranged up to 12.3% and 10.7%, respectively. In patients with T1DM and healthy control subjects, spontaneous production of IFN-γ was present at similar, very low levels (median number of spots 3.7, range 0.3–37.3/300,000 cells in T1DM patients and median number 4.7, range 1–14.7/300,000 cells in nondiabetic control subjects, P = NS).
Figure 1.
Reproducibility of cytokine ELISPOT analyses. (a) Intra-assay variability. The same PBMC preparation has been analyzed 12 times on the same sample plate. IFN-γ spot number per well (300,000 cells) is shown for medium and in the presence of 100 ng/ml tetanus toxoid. The intra-assay coefficient of variation for the 12 repeated analyses is 12.3%. (b) Inter-assay variability. The same donor has been venesected on seven separate occasions. IFN-γ spot number per well (300,000 cells) is shown for medium (black bars) and in the presence of 100 ng/ml tetanus toxoid (white bars) for each time point 1–7, representing (time point 1) November 2002, (time points 2–4) three occasions in August 2003, and (time points 5–7) three occasions in September 2003. The interassay coefficient of variation for the seven repeated analyses is 10.2%.
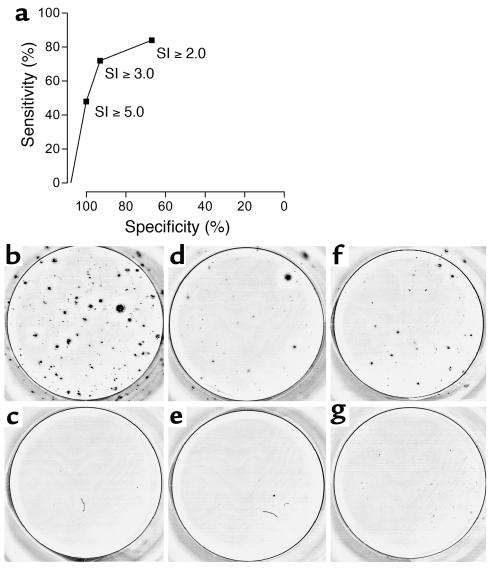
In the presence of test peptides representing six NPPE regions of IA-2 (13) and the three NPPEs from PI (C13-C32, C19-A3, and C22-A5), however, there were major differences in responsiveness between patients and control subjects. To evaluate these differences formally, we first established criteria for determining positive and negative responses in the cytokine ELISPOT assay using the ROC curve approach widely used in the performance of diagnostic tests, including islet cell autoantibodies (22, 23, 25). We used an SI (ratio of mean spot number in the presence of test peptide to mean spot number in the presence of peptide diluent) to enable comparison between patients and control subjects while taking account of background, spontaneous responsiveness. A cut-off of SI ≥ 3.0 provided the greatest sensitivity and specificity in the discrimination of patients from controls, as shown by the ROC plot analysis (Figure 2a).
Figure 2.
(a) Determining a cut-off value for assigning positive and negative ELISPOT responses. Graph represents a ROC plot showing assay diagnostic sensitivity (proportion of true positive tests) against specificity (one minus proportion of false positives) following detection of IFN-γ ELISPOT responses to IA-2 and PI peptides in 36 patients with T1DM and 14 nondiabetic control subjects. For each of various possible cut-off values, the sensitivity (proportion of T1DM cases positive) is plotted against one minus specificity representing the proportion of controls that are positive. SIs were calculated as the ratio of the mean response in the presence of peptide to the mean response in the presence of diluent alone. By convention, we selected the cut-off value that provides an operating position nearest to that of the “perfect test” (i.e., closest approximation to 100% sensitivity and 100% specificity), which was SI ≥ 3.0. (b–g) Representative cytokine ELISPOT responses. (b) Representative strong IFN-γ response to IA-2 peptide compared with background response to (c) diluent alone in a patient with T1DM; (d) representative moderate IFN-γ response to PI peptide compared with background response to (e) diluent alone in a patient with T1DM; (f) representative IL-10 response to IA-2 peptide compared with background response to (g) diluent alone in a non-diabetic control subject.
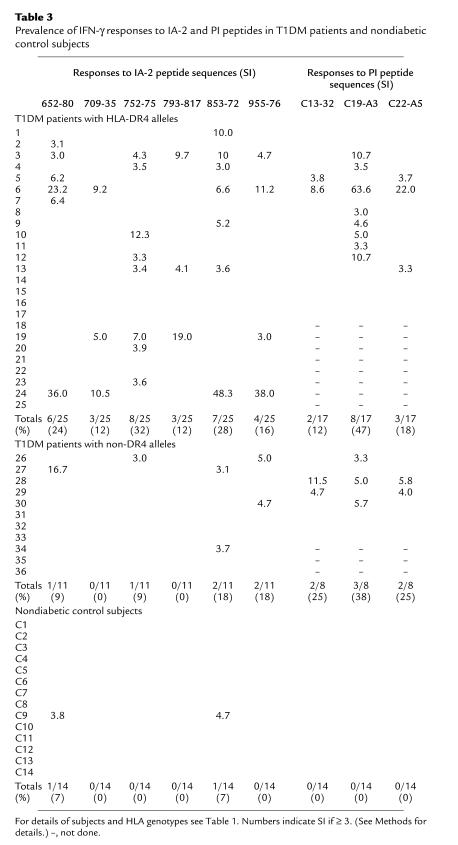
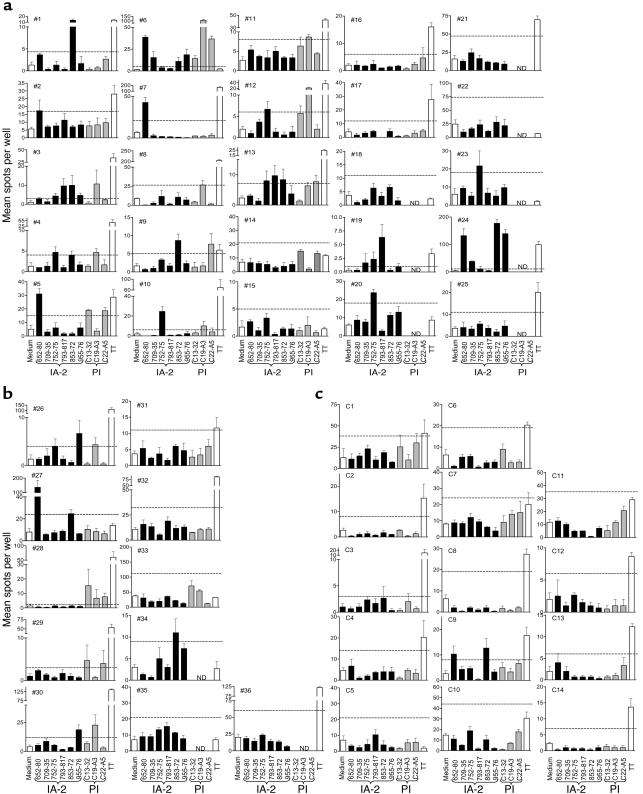
Using this cut-off, IFN-γ responses to IA-2 and PI peptides were seen in the majority of patients with newly diagnosed type 1 DM (Table 3, Figures 2, b–g, and 3). Nineteen of 36 (53%) patients with type 1 DM showed a response to at least one IA-2 peptide, compared with 1 of 14 (7%) HLA-matched nondiabetic control subjects (P = 0.0035). Positivity in the nondiabetic control subject was confirmed on repeat testing after 1 month. In addition, 14 of 25 patients (56%) with type 1 DM tested against PI peptides demonstrated a positive response to one or more peptides, compared with none of 14 nondiabetic control subjects tested (P = 0.0004).
Table 3.
Prevalence of IFN-γ responses to IA-2 and PI peptides in T1DM patients and nondiabetic control subjects
Figure 3.
IFN-γ ELISPOT analyses in response to medium alone, six IA-2 peptides, three PI peptides, and tetanus toxoid (TT) for each patient with T1DM and each nondiabetic control subject. Each graph shows mean (SEM) of triplicate wells for each analysis on each subject (nos. 1–36 and C1–C14). Horizontal dashed line represents cut-off of positivity (SI ≥ 3.0 when compared with diluent alone). (a) T1DM patients with at least one HLA-DR4 allele. (b) T1DM patients with non-DR4 alleles. (c) Nondiabetic control subjects. See Table 1 for case identifiers, HLA types, and clinical characteristics of the subjects. ND, not done.
By far the greatest discrimination between patients and control subjects, however, was seen when the analyses of responses to IA-2 and PI were combined, since no single epitope of either autoantigen stood out as being clearly discriminatory. Among the 25 patients tested against both IA-2 and PI peptide panels, an IFN-γ response to at least one peptide was seen in 18 of 25 (72%) T1DM patients, compared with 1 of 14 (7%) nondiabetic control subjects (P = 0.0001). This increase in diagnostic sensitivity was not achieved at the loss of specificity, since none of the nondiabetic control subjects made IFN-γ responses to any of the PI peptides.
Overall, responses to the IA-2 and PI peptides, which had been identified by elution from HLA-DR4, tended to be higher in patients with at least one HLA-DR4–encoding allele. Thus, 15 of 25 (60%) and 10 of 17 (59%) patients with at least one HLA-DR4 molecule responded to at least one IA-2 or PI peptide, respectively, compared with 4 of 11 (36%) and 4 of 8 (50%) patients with non-DR4 alleles. Similarly, the prevalence of responses to either peptide panel was greater among those patients with at least one HLA-DR4 allele (13 of 17, 76%) compared with those with non-DR4 alleles (5 of 8, 63%), although none of these trends were significant with the numbers of cases tested in this study.
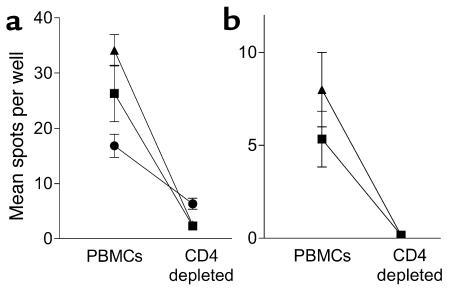
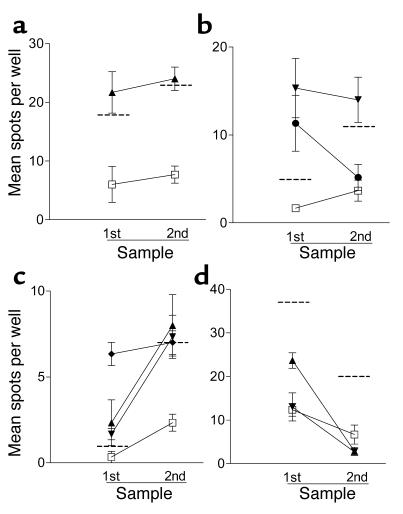
Additional studies were carried out using samples from four T1DM subjects with islet peptide-reactive T cells to examine the nature of the responding cells. Positive responses (SI ≥ 3.0) were entirely abolished when PBMCs were depleted of CD4 T cells, indicating that the autoreactive T cells detected are CD4+ (Figure 4). In addition, we were able to examine the persistence of IFN-γ T cell responses in an additional four T1DM patients (all DRB1*0401) from whom a second blood sample was available 15–23 weeks after the first was taken (Figure 5). In three patients there was a positive IFN-γ T cell response (SI ≥ 3.0) to at least one IA-2 peptide in the first sample. In two of these patients, the positive responses remained, while in the third the response to one peptide persisted and the response to the other declined. The fourth patient showed no response in either sample. These results indicate that, when present, proinflammatory autoreactive T cell responses have a tendency to persist during the first months after diagnosis.
Figure 4.
Cytokine ELISPOT responses to islet peptides are mediated by CD4 T cells. (a and b) Representative analyses from two T1DM patients positive (SI > 3.0) for IFN-γ responses to the IA-2 peptides 709–735 (triangles), 752–775 (squares), and PI peptide C19-A3 (circles), in which peptides were cultured with entire PBMCs or PBMCs immunomagnetically depleted of CD4 T cells before the ELISPOT analysis. (a) Background (medium alone) responses for the patients were 5.3 ± 1.9 spots per well (mean ± SEM) and (b) 1.3 ± 0.6 spots per well. In both subjects positive responses are reduced to background levels by CD4 depletion.
Figure 5.
Persistence of T cell responses. (a–d) Blood samples were available from four patients on two occasions 15–23 weeks apart for detection of IFN-γ T cell response using ELISPOT analysis. Shown are mean (± SEM) spots per well for the first and second samples. (a–c) Second samples were tested only against selected peptides positive in the first sample. (d) Two peptides for retesting were selected at random. Background (peptide diluent plus media alone) is represented by the open squares, and the dashed horizontal line represents the cut-off for positivity in each assay (SI ≥ 3). (a) The patient responds to IA-2752–775 (triangles) on both occasions. (b) The patient responds to IA-2709–735 (inverted triangles) in both samples, but the response to IA-2853–872 (circles) declines. (c) The patient responds to IA-2752–775, IA-2709–735, and IA-2793–817 (diamonds) on both occasions. (d) The patient shows no response to IA-2709–735 or IA-2752–775 in either sample.
All cases and control subjects showed a detectable and significant IFN-γ response to stimulation with the polyclonal T cell stimulus PMA/ionomycin (data not shown), and the frequency and magnitude of these responses were similar in all groups. Similarly, a majority of patients (25 of 36, 69%) and control subjects (10 of 14, 71%) showed positive responses to a single, fixed concentration of tetanus toxoid (Figure 3). IFN-γ responses, in terms of spot number and SI, against a panel of seven control peptides from MHC class II invariant chain, tetanus toxin, and Coxsackievirus B4 P2C protein were similar in patients (n = 20) and control subjects (n = 14) (data not shown).
Detection of regulatory IL-10–secreting T cells recognizing naturally processed IA-2 and PI peptides.
Spontaneous production of IL-10 was similar in patients with T1DM (median number of spots 5 and range 0.3–102/300,000 cells) and nondiabetic control subjects (median number of spots5.7 and range 0.3–136/300,000 cells, P = NS).
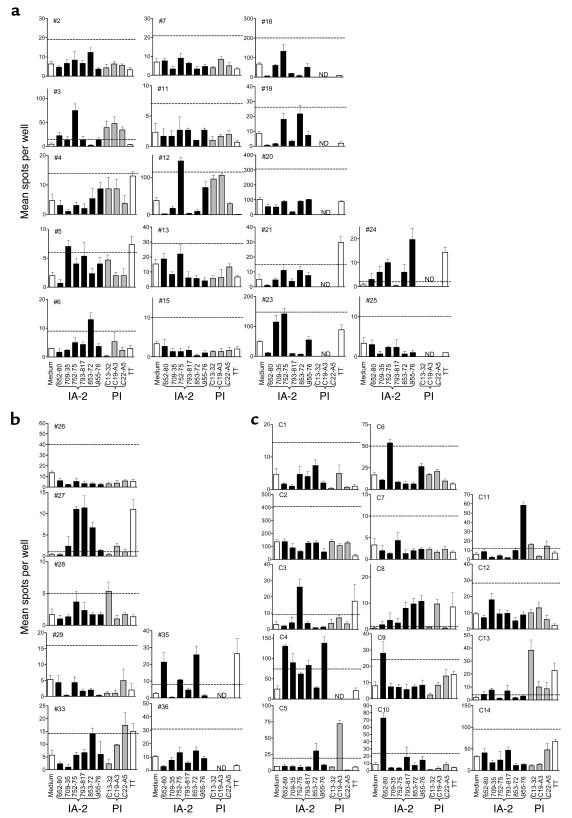
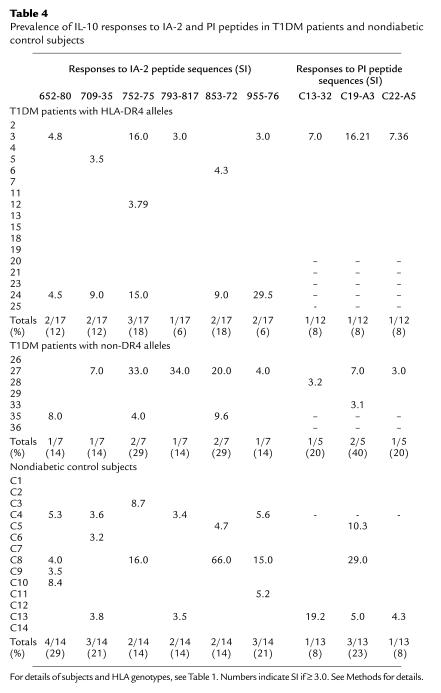
A striking finding was that more than half of the nondiabetic control subjects (9 of 14, 64%) made IL-10 responses to IA-2 peptides, compared with a minority of patients with newly diagnosed T1DM (7 of 24, 29%, P < 0.05; Figure 6, Table 4). These responses were frequently directed against multiple epitopes and were of considerable magnitude. Repeated testing 1 month later in four of the nondiabetic control subjects showed that the IL-10 response was reproducible over time (i.e., four of four subjects showed responses classed as positive, SI ≥ 3.0, to the same peptides as in the original assay). Extending this comparison, we noted that the majority of patients with T1DM making IL-10 responses to IA-2 peptides also made IFN-γ responses to the same or another peptide, whereas nondiabetic control subjects making IL-10 responses did so almost entirely in the absence of IFN-γ production. Only two patients with T1DM (no. 33 and no. 35) out of a total of 24 tested (8%) made an isolated IL-10 response to IA-2 peptides, compared with 8 of 14 (57%) of nondiabetic control subjects (P = 0.0019).
Figure 6.
IL-10 ELISPOT analyses in response to medium alone, six IA-2 peptides, three PI peptides, and tetanus toxoid (TT) for patients with T1DM and each nondiabetic control subject. Each graph shows mean (SEM) of triplicate wells for each analysis on each subject (no. 1–36 and C1–C14). Horizontal dashed line represents cut-off of positivity (SI ≥ 3.0 when compared with diluent alone). (a) T1DM patients with at least one HLA-DR4 allele. (b) T1DM patients with non-DR4 alleles. (c) Nondiabetic control subjects. See Table 1 for case identifiers, HLA types, and clinical characteristics of the subjects.
Table 4.
Prevalence of IL-10 responses to IA-2 and PI peptides in T1DM patients and nondiabetic control subjects
Fewer patients and control subjects were tested for IL-10 responses to PI peptides, but among patients, 4 of 17 (24%) responded to PI peptides by IL-10 production, compared with 3 of 13 (25%) nondiabetic control subjects. Of 17 patients tested for IL-10 responses to both peptide panels, 6 (35%) responded to at least one peptide, compared with 8 of 13 nondiabetic control subjects (62%).
Summarizing these data on IL-10 responses, there is a clear trend for an IL-10 response against IA-2 peptides to discriminate between patients and control subjects (P < 0.05). This trend remains for combined anti–IA-2 and anti–PI responses (P = 0.08) when only the HLA-DR4 cases and controls are considered (consistent with DR4-eluted peptides being more discriminatory among DR4 subjects). IL-10 responses to PI appear nondiscriminatory, although fewer cases were studied.
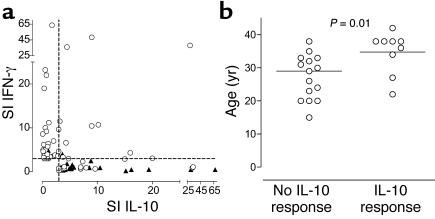
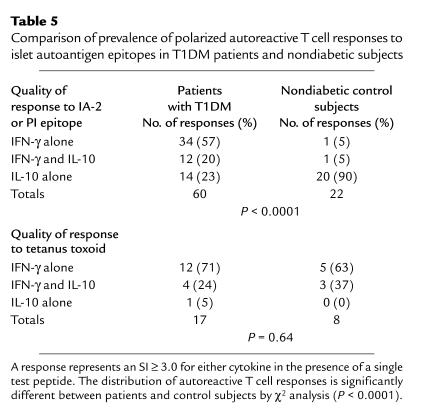
To examine the nature of the relationship between IL-10 and IFN-γ responses to IA-2 and PI peptides in patients and control subjects further, we plotted the SI for each cytokine when a positive peptide response was observed (SI ≥ 3.0 for IFN-γ or IL-10). These results demonstrated a highly significant inverse correlation between responses represented by each of these cytokines (Figure 7a; P = 0.000004), indicating that in the context of an autoreactive T cell response there is extreme polarization of proinflammatory versus regulatory autoreactivity. Moreover, while patients with T1DM were clustered close to the y axis, nondiabetic control subjects were distributed along the x axis, highlighting the association of the disease and tolerant states with proinflammatory and potentially anti-inflammatory or regulatory responses, respectively. In contrast, there was no inverse correlation between IFN-γ and IL-10 responses to tetanus toxoid (P = 0.64). This tendency to make either polarized Th1 or regulatory T cell responses to naturally processed and presented IA-2 and PI epitopes provides a clear distinction in the quality of autoreactivity between T1DM patients and nondiabetic subjects (Table 5; P < 0.0001).
Figure 7.
(a) Polarization of autoreactive T cell responses to IA-2 and PI peptides in patients with T1DM (open circles) and nondiabetic control subjects (closed triangles). For any given positive peptide response (SI ≥ 3.0 for IFN-γ or IL-10), the SI for each cytokine has been plotted. There is a highly significant inverse correlation between responses represented by each of these cytokines (P = 0.000004), indicating extreme polarization of proinflammatory and regulatory autoreactivity. Patients with T1DM are clustered close to the y axis, and nondiabetic control subjects are distributed along the x axis, indicating the association of disease and tolerant states with proinflammatory and regulatory responses, respectively. (b) Relationship between age at onset of T1DM and production of IL-10 in response to peptides of IA-2 and PI. Of 24 patients tested, those making IL-10 responses are significantly older (P = 0.01).
Table 5.
Comparison of prevalence of polarized autoreactive T cell responses to islet autoantigen epitopes in T1DM patients and nondiabetic subjects
All cases and control subjects showed a detectable and significant IL-10 response to stimulation with the polyclonal T cell stimulus PMA/ionomycin (data not shown), and the frequency and magnitude of these responses were similar in both groups. Similarly, a minority of patients (5 of 24, 21%) and control subjects (3 of 14, 21%) showed positive responses to a single fixed concentration of tetanus toxoid (data not shown). IL-10 responses, in terms of spot number and SI, against a panel of seven control peptides from MHC class II invariant chain, tetanus toxin, and Coxsackievirus B4 P2C protein were similar in patients (n = 20) and control subjects (n = 14) (data not shown).
Relationship between autoreactive T cells, age at onset, and autoantibodies.
We made the intriguing finding that patients with T1DM who made IL-10 responses to either IA-2 or PI tended to be significantly older at diagnosis of disease than those who did not (P = 0.01; Figure 7b), suggesting that this quality of response is associated with a later disease onset.
Perhaps not surprisingly, given the high prevalence of both islet cell autoantibodies and T cell autoreactivity in the patient cohort, we did not see any clear correlation, inverse or otherwise, between levels of autoantibodies and T cell reactivity (IFN-γ or IL-10) to NPPEs of IA-2 and PI.
Detection of IL-4–secreting T cells recognizing naturally processed IA-2 and PI peptides.
Despite the fact that IL-4–secreting cells were clearly detectable by ELISPOT in response to the polyclonal stimulus PMA/ionomycin and tetanus toxoid, spots in the presence of NPPE peptides were rare, and no increased responses were detected in patients or control subjects.
Discussion
In the present study we report that in the context of the prototypic organ-specific autoimmune disease, type 1 diabetes, a clear distinction can be made between the tolerant and disease states and that these differences can be directly observed using peripheral blood. Autoreactive T cells in T1DM patients show a polarization toward IFN-γ production, whereas in the nondiabetic state autoreactive T cells are present, but polarized to make IL-10, a cytokine recognized for its immune-suppressive qualities (26). This level of discrimination was achieved by the complementary use of a sensitive cytokine ELISPOT and multiple peptides representing NPPEs of multiple islet autoantigens. Since these assays appear capable of distinguishing the tolerant from the autoimmune state, they will be of potential use in the monitoring of immune intervention trials in diabetes.
Our data indicate a different quality of immune response to islet autoantigens in patients with T1DM and in those who share some of the HLA-encoded risk but who are not diabetic. Using multiple epitopes, an assay that indicates the functional phenotype of the autoreactive response, and a relatively large study population, has enabled us to perform a systematic exploration of the T cell paradigm of T1DM. The response of patients with T1DM is dominated by the production of IFN-γ, the prototypic Th1 cytokine, and we believe that this provides the first clear evidence that islet autoreactive T cells circulating in patients near a T1DM diagnosis have a proinflammatory phenotype. It is also noteworthy that some patients responding to peptides by secretion of IFN-γ also responded by secretion of IL-10. IL-10 has a range of potent activities that can be summarized as mediating systemic immune suppression (26). It is therefore possible that its production in T1DM patients with Th1-mediated autoreactivity reflects efforts by the immune system to control islet inflammation. This proposal receives support from our observation that patients making IL-10 responses tended to be significantly older at the onset of disease, implying that in these patients disease is slowly progressive and that the IL-10 response may contribute to the latency of autoimmune diabetes in adults. A further possibility, which cannot be addressed in our current ELISPOT format, is that the same CD4 T cell produces both IFN-γ and IL-10. Such cells have been described, most notably in the context of persistent infections (27), and it is an intriguing possibility that their presence reflects an infectious etiology in T1DM. Further studies will be required to clarify this issue. It should be noted that cytokine ELISPOTs do not measure the quantity of IFN-γ or IL-10 produced. This may be of relevance, since studies in animal models suggest that low levels of IFN-γ may protect them from autoimmune diabetes (28, 29).
Rather than being nonresponsive, nondiabetic control subjects frequently reacted to islet autoantigens by the production of IL-10 alone, and it is tempting to speculate that these cells may have a regulatory role. IL-10 suppresses T cell proliferation and Th1/Th2 effector functions (26), and this finding is therefore consistent with our previous observation that T cells from nondiabetic control subjects do not proliferate in response to IA-2 peptides (13). Our data support the view that central thymic tolerance to autoantigens through deletion and anergy is incomplete and that active peripheral tolerance mechanisms, such as the recruitment of Treg’s, are a physiological requirement (30). Further characterization of these cells will establish whether they are capable of regulating potentially pathogenic islet-autoreactive Th1 cells and whether immunotherapeutic interventions in T1DM can induce their differentiation and expansion.
Our study was underpinned by the development of T cell assay technology capable of detection of autoreactive T cells in diseases such as T1DM, a major research goal in recent years (11, 12, 31, 32). In combination, the peptide epitopes that we have identified and sensitive cytokine ELISPOTs we used offer a degree of analytical sensitivity that allows rare responder cells to be detected. Positive responses were detected when as few as five spots per well were detected in the presence of islet peptide. This equates to a frequency of one epitope-specific CD4 T cell per 60,000 PBMCs and is consistent with recent estimates for peptide-specific CD4 T cells using MHC class II tetramer technology (33, 34). The assay format in which there is a period of initial bulk culture in the absence of cytokine capture Ab’s allows cell-cell interaction and the potential for signal amplification, contrasting with the conventional direct approach in which cytokines secreted by responder cells are immediately sequestered by capture Ab’s and are therefore unavailable to influence bystander cells (10). After bulk culture, only nonadherent cells are transferred for a brief cytokine-capture period, limiting the potential for background and non–T cell cytokine detection. As shown recently in a workshop format (21) and confirmed in the present study by repeated measures, this assay format shows excellent reproducibility characteristics.
The development of cellular and biochemical techniques to identify NPPEs of islet autoantigens presented by selected HLA class II molecules (13) is a further important refinement of the autoreactive T cell assay, since it avoids use of whole antigens and the inherent problems of contamination with xeno-proteins (12). Synthetic peptides, representing key epitopes of the major islet autoantigens, offer a considerable potential advantage in this respect, since they can be generated in a highly pure form. Moreover, high concentrations of pure peptides with high affinity for HLA class II molecules achieves high levels of peptide-HLA density with minimal toxicity. Peptides bind surface HLA class II molecules directly, minimizing the requirement for antigen processing and thus recruiting additional APCs such as B cells, a manipulation known to enhance the detection of rare T cell populations (35). We hypothesize that the high level of peptide-HLA density achieved drives autoreactive effector T cells, which are presumed to have low affinity for the peptide-HLA complex, to respond in the environment of PBMC culture in which provision of costimulatory signals is relatively poor.
The fact that greater discrimination between T1DM and nondiabetic subjects is achieved with multiple autoantigens closely mirrors studies on the use of multiple islet autoantibody specificities to screen for prediabetes, in which diagnostic sensitivity, specificity, and predictive power increase as the number of autoantigens used in the detection assays are increased (14). Furthermore, no single epitope distinguishes itself as being highly discriminatory; rather, the power of the study lies in the use of multiple epitopes. In our study the addition of PI epitopes to the IA-2 epitopes already identified increases diagnostic sensitivity, such that over 70% of T1DM patients are positive, a figure approaching that seen for autoantibody positivity in the same cohort (82% positive for IA-2 and/or glutamic acid decarboxylase-65 autoantibodies). It is probable that the size of the panel of peptides used can be reduced and refined as the more dominant epitope responses are deciphered. The PI peptides demonstrate a hierarchy of responsiveness in which the sequence C19-A3 appears dominant. This closely reflects findings in HLA-DR4 (B1*0401) transgenic mice (36) immunized with pre-PI and other studies identifying C19-A3 as a target in patients with T1DM (37, 38). Although a higher prevalence of responses to the natural peptides was seen in patients with at least one HLA-DR4 allele, this difference did not reach statistical significance with the number of cases studied, and responses are seen in non-DR4 individuals. We selected long consensus sequences spanning the regions we identify after elution from HLA-DR4, and presumably some of these regions represent “hot-spots” of antigen processing also processed and presented by other class II HLA molecules.
The present study can be considered as a pilot for future analyses in which peptides are tested in blinded fashion on comparable study populations. It will be important to establish that similar reactivity is seen in younger patients and children, who comprise the majority of T1DM subjects; in our study the requirement for sufficient blood volumes to explore a large peptide panel with multiple cytokines dictated that it be performed using adults. It will also be important to establish the most robust method for reporting ELISPOT data. There is no standard or accepted approach; in our study we used a ROC plot to direct the optimal cut-off for positivity, which gave the highest combination of diagnostic sensitivity and specificity in our populations. The use of a SI, although widely accepted in T cell proliferation assays, is dependent upon the background response, which varies widely among individuals. An alternative, the subtraction of background counts, was not favored because it masks the extent of the background response (for example, results for medium versus stimulus of zero and five spots, respectively, clearly represents a different result from 100 and 105 spots).
In summary, we have developed an assay format that detects autoreactive T cells in T1DM with a high diagnostic sensitivity and specificity, due at least in part to the adoption of a multiantigen approach pioneered in islet autoantibody studies. Such T cell assays will be required for monitoring treatment efficacy in the burgeoning arena of immune intervention trials in T1DM. Our data indicate that islet destruction is characterized by proinflammatory autoreactive T cells, while the tolerant, nondiabetic state is characterized by autoreactive T cells that secrete the immune suppressive cytokine, IL-10. When and how the latter is acquired will be of particular interest for future research.
Acknowledgments
This work was supported by Diabetes UK, which funds the South West of England Newly Diagnosed Diabetes Type 1 Collection, and by a project grant from the Wellcome Trust. M. Peakman is a Diabetes UK Senior Clinical Research Fellow. T.P. Astill was funded by the Joint Research Committee of King’s College Hospital. We are grateful to patients and control subjects for blood donation, to Adrian Hayday for helpful discussions, and to Alistair Williams for performing autoantibody assays.
Footnotes
See the related Commentary beginning on page 346.
Sefina Arif and Timothy I. Tree contributed equally to this work.
Conflict of interest: The authors have declared that no conflict of interest exists.
Nonstandard abbreviations used: type 1 diabetes mellitus (T1DM); enzyme-linked immunospot (ELISPOT); insulinoma associated-2 (IA-2); proinsulin (PI); regulatory T cell (Treg cell); diabetes mellitus (DM); naturally processed and presented epitope (NPPE); stimulation index (SI); receiver-operator characteristic (ROC); antigen-delivery system (ADS); mass-to-charge ratio (m/z).
References
- 1.Atkinson MA, Eisenbarth GS. Type 1 diabetes: new perspectives on disease pathogenesis and treatment. Lancet. 2001;358:221–229. doi: 10.1016/S0140-6736(01)05415-0. [DOI] [PubMed] [Google Scholar]
- 2.Raz I, et al. Beta-cell function in new-onset type 1 diabetes and immunomodulation with a heat-shock protein peptide (DiaPep277): a randomised, double-blind, phase II trial. Lancet. 2001;358:1749–1753. doi: 10.1016/S0140-6736(01)06801-5. [DOI] [PubMed] [Google Scholar]
- 3.Schatz DA, Bingley PJ. Update on major trials for the prevention of type 1 diabetes mellitus: the American Diabetes Prevention Trial (DPT-1) and the European Nicotinamide Diabetes Intervention Trial (ENDIT) J. Pediatr. Endocrinol. Metab. 2001;14(Suppl 1):619–622. doi: 10.1515/jpem.2001.14.s1.619. [DOI] [PubMed] [Google Scholar]
- 4.Diabetes Prevention Trial—Type 1 Diabetes Study Group. Effects of insulin in relatives of patients with type 1 diabetes mellitus. N. Engl. J. Med. 2002;346:1685–1691. doi: 10.1056/NEJMoa012350. [DOI] [PubMed] [Google Scholar]
- 5.Herold KC, et al. Anti-CD3 monoclonal antibody in new-onset type 1 diabetes mellitus. N. Engl. J. Med. 2002;346:1692–1698. doi: 10.1056/NEJMoa012864. [DOI] [PubMed] [Google Scholar]
- 6.Liblau RS, Singer SM, McDevitt HO. Th1 and Th2 CD4+ T cells in the pathogenesis of organ-specific autoimmune diseases. Immunol. Today. 1995;16:34–38. doi: 10.1016/0167-5699(95)80068-9. [DOI] [PubMed] [Google Scholar]
- 7.Katz JD, Benoist C, Mathis D. T helper cell subsets in insulin-dependent diabetes. Science. 1995;268:1185–1188. doi: 10.1126/science.7761837. [DOI] [PubMed] [Google Scholar]
- 8.Almawi WY, Tamim H, Azar ST. Clinical review 103: T helper type 1 and 2 cytokines mediate the onset and progression of type I (insulin-dependent) diabetes. J. Clin. Endocrinol. Metab. 1999;84:1497–1502. doi: 10.1210/jcem.84.5.5699. [DOI] [PubMed] [Google Scholar]
- 9.Chatenoud L, Salomon B, Bluestone JA. Suppressor T cells — they’re back and critical for regulation of autoimmunity! Immunol. Rev. 2001;182:149–163. doi: 10.1034/j.1600-065x.2001.1820112.x. [DOI] [PubMed] [Google Scholar]
- 10.Meierhoff G, Ott PA, Lehmann PV, Schloot NC. Cytokine detection by ELISPOT: relevance for immunological studies in type 1 diabetes. Diabetes Metab. Res. Rev. 2002;18:367–380. doi: 10.1002/dmrr.320. [DOI] [PubMed] [Google Scholar]
- 11.Roep BO, et al. Autoreactive T cell responses in insulin-dependent (type 1) diabetes mellitus. Report of the first international workshop for standardization of T cell assays. J. Autoimmun. 1999;13:267–282. doi: 10.1006/jaut.1999.0312. [DOI] [PubMed] [Google Scholar]
- 12.Peakman M, et al. Characterization of preparations of GAD65, proinsulin, and the islet tyrosine phosphatase IA-2 for use in detection of autoreactive T-cells in type 1 diabetes: report of phase II of the Second International Immunology of Diabetes Society Workshop for Standardization of T-cell assays in type 1 diabetes. Diabetes. 2001;50:1749–1754. doi: 10.2337/diabetes.50.8.1749. [DOI] [PubMed] [Google Scholar]
- 13.Peakman M, et al. Naturally processed and presented epitopes of the islet cell autoantigen IA-2 eluted from HLA-DR4. J. Clin. Invest. 1999;104:1449–1457. doi: 10.1172/JCI7936. [DOI] [PMC free article] [PubMed] [Google Scholar]
- 14.Bingley PJ, Williams AJ, Gale EA. Optimized autoantibody-based risk assessment in family members. Implications for future intervention trials. Diabetes Care. 1999;22:1796–1801. doi: 10.2337/diacare.22.11.1796. [DOI] [PubMed] [Google Scholar]
- 15.She JX. Susceptibility to type I diabetes: HLA-DQ and DR revisited. Immunol. Today. 1996;17:323–329. doi: 10.1016/0167-5699(96)10014-1. [DOI] [PubMed] [Google Scholar]
- 16.Marciulionyte D, Williams AJ, Bingley PJ, Urbonaite B, Gale EA. A comparison of the prevalence of islet autoantibodies in children from two countries with differing incidence of diabetes. Diabetologia. 2001;44:16–21. doi: 10.1007/s001250051574. [DOI] [PubMed] [Google Scholar]
- 17.Mackin RB. Streamlined procedure for the production of normal and altered versions of recombinant human proinsulin. Protein Expr. Purif. 1999;15:308–313. doi: 10.1006/prep.1998.1024. [DOI] [PubMed] [Google Scholar]
- 18.Cowley DJ, Mackin RB. Expression, purification and characterization of recombinant human proinsulin. FEBS Lett. 1997;402:124–130. doi: 10.1016/s0014-5793(96)01511-6. [DOI] [PubMed] [Google Scholar]
- 19.Astill TP, Ellis RJ, Arif S, Tree TI, Peakman M. Promiscuous binding of proinsulin peptides to type 1 diabetes-permissive and -protective HLA class II molecules. Diabetologia. 2003;46:496–503. doi: 10.1007/s00125-003-1070-3. [DOI] [PubMed] [Google Scholar]
- 20.Panina-Bordignon P, et al. Universally immunogenic T cell epitopes: promiscuous binding to human MHC class II and promiscuous recognition by T cells. Eur. J. Immunol. 1989;19:2237–2242. doi: 10.1002/eji.1830191209. [DOI] [PubMed] [Google Scholar]
- 21.Schloot NC, et al. Comparison of cytokine ELISpot assay formats for the detection of islet antigen autoreactive T cells. Report of the Third Immunology of Diabetes Society T-Cell Workshop. J. Autoimmun. 2003;21:365–376. doi: 10.1016/s0896-8411(03)00111-2. [DOI] [PubMed] [Google Scholar]
- 22.McNeil BJ, Keller E, Adelstein SJ. Primer on certain elements of medical decision making. N. Engl. J. Med. 1975;293:211–215. doi: 10.1056/NEJM197507312930501. [DOI] [PubMed] [Google Scholar]
- 23.Beck JR, Schultz EK. The use of receiver operator characteristic (ROC) curves in test performance evaluation. Arch. Pathol. Lab. Med. 1986;110:13–20. [PubMed] [Google Scholar]
- 24.Rammensee H, Bachmann J, Emmerich NP, Bachor OA, Stevanovic S. SYFPEITHI: database for MHC ligands and peptide motifs. Immunogenetics. 1999;50:213–219. doi: 10.1007/s002510050595. [DOI] [PubMed] [Google Scholar]
- 25.Bingley PJ, Bonifacio E, Mueller PW. Diabetes Antibody Standardization Program: first assay proficiency evaluation. Diabetes. 2003;52:1128–1136. doi: 10.2337/diabetes.52.5.1128. [DOI] [PubMed] [Google Scholar]
- 26.Moore KW, de Waal Malefyt R, Coffman RL, O’Garra A. Interleukin-10 and the interleukin-10 receptor. Annu. Rev. Immunol. 2001;19:683–765. doi: 10.1146/annurev.immunol.19.1.683. [DOI] [PubMed] [Google Scholar]
- 27.Trinchieri G. Regulatory role of T cells producing both interferon gamma and interleukin 10 in persistent infection. J. Exp. Med. 2001;194:F53–F57. doi: 10.1084/jem.194.10.f53. [DOI] [PMC free article] [PubMed] [Google Scholar]
- 28.Serreze DV, et al. Th1 to Th2 cytokine shifts in nonobese diabetic mice: sometimes an outcome, rather than the cause, of diabetes resistance elicited by immunostimulation. J. Immunol. 2001;166:1352–1359. doi: 10.4049/jimmunol.166.2.1352. [DOI] [PubMed] [Google Scholar]
- 29.Flaishon L, et al. Cutting edge: anti-inflammatory properties of low levels of IFN-gamma. J. Immunol. 2002;168:3707–3711. doi: 10.4049/jimmunol.168.8.3707. [DOI] [PubMed] [Google Scholar]
- 30.Walker LS, Abbas AK. The enemy within: keeping self-reactive T cells at bay in the periphery. Nat. Rev. Immunol. 2002;2:11–19. doi: 10.1038/nri701. [DOI] [PubMed] [Google Scholar]
- 31.Roep BO. T-cell responses to autoantigens in IDDM. The search for the Holy Grail. Diabetes. 1996;45:1147–1156. doi: 10.2337/diab.45.9.1147. [DOI] [PubMed] [Google Scholar]
- 32.Atkinson M, Honeyman M, Peakman M, Roep B. T-cell markers in type I diabetes: progress, prospects and realistic expectations. Diabetologia. 2000;43:819–820. doi: 10.1007/s001250070001. [DOI] [PubMed] [Google Scholar]
- 33.Day CL, et al. Ex vivo analysis of human memory CD4 T cells specific for hepatitis C virus using MHC class II tetramers. J. Clin. Invest. 2003;112:831–842. doi:10.1172/JCI200318509. doi: 10.1172/JCI18509. [DOI] [PMC free article] [PubMed] [Google Scholar]
- 34.Danke NA, Kwok WW. HLA class II-restricted CD4+ T cell responses directed against influenza viral antigens postinfluenza vaccination. J. Immunol. 2003;171:3163–3169. doi: 10.4049/jimmunol.171.6.3163. [DOI] [PubMed] [Google Scholar]
- 35.Stevens EJ, Peakman M. Enhanced T cell proliferation and increased responder frequency following delivery of antigen to the antigen-presenting cell; B cell dependency and use in detection of autoreactive T cells. J. Immunol. Methods. 1998;215:59–70. doi: 10.1016/s0022-1759(98)00059-3. [DOI] [PubMed] [Google Scholar]
- 36.Congia M, Patel S, Cope AP, De Virgiliis S, Sonderstrup G. T cell epitopes of insulin defined in HLA-DR4 transgenic mice are derived from preproinsulin and proinsulin. Proc. Natl. Acad. Sci. U. S. A. 1998;95:3833–3838. doi: 10.1073/pnas.95.7.3833. [DOI] [PMC free article] [PubMed] [Google Scholar]
- 37.Durinovic-Bello I, Boehm BO, Ziegler AG. Predominantly recognized proinsulin T helper cell epitopes in individuals with and without islet cell autoimmunity. J. Autoimmun. 2002;18:55–66. doi: 10.1006/jaut.2001.0566. [DOI] [PubMed] [Google Scholar]
- 38.Narendran P, Williams AJ, Elsegood K, Leech NJ, Dayan CM. Humoral and cellular immune responses to proinsulin in adults with newly diagnosed type 1 diabetes. Diabetes Metab. Res. Rev. 2003;19:52–59. doi: 10.1002/dmrr.332. [DOI] [PubMed] [Google Scholar]


