Original citation: J. Clin. Invest. 112:1887–1894 (2003). doi:10.1172/JCI200319757.
Citation for this erratum: J. Clin. Invest. 112:490 (2004). doi:10.1172/JCI200319757E1.
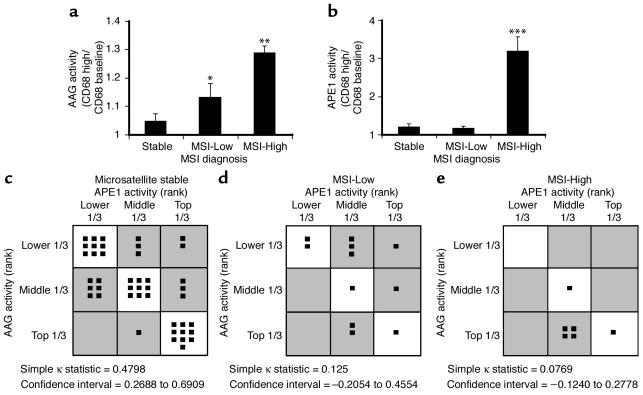
In Figure 3, incorrect confidence intervals are shown. The correct figure appears below:
Figure 3.
(a and b) Correlation between MSI and AAG (a) or APE1 (b) activity. Bar graphs represent means ± SEM. There was a significant trend for MSI and AAG activity (robust regression analysis, P = 0.0012). Although this trend was not observed between MSI and APE1, there was a significant increase in APE1 activity in the MSI-High group (n = 5; one-way ANOVA with Scheffe multiple comparison test, P = 0.0004). *, AAG activity is significantly higher in the MSI-Low group (n = 10) than in the microsatellite stable group (n = 15). **, AAG activity is significantly higher in the MSI-High group (n = 5) than in the MSI-Low group (n = 10). ***, APE1 activity is significantly higher in the MSI-High group (n = 5) than in the MSI-Low (n = 10) and microsatellite stable (n = 15) groups. (c–e) Number of samples belonging to a specific AAG and APE1 activity category. AAG and APE1 activities were ranked in order, then placed into tertiles as samples with activity belonging to the Lower 1/3, Middle 1/3, or Top 1/3. (c) Of the 60 samples, 43 did not have a band shift and were characterized as microsatellite stable samples. (d) Of the 60 samples, 11 had a band shift in one of the markers examined (including TGFβRII and BLM) and were characterized as MSI-Low samples. (e) Of the 60 samples, six had a band shift in two or more of the markers examined (including TGFβRII and BLM) and were characterized as MSI-High samples. Shaded boxes represent activities where there is an imbalance of AAG and APE1 activities. The simple κ statistic indicates a trend for imbalance between AAG and APE1 as MSI levels increase. The simple κ statistic of 1.0 indicates no imbalance. A simple κ statistic moving toward zero indicates greater imbalance between the two enzymes.


