

Abstract
Purpose
To compare vertebral bone marrow fat content quantified with proton MR spectroscopy (1H-MRS) with the volume of abdominal adipose tissue, lumbar spine volumetric bone mineral density (vBMD), and blood biomarkers in postmenopausal women with and without type 2 diabetes mellitus (T2DM).
Materials and Methods
Thirteen postmenopausal women with T2DM and 13 age- and BMI-matched healthy controls were included in this study. All subjects underwent 1H-MRS of L1–L3 to quantify vertebral bone marrow fat content (FC) and unsaturated lipid fraction (ULF). QCT was performed to assess vBMD of L1–L3. The volumes of abdominal subcutaneous/visceral/total adipose tissue were determined from the QCT images and adjusted for abdominal body volume (SATadj/VATadj/TATadj). Fasting blood tests included plasma glucose and HbA1c.
Results
Mean FC showed an inverse correlation with vBMD (r=−0.452; p<0.05) in the whole study population. While mean FC was similar in the diabetic women and healthy controls (69.3 ± 7.5% vs. 67.5 ± 6.1%; p>0.05), mean ULF was significantly lower in the diabetic group (6.7 ± 1.0% vs. 7.9 ± 1.6%; p<0.05). SATadj and TATadj correlated significantly with mean FC in the whole study population (r=0.538 and r=0.466; p<0.05). In contrast to the control group, significant correlations of mean FC with VATadj and HbA1c were observed in the diabetic group (r=0.642 and r=0.825; p<0.05).
Conclusion
This study demonstrated that vertebral bone marrow fat content correlates significantly with SATadj, TATadj, and lumbar spine vBMD in postmenopausal women with and without T2DM, but with VATadj and HbA1c only in women with T2DM.
Keywords: Diabetes, MR Spectroscopy, Vertebral Bone Marrow Fat, Quantitative Computed Tomography, Bone Mineral Density, Abdominal Adipose Tissue
Introduction
Type 2 diabetes mellitus (T2DM) is a chronic metabolic disorder that is characterized by impaired glucose metabolism and is often accompanied by a pathological quantity and distribution of adipose tissue (1–5). Tools that have been proposed in the assessment of quantity and distribution of adipose tissue include quantitative computed tomography (QCT), magnetic resonance imaging (MRI), and proton magnetic resonance spectroscopy (1H-MRS). QCT and MRI offer the possibility for an independent quantification of abdominal subcutaneous and visceral adipose tissue, while 1H-MRS has been proven to be an accurate, non-invasive method for measuring vertebral bone marrow fat content (6–10).
Previous studies have reported that 1H-MRS of bone marrow is a tool for quantification of bone marrow fat of entities such as osteoporosis, obesity and anorexia nervosa, a predictable selection tool in prophylactic vertebroplasty, and even an assessment tool for treatment response in patients with multiple myeloma (6;7;11–13). 1H-MRS could also provide valuable insight into the effects of T2DM on the vertebral bone marrow fat. It is well known that accelerated marrow adipogenesis is associated with aging and several chronic conditions, including osteoporosis (14). In mice, diabetes is associated with higher bone marrow fat (15), but little is known about this relationship in humans. There are currently no reports available on the association between bone marrow fat content and diabetes or glycemic control.
A positive association of visceral adipose tissue with vertebral bone marrow fat content was observed in obese women, and an inverse relationship between vertebral bone marrow fat content and corresponding lumbar bone mineral density (BMD) has been reported in postmenopausal women (6;7). However, these relationships have not been examined in women with T2DM.
To better understand the effect of T2DM on vertebral bone marrow fat content, the goals of this study were therefore (i) to compare vertebral bone marrow fat content in postmenopausal women with T2DM and age- and BMI-matched healthy controls, (ii) to determine whether vertebral bone marrow fat content correlates with the volume of abdominal adipose tissue, (iii) with lumbar spine BMD, and (iv) with measures of glycemic control.
Materials and Methods
Subjects
Postmenopausal women 50–75 years of age and with a body mass index (BMI) of 21–35 kg/m2 were recruited through public media and posted flyers for this cross-sectional study. Subjects with a history of severe neuropathic disease, alcoholism, chronic drug use, chronic gastrointestinal disease, renal or hepatic impairment, unstable cardiovascular disease or uncontrolled hypertension and presence of pathological fractures were excluded from the study. Subjects were also excluded in case of MRI contraindications. Histories of treatment with antacids, estrogen, adrenal or anabolic steroids, anticonvulsants, anticoagulants, pharmacological doses of vitamin A supplements, rosiglitazone, pioglitazone, fluoride, calcitonin, tamoxifen and bisphosphonates were also exclusion criteria, because these agents affect bone metabolism.
Thirteen subjects with a history of T2DM, as defined by the American Diabetes Association for more than 5 years that either required insulin or were treated with oral therapies such as sulfonylureas and metformin, were included in the study. Additionally, thirteen age- and BMI-matched healthy controls were enrolled. All subjects had no history of an osteoporotic fracture. They were mobile, able to move without walkers and had no history of long periods of inactivity at the time of the exam. The study was approved by the local Institutional Review Board and conducted in accordance with the Committee for Human Research. All subjects gave written informed consent prior to participation in the study.
Blood Parameter Analysis
Blood sampling was performed after 12 hours overnight fasting. The following fasting blood parameters were analyzed: plasma glucose [mg/dl], HbA1c [%], calcium [mg/dl], vitamin D [ng/ml], and parathyroid hormone (PTH) [pg/ml]. Measurements were performed at a local Quest Diagnostics laboratory (Madison, NJ, USA) and compared to standard reference levels.
Imaging
Volumetric quantitative computed tomography (QCT) exams of the lumbar spine were performed with a 64-row Multi-Detector CT scanner (GE Healthcare, Milwaukee, WI, USA). A dedicated calibration phantom (Mindways Osteoporosis Phantom, San Francisco, CA, USA) was placed in the scanner mat beneath the subject. After the acquisition of a lateral scout image, axial contiguous images from mid T12 to mid L4 were obtained using a standardized protocol with tube voltage of 120 kVp, tube load of 200 mAs and axial slice thickness of 2.5 mm.
Subjects also underwent single-voxel proton MR spectroscopy (1H-MRS) to quantify the vertebral bone marrow fat content of L1–L3 using a 3T GE Signa scanner and a GE 4-channel spine coil (GE Healthcare, Milwaukee, WI, USA). Scout images in transverse, coronal, and sagittal planes were acquired using the standard localizer gradient echo sequence provided by the manufacturer with a scan time of 25s. A sagittal T2-weighted fast spin echo (FSE) sequence was also obtained (TR/TE = 5000/87 ms, echo train length = 32, field of view = 22 cm, slice thickness = 6 mm, scan time = 3 min 16s). A Point Resolved Spectral Selection (PRESS) sequence was used to acquire the spectra in the vertebral bodies from L1–L3. Parameters of the PRESS 1H-MRS were: TR/TE=3000/37 ms, 64 averages without water suppression, sweep width = 5000 Hz, data point = 4096, voxel size = 15×15×20 mm3 = 4.5 cm3 and scan time = 2 min 36s. The PRESS box size was kept the same (4.5 cm3) for each vertebral level and for all subjects. The T2-weighted FSE images were used for the prescription of the PRESS box, which was positioned in the middle of the respective vertebral body. Six outer volume saturation bands (one on each side of the PRESS box) were used to eliminate potential contamination of outside signals. The default auto-shimming provided by the manufacturer was used, which is a first order linear shim.
Image Analysis
Volumetric bone mineral density (vBMD) of the trabecular compartment of L1–L3 vertebrae were assessed by using commercially available software (Mindways, San Francisco, CA, USA). Oval regions of interest (ROIs) were automatically placed within the anterior ¾ of the trabecular compartment of the L1–L3 vertebra, 1 cm thick and equidistant to both endplates (Figure 1). The ROIs were reviewed by an experienced observer, although manual corrections of ROI positions were not necessary in any subject.
Figure 1.

QCT based volumetric bone mineral density (vBMD) measurements in L1 (A), L2 (B), and L3 (C). Measurements were performed in automatically placed oval regions of interest (red marked in the axial images, yellow marked in the sagittal images).
The volume of abdominal adipose tissue was measured in the CT images by using custom-built software based on Interactive Data Language (IDL, Research Systems, Boulder, CO, USA). An automated threshold algorithm was applied to segment the total abdominal cross-sectional area (outer contour) and the outline along the abdominal wall and erector spinae muscle (inner contour) in each slice as shown in Figure 2. Manual corrections were necessary due to blurred transitions, in particular for the inner contour. Segmentation was performed in 40 slices with 2.5 mm slice thickness starting at mid T12. Subcutaneous adipose tissue (SAT) volume was calculated as the volume defined between the inner and outer contours (Figure 2). Visceral adipose tissue (VAT) was determined as outlined by Yoshizumi et al. (8): Fat tissue was considered as the mean attenuation value ± 2x Standard Deviation of the SAT in each subject. All pixels within the inner contour and the selected attenuation range were defined as VAT (Figure 3). Total adipose tissue (TAT) was calculated as the sum of SAT and VAT. Additionally, the VAT/TAT ratio was computed and SAT, VAT and TAT were adjusted for abdominal body volume: SATadj = SAT/inner contour volume; VATadj = VAT/inner contour volume; TATadj = TAT/outer contour volume.
Figure 2.

Threshold-based segmentation of total abdominal cross-sectional area (outer contour) and the outline along the abdominal wall and erector spinae muscle (inner contour) for abdominal adipose tissue measurements.
Figure 3.

Visceral adipose tissue (VAT) measurements using QCT images:
A: Representative slice with the segmented inner contour (blue outline along the abdominal wall and erector spinae muscle)
B: VAT mask (including all pixels within the inner contour and the selected attenuation range)
1H-MRS spectral data from each of the four channels were automatically reconstructed and corrected for phase, frequency shift and baseline distortion using in-house developed software (16). The corrected spectra from each channel of the coil were then combined using sum of squares of the data. Four peaks were well resolved: unsaturated lipids (olefinic, double bond -CH=CH- protons at 5.3 ppm), water protons at 4.7 ppm, residual lipids (CH2 methylene protons α- to a double bond -CH=CHCH2- at 2.0 ppm), and saturated lipids (bulk CH2 methylene protons at 1.3 ppm). Using methods previously described, the four peaks were fitted with Voigt models to estimate their areas and line widths (Figure 4) (16–19). Bone marrow fat content (FC) of each vertebra was calculated according to the equation: FC = [(UL+SL+RL)/(UL+SL+RL+W)] × 100% where UL, SL, RL and W are the areas of unsaturated lipids, saturated lipids, residual lipids, and water, respectively. In addition, the unsaturated lipid fraction (ULF) was calculated according to the equation: ULF = [UL/(UL+SL+RL)] × 100%. FC and ULF were calculated for each vertebra and averaged over L1–L3 for each subject. No relaxation correction was performed.
Figure 4.
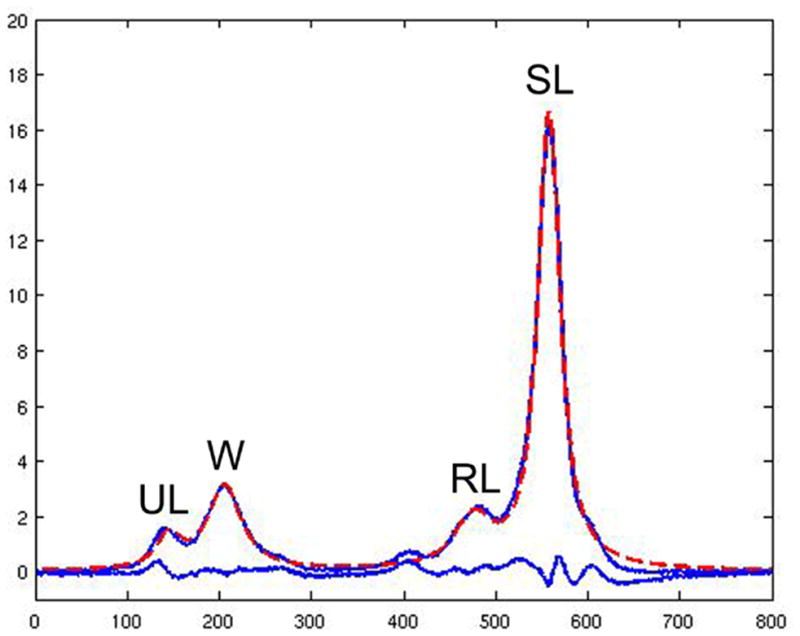
1H-MRS of the vertebral bone marrow resolves four peaks: unsaturated lipids (UL), water (W), residual lipids (RL) and saturated lipids (SL). The four peaks were fitted with Voigt models to estimate their areas and line widths (18;19). The acquired spectrum (blue line with the four peaks) is overlaid with the fitted spectrum (dashed red line). The lower blue line indicates the difference between acquired and fitted spectrum.
Statistical Analysis
Mean, standard deviation (SD) and 95% confidence interval (CI) of all parameters were calculated for the control and diabetes group. The Kolmogorov-Smirnov test indicated that the vast majority of parameters were not normally distributed. Therefore Wilcoxon tests were used to determine differences between the two groups. Spearman’s correlation coefficients were computed between parameters after potential outliers were identified and excluded based on Cook’s distance measurements. The statistical analyses were performed with SPSS (SPSS Inc., Chicago, IL, USA). All tests were done using a two-sided 0.05 level of significance.
Reproducibility
To assess the reproducibility error of the abdominal adipose tissue measurements, QCT images of five randomly selected subjects were segmented three times by one operator. SAT and VAT were determined and reproducibility errors were calculated in absolute numbers as root mean square average of the errors for each of the five subjects and on percentage basis as the root mean square average of the single coefficients of variation per subject (20). The reproducibility error for SAT measurements amounted to 0.12%, corresponding to a volume of 1.76 cm3. The reproducibility error for VAT measurements was 3.74%, corresponding to a volume of 12.20 cm3.
Reproducibility errors for vertebral bone marrow fat content quantification using 1H-MRS were reported previously (18). The coefficient of variation for repeated vertebral bone marrow fat content measurements (two scans with repositioning between the scans in six subjects) amounted 1.2%, 1.9% and 2.0% for L1–L3.
Results
The diabetes group consisted of seven Caucasian and six Asian subjects, the control group of eight Caucasian and five Asian subjects. Mean, SD and 95% CI of all assessed parameters are listed for each group in Table 1.
Table 1.
Mean ± SD [95% CI] of all assessed parameters for controls and diabetics. The p-values are based on Wilcoxon tests to determine significant differences between the two groups.
| controls | diabetics | p-value | |
|---|---|---|---|
| age [years] | 57±4 [54 – 60] | 59±4 [57 – 62] | 0.264 |
| BMI [kg/m2] | 27.4±4.4 [24.8 – 30.1] | 26.8±3.2 [24.9 – 28.8] | 0.960 |
|
| |||
| glucose (fasting blood) [mg/dl] | 87±10 [81–93] | 166±87 [114 – 218] | <0.001 |
| HbA1c (fasting blood) [%] | 5.8±0.3 [5.6 – 5.9] | 7.6±1.7 [6.7 – 8.8] | <0.001 |
| vitamin D (fasting blood) [ng/ml] | 30±12 [23 – 38] | 29±13 [21 – 37] | 0.724 |
| calcium (fasting blood) [mg/dl] | 9.6±0.3 [9.4 – 9.7] | 9.5±0.3 [9.3 – 9.7] | 0.840 |
| PTH (fasting blood) [pg/ml] | 36±15 [26 – 45] | 36±16 [27 – 46] | 1.000 |
|
| |||
| QCT-vBMD L1 [mg/ml] | 135.85±34.84 [114.80 – 156.91] | 138.59±32.08 [119.21 – 157.98] | 0.762 |
| QCT-vBMD L2 [mg/ml] | 130.19±33.36 [110.04 – 150.35] | 138.05±32.21 [118.59 – 157.52] | 0.448 |
| QCT-vBMD L3 [mg/ml] | 122.34±32.12 [102.93 – 141.75] | 130.18±33.48 [109.95 – 150.41] | 0.336 |
| mean (L1–L3) QCT-vBMD [mg/ml] | 129.46±33.03 [109.50 – 149.42] | 135.60±32.21 [116.14 – 155.06] | 0.479 |
|
| |||
| bone marrow fat content L1 [%] | 65.9±7.8 [61.2 – 70.7] | 67.4±8.5 [62.0 – 72.9] | 0.418 |
| bone marrow fat content L2 [%] | 68.1±5.7 [64.6 – 71.5] | 68.9±7.1 [64.5 – 73.4] | 0.650 |
| bone marrow fat content L3 [%] | 68.4±5.9 [64.8 – 72.0] | 71.4±7.7 [66.5 – 76.4] | 0.223 |
| mean (L1–L3) bone marrow fat content [%] | 67.5±6.1 [63.8 – 71.2] | 69.3±7.5 [64.5 – 74.1] | 0.311 |
|
| |||
| bone marrow unsaturated lipid fraction L1 [%] | 7.5±2.2 [6.2 – 8.9] | 6.5±1.9 [5.3 – 7.7] | 0.101 |
| bone marrow unsaturated lipid fraction L2 [%] | 7.9±3.1 [6.1 – 9.8] | 6.6±2.6 [5.0 – 8.2] | 0.225 |
| bone marrow unsaturated lipid fraction L3 [%] | 8.2±2.3 [6.7 – 9.6] | 6.9±1.1 [6.3 –7.6] | 0.064 |
| mean (L1–L3) bone marrow unsaturated lipid fraction [%] | 7.9±1.6 [6.9 – 8.8] | 6.7±1.0 [6.0 – 7.3] | 0.006 |
|
| |||
| inner contour volume [cm3] | 3997±911 [3447 – 4548] | 4352±727 [3890 – 4814] | 0.437 |
| outer contour volume [cm3] | 6088±1976 [4894 – 7282] | 6401±1137 [5678 – 7123] | 0.538 |
| SAT [cm3] | 2090±1201 [1365 – 2816] | 2048±581 [1680 – 2417] | 0.650 |
| VAT [cm3] | 875±772 [408 – 1342] | 1153±401 [898 – 1408] | 0.137 |
| TAT [cm3] | 2965±1941 [1792 – 4138] | 3202±875 [2646 – 3757] | 0.406 |
| VAT/TAT [%] | 25.6±8.7 [20.4 – 30.9] | 35.8±6.7 [31.5 – 40.0] | 0.010 |
| SAT/inner contour volume [%] | 49.9±20.8 [37.3 – 62.4] | 47.1±11.6 [39.7 – 54.5] | 0.894 |
| VAT/inner contour volume [%] | 19.6±14.7 [10.8 – 28.5] | 25.9±6.1 [22.0 – 29.7] | 0.270 |
| TAT/outer contour volume [%] | 44.4±16.4 [34.5 – 54.2] | 49.2±6.5 [45.1 – 53.4] | 0.347 |
The diabetic women were 59 ± 4 years, the healthy controls 57 ± 4 years old (p>0.05). The average BMI in the diabetes group was 26.8 ± 3.2 kg/m2 versus 27.4 ± 4.4 kg/m2 in the control group (p>0.05). Subjects with diabetes had significantly elevated fasting plasma glucose and HbA1c levels compared to normal controls (166 ± 87 mg/dl vs. 87 ± 10 mg/dl, respectively 7.6 ± 1.7% vs. 5.8 ± 0.3%; p<0.05). Differences in vitamin D, calcium and PTH levels between diabetic women and healthy controls were not significant (p>0.05; Table 1).
Diabetic and healthy subjects had similar vBMD values (averaged over L1–L3: 135.60 ± 32.21 mg/cm3 vs. 129.46 ± 33.03 mg/cm3; p>0.05). vBMD decreased from L1 to L3 on average 8.41 ± 13.52 mg/cm3 in the diabetic group and 13.51 ± 9.33 mg/cm3 in the control group (p>0.05). Vertebral bone marrow fat content (FC) increased from L1 to L3 on average 4.2 ± 3.3% in the diabetic and 2.4 ± 4.9% in the healthy women (p>0.05). Mean FC showed an inverse correlation with vBMD in each group and combined for all subjects (r=−0.452; p<0.05; Table 2). Similar FC was measured in the diabetic women and healthy controls (averaged over L1–L3: 69.3 ± 7.5% vs. 67.5 ± 6.1%; p>0.05), while mean (L1–L3) vertebral bone marrow unsaturated lipid fraction (ULF) was significantly lower in the diabetic group compared to the control group (6.7 ± 1.0% vs. 7.9 ± 1.6%; p<0.05). vBMD, FC and ULF showed no significant correlations with BMI (p>0.05).
Table 2.
Spearman’s correlation coefficients r (p-value) between vertebral bone marrow fat content and lumbar vBMD, abdominal adipose tissue measurements, and fasting blood parameters, respectively.
| mean vertebral bone marrow fat content (L1–L3) [%] | |||
|---|---|---|---|
| entire study population | controls | diabetics | |
| mean QCT-vBMD (L1–L3) [mg/ml] | −0.452 (p=0.031) | −0.578 (p=0.049) | −0.700 (p=0.036) |
| SAT [cm3] | 0.438 (p=0.029) | 0.604 (p=0.029) | 0.585 (p=0.045) |
| VAT [cm3] | n.s. | n.s. | n.s. |
| TAT [cm3] | 0.422 (p=0.035) | 0.648 (p=0.017) | 0.645 (p=0.032) |
| VAT/TAT [%] | n.s. | n.s. | n.s. |
| SAT/inner contour volume [%] | 0.538 (p=0.006) | 0.657 (p=0.020) | 0.657 (p=0.020) |
| VAT/inner contour volume [%] | n.s. | n.s. | 0.642 (p=0.033) |
| TAT/outer contour volume [%] | 0.466 (p=0.019) | 0.610 (p=0.027) | 0.742 (p=0.006) |
| glucose (fasting blood) [mg/dl] | n.s. | n.s. | n.s. |
| HbA1c (fasting blood) [%] | 0.389 (p=0.049) | n.s. | 0.825 (p<0.001) |
SAT and VAT measurements demonstrated no significant differences between diabetic and healthy women (2048 ± 581 cm3 vs. 2090 ± 1201 cm3, respectively 1153 ± 401 cm3 vs. 875 ± 772 cm3; p>0.05). However, subjects with diabetes had significantly higher VAT/TAT ratios than healthy controls (35.8 ± 6.7% vs. 25.6 ± 8.7%; p<0.05). SAT and TAT correlated significantly with mean vertebral bone marrow fat content in both groups and combined for all subjects (r=0.438 and r=0.422, respectively; p<0.05; Table 2). No significant correlations of VAT and VAT/TAT with mean vertebral bone marrow fat content were observed in either group (p>0.05). SAT, VAT and TAT showed no significant correlations with vBMD and ULF (p>0.05).
Differences between diabetic subjects and healthy controls regarding abdominal body volume adjusted SATadj (47.1 ± 11.6 vs. 49.9 ± 20.8), VATadj (25.9 ± 6.1% vs. 19.6 ± 14.7%) and TATadj (49.2 ± 6.5% vs. 44.4 ± 16.4%) were not significant (p>0.05). SATadj and TATadj correlated significantly with mean vertebral bone marrow fat content in both groups and combined for all subjects (r=0.538 and r=0.466, respectively; p<0.05; Table 2). VATadj showed a significant correlation with mean vertebral bone marrow fat content only in the diabetic women (r=0.642; p<0.05; Table 2). No significant correlations of SATadj, VATadj and TATadj with vBMD and ULF were observed in either group (p>0.05).
Vitamin D, calcium and PTH did not correlate with vBMD, ULF and vertebral bone marrow fat content in either group (p>0.05). Correlations of fasting plasma glucose and HbA1c levels with vBMD, ULF and abdominal adipose tissue parameters were not significant in subjects with diabetes and normal controls (p>0.05). In contrast to fasting plasma glucose, HbA1c showed a highly significant correlation with mean vertebral bone marrow fat content in the diabetic subjects (r=0.825 using linear fitting; p<0.05; Figure 5). In advance, one outlier was identified and excluded based on Cook’s distance measurements. Spearman’s correlation coefficient including the outlier was r=0.654 (p<0.05). Additionally, diabetic subjects with HbA1c levels >7% (n=8) showed significantly higher mean vertebral bone marrow fat content than diabetic subjects with HbA1c levels ≤ 7% (n=5) (73.5 ± 5.6% vs. 64.1 ± 6.9 %; p<0.05; Figure 6).
Figure 5.
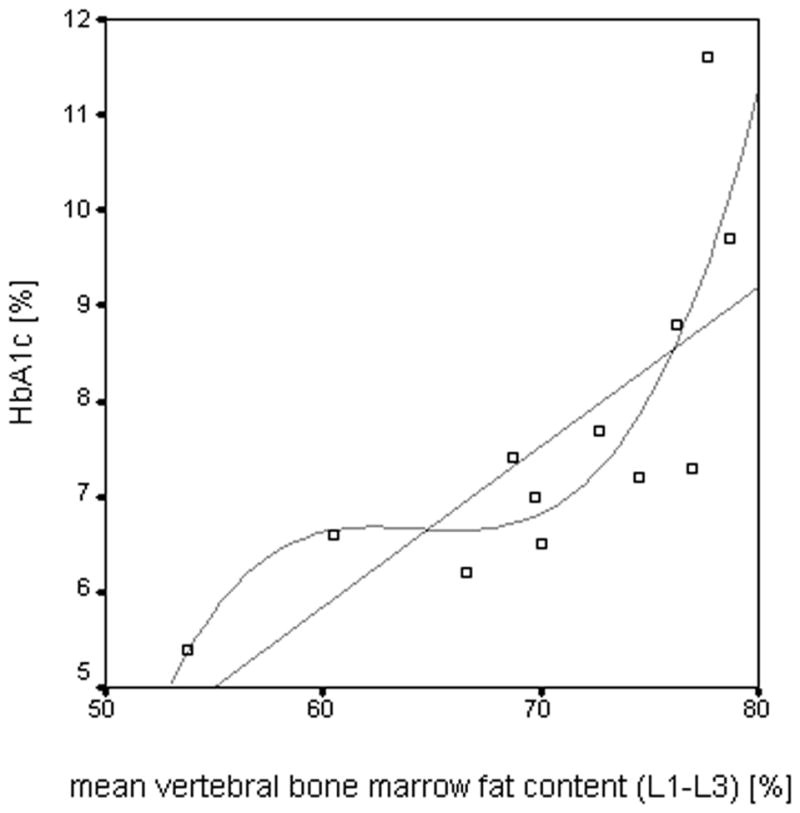
The scatter-plot shows the correlation between mean vertebral bone marrow fat content of L1–L3 and HbA1c levels in the diabetic subjects with linear fitting (r=0.825; p<0.05) and non-linear fitting (r=0.838; p<0.05), respectively.
Figure 6.
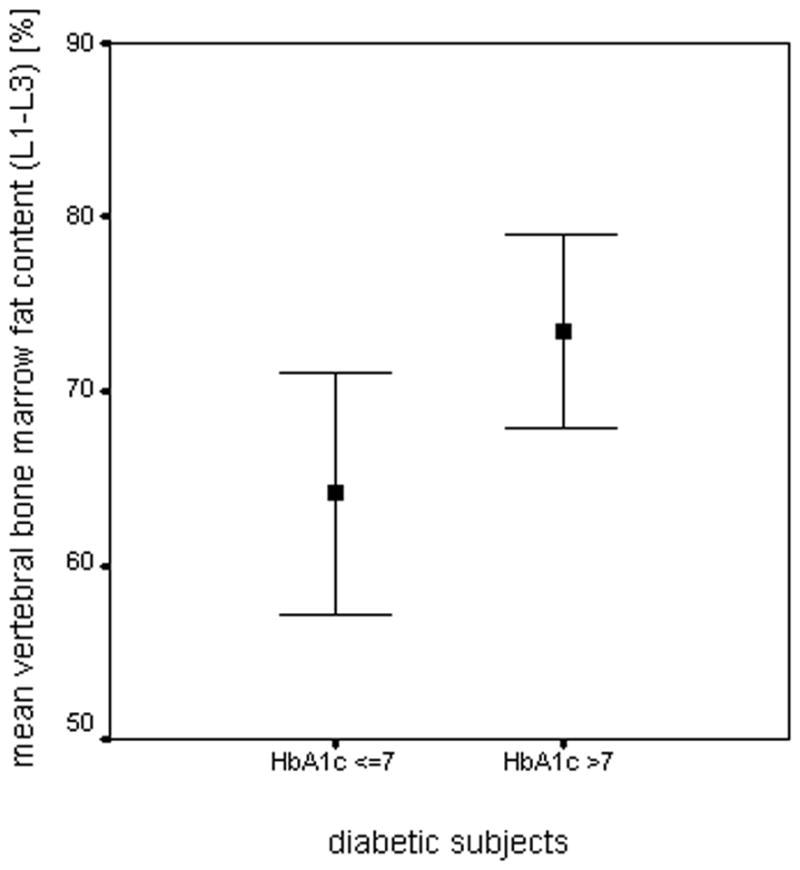
Diabetic subjects with HbA1c levels >7% (n=8) showed significantly (p<0.05) higher mean vertebral bone marrow fat content than diabetic subjects with HbA1c levels ≤ 7% (n=5). The chart depicts mean ± SD of the vertebral bone marrow fat content of L1–L3 for each group.
Discussion
Our study was undertaken to determine if a correlation existed between vertebral bone marrow fat content and abdominal adipose tissue, lumbar vBMD, and blood values in T2DM postmenopausal women and healthy controls. The results demonstrated that vertebral bone marrow fat content is inversely correlated with lumbar vBMD and positively correlated with subcutaneous and total abdominal adipose tissue in both subject groups. Moreover, we observed significant correlations of vertebral bone marrow fat content with visceral adipose tissue and HbA1c in postmenopausal women with T2DM, suggesting that vertebral bone marrow fat content may be a biomarker for how well diabetes is controlled.
Gallagher et al. reported significantly altered total body adipose tissue distribution in T2DM subjects with more VAT and less SAT compared to healthy controls (1). These alterations of the adipose tissue distribution were not only observed in T2DM subjects but also in subjects with impaired glucose tolerance (21). Heshka et al. found T2DM to be associated with less total fat, leg fat and leg lean mass and more truncal fat and lean mass than controls (3). Our study showed similar abdominal SAT and higher abdominal VAT and TAT values in T2DM subjects compared to healthy controls. While these differences were non-significant, diabetic subjects had significantly higher VAT/TAT ratios than healthy controls. In addition, we found significant correlations between the mean vertebral bone marrow fat content and SATadj and between the mean vertebral bone marrow fat content and TATadj in both groups and combined for all subjects. Furthermore a significant correlation was found between mean vertebral bone marrow fat content and VATadj in the diabetic subjects. These findings suggest an association between abdominal adipose tissue and vertebral bone marrow fat. Interestingly, Bredella et al. observed only a significant correlation between VAT and vertebral bone marrow fat in a previous study that included premenopausal women with normal weight, overweight and obesity (6).
We found no significant correlations between abdominal adipose tissue and lumbar vBMD in either subject group, whereas significant correlations between adipose tissue and BMD in older persons were reported previously, partly demonstrating beneficial effects of subcutaneous and detrimental effects of visceral fat on bone strength (22–26). The relatively small sample size in our study may explain why no significant correlations were found. In contrast to abdominal adipose tissue parameters, vertebral bone marrow fat content showed inverse correlations with lumbar vBMD in each group and combined for all subjects. Previous studies reported similar findings in men as well as pre- and postmenopausal women (6;7;27–30). While most studies used DXA and performed 1H-MRS only at one lumbar vertebra, we assessed volumetric BMD by using QCT and measured vertebral bone marrow fat content from L1–L3. These measurements may be more representative and also showed that a vBMD decrease from L1–L3 is associated with a corresponding vertebral bone marrow fat content increase in both subject groups. The possible effects of T2DM on the vertebral bone marrow fat are more difficult to address. Diabetic subjects and healthy controls were age- and BMI-matched and showed similar vBMD values (averaged over L1–L3: 135.60 ± 32.21 mg/ml vs. 129.46 ± 33.03 mg/ml) and similar vertebral bone marrow fat content (averaged over L1–L3: 69.3 ± 7.5% vs. 67.5 ± 6.1%). However, the mean vertebral bone marrow unsaturated lipid fraction was significantly lower in diabetic subjects compared to healthy controls (6.7 ± 1.0% vs. 7.9 ± 1.6%; p=0.006). We also observed a highly significant correlation (r=0.825; p<0.001) between vertebral bone marrow fat content and HbA1c levels in the diabetic subjects, suggesting an effect of T2DM on the vertebral bone marrow fat. This became more apparent when the diabetic subjects were stratified based on HbA1c levels with a cut-off point of 7% and significantly higher vertebral bone marrow fat content was found in subjects with HbA1c levels >7%. We chose this cut-off point, since targeting HbA1c levels <7% are recommended to reduce microvascular complications (31;32). To our knowledge, this is the first study, which examined the relationship between HbA1c levels and vertebral bone marrow fat content in subjects with T2DM. We found no significant correlation between fasting plasma glucose level and vertebral bone marrow fat. Both HbA1c and fasting plasma glucose have their diagnostic value for T2DM (33;34). However, HbA1c levels reflect a 2–3-month average of blood glucose concentrations in contrast to fasting plasma glucose as short-term marker (35;36). That might be the reason why a significant correlation with vertebral bone marrow fat content was only found for HbA1c and not for fasting plasma glucose. The association of HbA1c levels and vertebral bone marrow fat content in subjects with T2DM may further our understanding of this metabolic disease, similar to findings of Bredella et al. who reported an inverse correlation between vertebral bone marrow fat content and insulin-like growth factor 1 (IGF-1) in obese women, supporting the role of IGF-1 as an important regulator of the fat and bone lineage (6). In contrast to vertebral bone marrow fat content, no significant correlations of mean vertebral bone marrow unsaturated lipid fraction with vBMD, abdominal adipose tissue and HbA1c levels were found in either group (p>0.05). This may be explained by the relatively small unsaturated lipid fraction compared to the predominant saturated lipid fraction in the bone marrow spectrum.
We observed no differences of vitamin D, calcium and PTH levels in diabetic subjects and healthy controls. Vertebral bone marrow fat content and lumbar vBMD did not correlate with these blood values in our study, while previous studies reported associations between vitamin D status, parathyroid function and BMD (37;38). This might be explained by the comparatively small study population with the focus on subjects with T2DM in our study.
Our study had several limitations. First, the sample size of our study was rather small with 13 diabetics and 13 controls. However, this was a pilot study and it was beyond the scope to apply this multi-modal study design to a large sample size. Further investigation with a larger sample size is needed in the future. Secondly, these results were reflected in T2DM postmenopausal women. It is unclear whether these correlations can be observed in younger, as well as male T2DM populations. Thirdly, our study population only included Asians and Caucasian patients. An additional study with African-Americans, who have been shown to have a high prevalence of T2DM, should be investigated in the future (39;40). Fourthly, VAT may be overestimated due to inadequately assigned pixels (e.g. bowel content within the same attenuation range as VAT), which is a limitation of the study (41). Lastly, reproducibility of the imaging modalities is critical, especially for 1H-MRS. However, we demonstrated acceptable reproducibility errors, not only for 1H-MRS, but for the abdominal fat segmentation of QCT images as well.
In conclusion, this study demonstrated that vertebral bone marrow fat content correlates significantly with abdominal adipose tissue and lumbar spine volumetric BMD in postmenopausal women with and without T2DM. The observed association of vertebral bone marrow fat content with HbA1c levels in T2DM subjects demonstrates an effect of T2DM on vertebral bone marrow fat content that suggests that bone marrow fat may be a biomarker for the extent of glycemic control and potentially for late diabetic complications. Further studies with larger cohorts will need to investigate the role of 1H-MRS based vertebral bone marrow fat quantitation in T2DM.
Acknowledgments
The authors thank Thelma Munoz and Melissa Guan for their help in recruiting and consenting the patients and John Kornak for his advisory function in the statistical analysis. This study was supported by NIH RC1 AR058405.
Grant support: This study was supported by NIH RC1 AR058405.
Reference List
- 1.Gallagher D, Kelley DE, Yim JE, et al. Adipose Tissue Distribution Is Different in Type 2 Diabetes. Am J Clin Nutr. 2009;89(3):807–814. doi: 10.3945/ajcn.2008.26955. [DOI] [PMC free article] [PubMed] [Google Scholar]
- 2.Hamdy O, Porramatikul S, Al Ozairi E. Metabolic Obesity: the Paradox Between Visceral and Subcutaneous Fat. Curr Diabetes Rev. 2006;2(4):367–373. doi: 10.2174/1573399810602040367. [DOI] [PubMed] [Google Scholar]
- 3.Heshka S, Ruggiero A, Bray GA, et al. Altered Body Composition in Type 2 Diabetes Mellitus. Int J Obes (Lond) 2008;32(5):780–787. doi: 10.1038/sj.ijo.0803802. [DOI] [PMC free article] [PubMed] [Google Scholar]
- 4.Dulloo AG, Jacquet J, Solinas G, Montani JP, Schutz Y. Body Composition Phenotypes in Pathways to Obesity and the Metabolic Syndrome. Int J Obes (Lond) 2010;34 (Suppl 2):S4–17. doi: 10.1038/ijo.2010.234. [DOI] [PubMed] [Google Scholar]
- 5.World Health Organisation. Definition, Diagnosis and Classification of Diabetes Mellitus and Its Complications. WHO; 1999. [Google Scholar]
- 6.Bredella MA, Torriani M, Ghomi RH, et al. Vertebral Bone Marrow Fat Is Positively Associated With Visceral Fat and Inversely Associated With IGF-1 in Obese Women. Obesity (Silver Spring) 2011;19(1):49–53. doi: 10.1038/oby.2010.106. [DOI] [PMC free article] [PubMed] [Google Scholar]
- 7.Griffith JF, Yeung DK, Antonio GE, et al. Vertebral Marrow Fat Content and Diffusion and Perfusion Indexes in Women With Varying Bone Density: MR Evaluation. Radiology. 2006;241(3):831–838. doi: 10.1148/radiol.2413051858. [DOI] [PubMed] [Google Scholar]
- 8.Yoshizumi T, Nakamura T, Yamane M, et al. Abdominal Fat: Standardized Technique for Measurement at CT. Radiology. 1999;211(1):283–286. doi: 10.1148/radiology.211.1.r99ap15283. [DOI] [PubMed] [Google Scholar]
- 9.Schellinger D, Lin CS, Hatipoglu HG, Fertikh D. Potential Value of Vertebral Proton MR Spectroscopy in Determining Bone Weakness. AJNR Am J Neuroradiol. 2001;22(8):1620–1627. [PMC free article] [PubMed] [Google Scholar]
- 10.Machann J, Thamer C, Stefan N, et al. Follow-Up Whole-Body Assessment of Adipose Tissue Compartments During a Lifestyle Intervention in a Large Cohort at Increased Risk for Type 2 Diabetes. Radiology. 2010;257(2):353–363. doi: 10.1148/radiol.10092284. [DOI] [PubMed] [Google Scholar]
- 11.Bredella MA, Fazeli PK, Miller KK, et al. Increased Bone Marrow Fat in Anorexia Nervosa. J Clin Endocrinol Metab. 2009;94(6):2129–2136. doi: 10.1210/jc.2008-2532. [DOI] [PMC free article] [PubMed] [Google Scholar]
- 12.Masala S, Massari F, Assako OP, et al. Is 3T-MR Spectroscopy a Predictable Selection Tool in Prophylactic Vertebroplasty? Cardiovasc Intervent Radiol. 2010;33(6):1243–1252. doi: 10.1007/s00270-010-9821-2. [DOI] [PubMed] [Google Scholar]
- 13.Oriol A, Valverde D, Capellades J, Cabanas ME, Ribera JM, Arus C. In Vivo Quantification of Response to Treatment in Patients With Multiple Myeloma by 1H Magnetic Resonance Spectroscopy of Bone Marrow. MAGMA. 2007;20(2):93–101. doi: 10.1007/s10334-007-0072-4. [DOI] [PubMed] [Google Scholar]
- 14.Rosen CJ, Ackert-Bicknell C, Rodriguez JP, Pino AM. Marrow Fat and the Bone Microenvironment: Developmental, Functional, and Pathological Implications. Crit Rev Eukaryot Gene Expr. 2009;19(2):109–124. doi: 10.1615/critreveukargeneexpr.v19.i2.20. [DOI] [PMC free article] [PubMed] [Google Scholar]
- 15.Botolin S, McCabe LR. Bone Loss and Increased Bone Adiposity in Spontaneous and Pharmacologically Induced Diabetic Mice. Endocrinology. 2007;148(1):198–205. doi: 10.1210/en.2006-1006. [DOI] [PubMed] [Google Scholar]
- 16.Nelson SJ. Analysis of Volume MRI and MR Spectroscopic Imaging Data for the Evaluation of Patients With Brain Tumors. Magnetic Resonance in Medicine. 2001;46(2):228–239. doi: 10.1002/mrm.1183. [DOI] [PubMed] [Google Scholar]
- 17.Li X, Youngren JF, Hyun B, et al. Technical Evaluation of in Vivo Abdominal Fat and IMCL Quantification Using MRI and MRSI at 3 T. Magn Reson Imaging. 2008;26(2):188–197. doi: 10.1016/j.mri.2007.06.006. [DOI] [PMC free article] [PubMed] [Google Scholar]
- 18.Li X, Kuo D, Schafer AL, et al. Quantification of Vertebral Bone Marrow Fat Content Using 3 Tesla MR Spectroscopy: Reproducibility, Vertebral Variation, and Applications in Osteoporosis. J Magn Reson Imaging. 2011;33(4):974–979. doi: 10.1002/jmri.22489. [DOI] [PMC free article] [PubMed] [Google Scholar]
- 19.Li X, Nelson SJ. Reliable in Vivo Lactate and Lipid Estimation in Glioma Patients. Proceedings of the 25th Annual International Conference of IEEE Engineering in Medicine and Biology Society (EMBS); Cancun, Mexico. 2003. [Google Scholar]
- 20.Gluer CC, Blake G, Lu Y, Blunt BA, Jergas M, Genant HK. Accurate Assessment of Precision Errors: How to Measure the Reproducibility of Bone Densitometry Techniques. Osteoporos Int. 1995;5(4):262–270. doi: 10.1007/BF01774016. [DOI] [PubMed] [Google Scholar]
- 21.Goodpaster BH, Krishnaswami S, Resnick H, et al. Association Between Regional Adipose Tissue Distribution and Both Type 2 Diabetes and Impaired Glucose Tolerance in Elderly Men and Women. Diabetes Care. 2003;26(2):372–379. doi: 10.2337/diacare.26.2.372. [DOI] [PubMed] [Google Scholar]
- 22.Stewart KJ, Deregis JR, Turner KL, et al. Fitness, Fatness and Activity As Predictors of Bone Mineral Density in Older Persons. J Intern Med. 2002;252(5):381–388. doi: 10.1046/j.1365-2796.2002.01050.x. [DOI] [PubMed] [Google Scholar]
- 23.Reid IR. Fat and Bone. Arch Biochem Biophys. 2010 Jan 11;503(1):20–27. doi: 10.1016/j.abb.2010.06.027. [DOI] [PubMed] [Google Scholar]
- 24.Gilsanz V, Chalfant J, Mo AO, Lee DC, Dorey FJ, Mittelman SD. Reciprocal Relations of Subcutaneous and Visceral Fat to Bone Structure and Strength. J Clin Endocrinol Metab. 2009;94(9):3387–3393. doi: 10.1210/jc.2008-2422. [DOI] [PMC free article] [PubMed] [Google Scholar]
- 25.Zillikens MC, Uitterlinden AG, van Leeuwen JP, et al. The Role of Body Mass Index, Insulin, and Adiponectin in the Relation Between Fat Distribution and Bone Mineral Density. Calcif Tissue Int. 2010;86(2):116–125. doi: 10.1007/s00223-009-9319-6. [DOI] [PMC free article] [PubMed] [Google Scholar]
- 26.von Muhlen D, Safii S, Jassal SK, Svartberg J, Barrett-Connor E. Associations Between the Metabolic Syndrome and Bone Health in Older Men and Women: the Rancho Bernardo Study. Osteoporos Int. 2007;18(10):1337–1344. doi: 10.1007/s00198-007-0385-1. [DOI] [PubMed] [Google Scholar]
- 27.Griffith JF, Yeung DK, Antonio GE, et al. Vertebral Bone Mineral Density, Marrow Perfusion, and Fat Content in Healthy Men and Men With Osteoporosis: Dynamic Contrast-Enhanced MR Imaging and MR Spectroscopy. Radiology. 2005;236(3):945–951. doi: 10.1148/radiol.2363041425. [DOI] [PubMed] [Google Scholar]
- 28.Tang GY, Lv ZW, Tang RB, et al. Evaluation of MR Spectroscopy and Diffusion-Weighted MRI in Detecting Bone Marrow Changes in Postmenopausal Women With Osteoporosis. Clin Radiol. 2010;65(5):377–381. doi: 10.1016/j.crad.2009.12.011. [DOI] [PubMed] [Google Scholar]
- 29.Blake GM, Griffith JF, Yeung DK, Leung PC, Fogelman I. Effect of Increasing Vertebral Marrow Fat Content on BMD Measurement, T-Score Status and Fracture Risk Prediction by DXA. Bone. 2009;44(3):495–501. doi: 10.1016/j.bone.2008.11.003. [DOI] [PubMed] [Google Scholar]
- 30.Yeung DK, Griffith JF, Antonio GE, Lee FK, Woo J, Leung PC. Osteoporosis Is Associated With Increased Marrow Fat Content and Decreased Marrow Fat Unsaturation: a Proton MR Spectroscopy Study. J Magn Reson Imaging. 2005;22(2):279–285. doi: 10.1002/jmri.20367. [DOI] [PubMed] [Google Scholar]
- 31.Cheng AY, Leiter LA. Diabetes and Cardiovascular Disease: the Role of Glycemic Control. Curr Diab Rep. 2009;9(1):65–72. doi: 10.1007/s11892-009-0012-y. [DOI] [PubMed] [Google Scholar]
- 32.Cheng AY, Leiter LA. Glucose Lowering and Cardiovascular Disease: What Do We Know and What Should We Do? Eur J Cardiovasc Prev Rehabil. 2010;17 (Suppl 1):S25–S31. doi: 10.1097/01.hjr.0000368194.32356.5f. [DOI] [PubMed] [Google Scholar]
- 33.Inoue K, Matsumoto M, Akimoto K. Fasting Plasma Glucose and HbA1c As Risk Factors for Type 2 Diabetes. Diabet Med. 2008;25(10):1157–1163. doi: 10.1111/j.1464-5491.2008.02572.x. [DOI] [PubMed] [Google Scholar]
- 34.Maynard JD, Rohrscheib M, Way JF, Nguyen CM, Ediger MN. Noninvasive Type 2 Diabetes Screening: Superior Sensitivity to Fasting Plasma Glucose and A1C. Diabetes Care. 2007;30(5):1120–1124. doi: 10.2337/dc06-2377. [DOI] [PubMed] [Google Scholar]
- 35.Bennett CM, Guo M, Dharmage SC. HbA(1c) As a Screening Tool for Detection of Type 2 Diabetes: a Systematic Review. Diabet Med. 2007;24(4):333–343. doi: 10.1111/j.1464-5491.2007.02106.x. [DOI] [PubMed] [Google Scholar]
- 36.Kramer CK, Araneta MR, Barrett-Connor E. A1C and Diabetes Diagnosis: The Rancho Bernardo Study. Diabetes Care. 2010;33(1):101–103. doi: 10.2337/dc09-1366. [DOI] [PMC free article] [PubMed] [Google Scholar]
- 37.Kuchuk NO, van Schoor NM, Pluijm SM, Chines A, Lips P. Vitamin D Status, Parathyroid Function, Bone Turnover, and BMD in Postmenopausal Women With Osteoporosis: Global Perspective. J Bone Miner Res. 2009;24(4):693–701. doi: 10.1359/jbmr.081209. [DOI] [PubMed] [Google Scholar]
- 38.von Muhlen DG, Greendale GA, Garland CF, Wan L, Barrett-Connor E. Vitamin D, Parathyroid Hormone Levels and Bone Mineral Density in Community-Dwelling Older Women: the Rancho Bernardo Study. Osteoporos Int. 2005;16(12):1721–1726. doi: 10.1007/s00198-005-1910-8. [DOI] [PubMed] [Google Scholar]
- 39.Hoffman RP. Metabolic Syndrome Racial Differences in Adolescents. Curr Diabetes Rev. 2009;5(4):259–265. doi: 10.2174/157339909789804332. [DOI] [PubMed] [Google Scholar]
- 40.McNabb W, Quinn M, Tobian J. Diabetes in African American Women: the Silent Epidemic. Womens Health. 1997;3(3–4):275–300. [PubMed] [Google Scholar]
- 41.Potretzke AM, Schmitz KH, Jensen MD. Preventing Overestimation of Pixels in Computed Tomography Assessment of Visceral Fat. Obes Res. 2004;12(10):1698–1701. doi: 10.1038/oby.2004.210. [DOI] [PubMed] [Google Scholar]