

Abstract
Purpose
The Patient Reported Outcomes Measurement Information System (PROMIS) aims to develop patient-reported outcome (PROs) instruments for use in clinical research. The PROMIS pediatrics (ages 8–17) project focuses on the development of PROs across several health domains (physical function, pain, fatigue, emotional distress, social role relationships, and asthma symptoms). The objective of the present study is to report on the psychometric properties of the PROMIS Pediatric Anger Scale.
Methods
Participants (n=759) were recruited in public school settings, hospital-based outpatient and subspecialty pediatrics clinics. The anger items (k=10) were administered on one test form. A hierarchical confirmatory factor analytic model (CFA) was conducted to evaluate scale dimensionality and local dependence. Item response theory (IRT) analyses were then used to finalize the item scale and short form.
Results
CFA confirmed that the anger items are representative of a unidimensional scale and items with local dependence were removed resulting in a six-item short form. The IRT-scaled scores from summed scores and each score’s conditional standard error were calculated for the new six-item PROMIS Pediatric Anger Scale.
Conclusions
This study provides initial calibrations of the anger items and creates the PROMIS Pediatric Anger Scale, version 1.0
Keywords: PROMIS, Anger, HRQOL, PRO, Scale Development, Surveys, Pediatrics
Background
The Patient Reported Outcomes Measurement Information System (PROMIS) project, a National Institutes of Health (NIH) Roadmap for Medical Research initiative, was developed to advance the science and application of patient-reported outcomes (PROs) among patients with chronic diseases [1]. One primary goal of the PROMIS initiative is to develop a set of patient-reported items for use in clinical research. The development process utilized modern psychometric methods including item response theory (IRT), to analyze and select the most informative items.
The PROMIS Pediatric project focused on the development of PROs to assess quality of life across several generic health domains for youth ages 8–17 years. These domains are important across a variety of pediatric chronic illnesses, and include physical function, pain, fatigue, emotional distress, and social function [3, 11, 45–48].
Emotional distress commonly refers to unpleasant feelings or emotions that are experienced privately and, therefore, are good candidates for assessment as PROs. Emotional distress among children is partially comprised of feelings of anxiety, depression, and anger [4]. Several studies have shown these three components (anxiety, depression and anger) of emotional distress to be unidimensional constructs [34]. Previously, we reported on the psychometric properties of the NIH PROMIS Pediatric Depressive Symptoms and Anxiety Scales [47]. The emotional distress anger domain is the focus of the present report.
Three modalities of anger have been recognized: cognitive (appraisals), somatic-affective (tension and agitations) and behavioral (withdrawal and antagonism). The external expression of anger can be found in facial expressions, body language, physiological responses, and at times in acts of aggression [5]. The PROMIS pediatric item scale for anger focuses on the behavior component including angry moods (e.g., irritability and reactivity), and aggression (verbal and physical).
PROMIS Pediatric items across domains were developed using a strategic item generation methodology adopted by the PROMIS Network.[6] Six phases of item development were implemented: identification of existing items, item classification and selection, item review and revision, focus group input on domain coverage, cognitive interviews with individual items, and final revision before field testing. [3, 6, 7, 8] Items successfully screened through the process were sent to field testing (n=10 anger items).
Only a limited number of generic self-report health-related quality of life (HRQOL) instruments exist for use in pediatric populations and while most attempt to measure at least some aspect of emotional distress; they do not typically include an anger-specific domain [9, 10]. PROMIS psychometric analyses focus on determining scale dimensionality and detecting sources of local dependence (LD) using CFA methods and selecting final items and testing for differential item functioning (DIF) using IRT analyses. The primary objective of the present paper is to describe the IRT analyses of the PROMIS pediatric anger items and the measurement properties of the new PROMIS Pediatric Anger Scale that resulted from these IRT analyses, including investigations of scale dimensionality, item fit, sources of local dependence, and DIF.
Methods
Sampling Plan
Participants from North Carolina and Texas were recruited in hospital-based outpatient general pediatrics and subspecialty clinics and in public school settings between January 2007 and May 2008. To be eligible to participate in the large-scale testing survey, subjects were required to meet the following inclusion criteria: between the ages of 8 to 17 years old; able to speak and read English; and able to see and interact with a computer screen, keyboard, and mouse. Parental informed consent and minor assent were obtained for all children taking the survey. The study received IRB approval from regulatory boards at participating institutions. A more detailed description of the survey methods and the study population has been published previously [11].
The PROMIS anger items were administered to 759 respondents. The sampling plan was developed for collecting responses to candidate items from all of the targeted PROMIS domains and accommodated multiple objectives including: (1) confirm the factor structure of the domains; (2) evaluate items for (LD and DIF; and (3) calibrate the items for each domain using IRT. A more detailed description of the sampling plan is described elsewhere [11].
All of the anger items had a 7-day recall period and used standardized 5-point response options (never, almost never, sometimes, often, almost always). Table 2 shows the anger items administered during the testing.
Table 2.
Factor Loadings and Residual Correlations for an Augmented Bi-Factor Model
| Item Stem | General Factor | Orthogonal Group-Specific Factors
|
Doublet Residual Correlations | ||||
|---|---|---|---|---|---|---|---|
| Anger | Anxiety | Depressive Symptoms | Triplet 1 | Triplet 2 | |||
| Anger | |||||||
| I felt mad. | 0.47 | 0.57 | 0.24 | ||||
| I felt angry. | 0.48 | 0.56 | |||||
| I was so angry I felt like throwing something. | 0.50 | 0.56 | 0.41 | ||||
| I was so angry I felt like hitting something. | 0.47 | 0.53 | 0.47 | ||||
| I was so angry I felt like breaking things. | 0.49 | 0.41 | 0.51 | ||||
| I was so angry I felt like yelling at somebody. | 0.48 | 0.60 | 0.18 | ||||
| I was so angry I acted grouchy towards other people. | 0.45 | 0.53 | |||||
| When I got mad, I stayed mad. | 0.52 | 0.40 | |||||
| I felt fed up. | 0.45 | 0.37 | |||||
| I felt upset. | 0.65 | 0.21 | |||||
| Anxiety | |||||||
| I felt afraid. | 0.53 | 0.51 | 0.47 | ||||
| I got scared really easy. | 0.50 | 0.52 | 0.52 | ||||
| I felt afraid or scared. | 0.65 | 0.31 | 0.29 | ||||
| It was hard for me to stop worrying. | 0.60 | 0.45 | 0.27 | ||||
| I worried about what could happen to me. | 0.55 | 0.54 | |||||
| I woke up at night scared. | 0.56 | 0.50 | |||||
| I was afraid that I would make mistakes. | 0.59 | 0.26 | |||||
| It was hard for me to relax. | 0.65 | 0.19 | |||||
| I worried when I was away from home. | 0.49 | 0.42 | |||||
| I felt nervous. | 0.56 | 0.24 | |||||
| Depressive Symptoms | |||||||
| I felt everything in my life went wrong. | 0.81 | 0.18 | |||||
| I felt like I couldn’t do anything right. | 0.79 | 0.34 | |||||
| I felt so bad that I didn’t want to do anything. | 0.75 | 0.22 | |||||
| I felt alone. | 0.74 | 0.19 | 0.28 | ||||
| I felt that no one loved me. | 0.75 | 0.11 | |||||
| Being sad made it hard for me to do things with my friends. | 0.80 | 0.04 | 0.20 | ||||
| It was hard to do school work because I felt sad. | 0.75 | −0.09 | |||||
| I felt like crying. | 0.74 | −0.25 | 0.31 | ||||
| I cried more than usual. | 0.74 | −0.27 | |||||
| I wanted to be by myself. | 0.39 | 0.25 | |||||
Italicized entries are less than two standard errors from zero.
Statistical and Psychometric Methods
Data analysis followed the sequence of procedures presented by Reeve et al. [2] in their description of plans for psychometric evaluation and calibration of HRQOL items for PROMIS. First, traditional descriptive statistics were computed, as a check on data entry and validity, and to verify that there were no empty (zero frequency) response categories for any item. These statistics included the frequencies and proportions in each item response category and the correlation of the item scores with the total summed score.
Second, to determine the extent to which the anger items measure a construct that is distinct from constructs measured by other types of questions indicating emotional distress, and as a check on the unidimensionality of the anger subset of items, the dimensionality of individual differences on all of the emotional distress items (designed to measure anger, anxiety, and depressive symptoms) was examined using a hierarchical confirmatory factor analysis (CFA) of the inter-item polychoric correlation matrix. These analyses were performed using the “weighted least squares with robust standard errors, mean- and variance-adjusted” (WLSMV) algorithm [12] as implemented in the software Mplus [13]. Respondents with missing item responses were set aside for this analysis (“listwise deletion”). Additional factors fitted over and above those indicated by the design of the questionnaire and residual correlations significantly greater than zero served as indices of LD for pairs or small numbers of items that violated the LD assumption of unidimensional IRT [14]. If a pair of items exhibited LD, one item from the pair was set aside.
Third, within the sets of items for which unidimensionality had been confirmed using CFA, the items were “calibrated” by fitting Samejima’s Graded Response Model [15, 16] using the software Multilog [17]. This model characterizes each item with a slope or discrimination parameter (a), that reflects the degree of association of the item responses with the latent construct being measured, and four threshold parameters (bk) (for five-alternative items), that indicate the level of anger at which a response in a particular category or higher becomes likely. This model has been selected for the NIH PROMIS scales [2]. The goodness of fit of the IRT model to the data was examined using Orlando and Thissen’s [18, 19] S-X2 statistic as generalized by Bjorner et al [20] for polytomous response data. Because S-X2 is a goodness of fit statistic, a nonsignificant value indicates adequate fit of the model to the data; significant values suggest close examination of the tables of response frequencies classified according to summed scores on the other items to identify the source of misfit. For the IRT item calibration, and for the IRT DIF analysis in the fourth step (below), missing item responses were treated as missing at random.
Fourth, the possibility of DIF was investigated for each item using the IRT-LR DIF detection procedure [21] as implemented in the software IRTLRDIF [22]. DIF indicates that the relation of the item responses with the latent variable being measured differs between two (most often demographic) groups. Such a difference implies that some other factor, related to group membership but different from the construct being measured, had an influence on the item responses, violating the IRT assumption of unidimensionality. In the present data, the only background variable that divides the sample into two groups that are sufficiently large to examine DIF is gender, so the DIF analysis was done separating the data into responses from boys and girls. In addition, some DIF analyses were done examining age groups of younger (ages 8–12) and older (ages 13–17) children. IRT-LR DIF detection provides a χ2-distributed test statistic; again, a nonsignificant value is the desirable outcome, indicating a lack of detectable DIF. We used the Benjamini-Hochberg [23, 24] procedure to control for the multiplicity of comparisons involved in checking each item for DIF using = 0.05, and graphical methods, as suggested by Steinberg and Thissen [25] to evaluate effect size when DIF was detected.
Fifth, after the final item pools were selected, confirmatory factor analysis (CFA) of the interitem polychoric correlation matrix among the remaining, selected items was used to ensure that the latent variables underlying the item responses for the anger items were unidimensional in the final item pools. These analyses were performed using the WLSMV algorithm as implemented in the software Mplus [12]. Respondents with missing item responses were set aside for this analysis (“listwise deletion”). An additional three-factor correlated simple-structure CFA model was used to estimate the “disattenuated” correlations among the latent variables for Anger, Anxiety, and Depressive Symptoms.
Finally, IRT scores for the scales are based on the graded response model (GRM) parameters after the scales are assembled [27]. All IRT-based scores are relative to some reference group [28]; in this case the reference group is the subset of the sample from the NC site. While IRT-scaled scores may be based either on item response patterns or summed scores, we expect most often scale scores based on summed scores will be used; score translation tables for that purpose are provided in the Appendix.
Results
Descriptive Statistics
The anger items were among a set of emotional distress items (that also included depressive symptoms and anxiety items) completed by 759 respondents between the ages of 8 to 17 were sampled. Fifty-nine percent of respondents were between 8 to 12 years old and 60% were Caucasian. Nineteen percent of the sample was of Hispanic ethnicity and approximately 21% of the children participating in the survey had a chronic illness diagnosis during the past 6 months (Table 1). The vast majority of the adults providing informed consent for the children were the parents and 27% of the adults providing consent had a high school education or less.
Table 1.
Item Calibration Participants Demographic and Background Information
| Anger Form n=759 (%) | |
|---|---|
| Child’s Gender | |
| Male | 382 (50.3) |
| Female | 377 (49.7) |
| Missing | 0 |
| Child’s Age (yrs) | |
| 8–12 | 446 (58.8) |
| 13–17 | 312 (41.1) |
| Missing | 1 (0.1) |
| Child’s Race | |
| White | 457 (60.2) |
| Black or African-American | 154 (20.2) |
| American Indian/Alaska Native | 5 (0.6) |
| Asian | 12 (1.6) |
| Native Hawaiian/Pacific Is. | 0 |
| Other | 58 (7.6) |
| Multiple Races | 47 (6.2) |
| Missing | 26 (3.4) |
| Child’s Ethnicity | |
| Non Hispanic | 614 (80.9) |
| Hispanic | 141 (18.6) |
| Missing | 4 (0.5) |
| Child’s Chronic Conditions - 6 mo | |
| No | 600 (79.0) |
| Yes | 157 (20.7) |
| Missing | 2 (0.3) |
| Guardian’s* Relationship to Child | |
| Parent | 696 (91.7) |
| Grandparent | 32 (4.2) |
| Guardian or Other | 31 (4.1) |
| Missing | 0 |
| Guardian’s* Education Level | |
| <= 8th grade | 12 (1.6) |
| Some high school | 39 (5.1) |
| High school degree/GED | 151 (19.9) |
| Some college/technical degree | 255 (33.6) |
| College degree | 179 (23.6) |
| Advanced degree | 121 (15.9) |
| Missing | 2 (0.3) |
| Data Collection Site | |
| Schools – NC | 57 (7.5) |
| Clinics - NC | 349 (46.0) |
| Clinics – TX | 353 (46.5) |
guardian, parent or care giver completing sociodemographic form and signing consent documents
Confirmatory Factor Analysis
A CFA model was fit to depressive symptoms, anxiety, and anger items. The augmented bi-factor model contains factor loadings on the general factor for all items, group-specific loadings for each domain (anger, anxiety, or depressive symptoms), and a set of loadings or residual correlations which identify sources of local dependence (Table 2). This model serves two purposes: 1) the model establishes whether anger is representative of a separate individual differences latent construct, or if variation among the item responses is indicative of a single negative affect dimension, and 2) by identifying LD in the CFA, item calibrations may be conducted with unidimensional subsets of items. Indices of goodness of fit, as suggested by Reeve [2], indicate that the augmented bifactor model fits the data well, χ2(119) = 358, CFI = 0.935, TLI = 0.983, RMSEA = 0.060.
The large, non-zero loadings on the anger-specific factor indicate that the covariation among anger item responses is distinct from the covariation among anxiety and depression items. The bifactor model also identified subsets of locally dependent anger items. The subfactor labeled “Triplet 1,” contains three items similar in wording and content. Two additional “doublets” are modeled with residual correlations. Taken together, these findings indicate the possibility of constructing a unidimensional anger scale, possibly setting aside items that exhibit LD.
Anger Item Calibrations
To avoid calibrating items with known dependencies, two separate calibrations were completed [29]. Each calibration contained the non-LD items along with a single item from the triplet (the item “I was so angry I felt like breaking things” was set aside from the triplet prior to calibration). This procedure resulted in two sets of item parameters for each non-LD item, and from each we conservatively selected the set of item parameters which contained the lower slope (a). The values of item parameters, item fit statistics (S-X2), and LR-DIF statistics for the nine items are ordered by the magnitude of the slope parameter in Table 3; the generally best items appear towards the top of the table. The S-X2 values reach significance for several of the items. Careful examination of the tables of response frequencies classified according to summed scores on the other items reveals that these significant statistics are due entirely to deviations in a very small number of cells, without any pattern suggesting global misfit of the item response model. Examples are somewhat too many observed “0” responses when the sum of the (other) items’ scores is zero, which commonly occurs when respondents tend to choose the same response for all items somewhat more than the IRT model would predict, or a randomly located cell in the table with four observed responses and an expected value close to 1.0. The test statistic is sensitive to such features of the data, although they are not meaningfully interpretable.
Table 3.
Item Parameters and values for the SS X2 Fit Index and LR DIF Statistics for the Anger Items
| Item Stem | Item Parameters | S-X2 Fit Index | DIF between boys and girls | ||||||||
|---|---|---|---|---|---|---|---|---|---|---|---|
| a | b1 | b2 | b3 | b4 | X2 | d.f. | p | X2 | d.f. | p | |
| I felt mad. | 2.15 | −1.54 | −0.47 | 1.56 | 2.56 | 41 | 29 | .076 | 4.0 | 5 | 0.549 |
| I was so angry I felt like yelling at somebody. | 1.97 | −0.47 | 0.41 | 1.51 | 2.16 | 52 | 33 | .019 | 1.1 | 5 | 0.954 |
| I was so angry I felt like throwing something. | 1.82 | 0.20 | 0.98 | 2.14 | 2.75 | 54 | 30 | .005 | 15.0 | 5 | 0.010 |
| When I got mad, I stayed mad. | 1.55 | 0.01 | 1.04 | 2.33 | 3.30 | 52 | 31 | .010 | 2.7 | 5 | 0.746 |
| I felt upset. | 1.53 | −1.41 | −0.24 | 1.58 | 2.66 | 63 | 32 | .001 | 23.0 | 5 | 0.000 |
| I felt fed up.† | 1.31 | −0.54 | 0.41 | 2.07 | 3.54 | 51 | 35 | .036 | 5.3 | 5 | 0.380 |
| Items set aside due to LD: | |||||||||||
| I felt angry. | 1.72 | −1.13 | 0.04 | 1.83 | 3.07 | 34 | 32 | 0.370 | 9.3 | 5 | 0.098 |
| I was so angry I acted grouchy towards other people. | 1.73 | −0.61 | 0.14 | 1.42 | 2.39 | 46 | 34 | 0.081 | 8.9 | 5 | 0.113 |
| I was so angry I felt like hitting something. | 1.51 | 0.20 | 1.00 | 2.06 | 3.00 | 31 | 31 | 0.457 | 22.0 | 5 | 0.001 |
The scale for the item parameters is set such that the distribution of depressive symptoms in the reference population (represented by the NC portion of the sample) is standardized, mean 0 variance 1, as is conventional for reporting IRT parameters.
In the analysis of DIF by age (8–12 and 13–17 years old), only “I felt fed up” exhibited significant DIF after the Benjamini-Hochberg correction.
Table 3 contains the six items that comprise the anger scale. Final items were selected by setting aside the less discriminating item from each locally dependent pair of items. To validate these steps, a one-factor CFA was fit to the six-item scale. This model fit the data well, indicating that the six-items are acceptably fitted with a unidimensional model, χ2(8) = 39, CFI = 0.979, TLI = 0.981, RMSEA = 0.074. Item-total correlations for the six item anger scale ranged from r = .49 to .59.
Differential Item Functioning
The six-item anger scale contains two items with significant gender DIF after using the Benjamini-Hochberg correction for multiplicity: “I was so angry I felt like throwing something” had higher scores than expected for boys (i.e., boys were more likely to endorse this item than mean and variance differences between gender would anticipate), and “I felt upset” had higher (conditional) scores for girls. Figure 1 plots the expected score curves for boys and girls using item parameters for the four non-DIF items and the gender-specific parameters for the two DIF items. The figure illustrates the degree to which these DIF items counterbalance (i.e., DIF cancellation) [26]. In addition to gender DIF, we considered DIF between younger (ages 8–12) and older (ages 13–17) children, and identified a single item, “I felt fed up”, which exhibited DIF after Benjamini-Hochberg correction. The “significant” DIF was largely a-DIF, with the discrimination parameter estimated to be 1.72 for the older children as opposed to 0.99 for the younger children. Neither estimate differed sufficiently from the common estimate of 1.31 to justify exclusion of the item.
Figure 1.
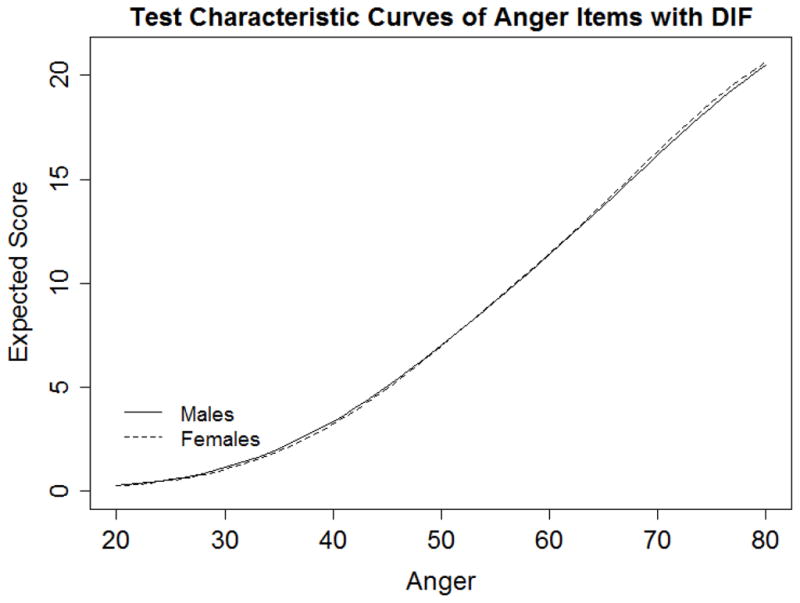
Expected Score Curves of Anger Items by Gender.
Correlations among the Scales
After the final PROMIS pediatric Anger, Anxiety, and Depressive Symptoms Scales were constructed, a correlated simple-structure CFA model was fitted to the final item sets for the three scales simultaneously to estimate the correlations among the latent variables. The correlations between Anger and Anxiety and Depressive Symptoms Scales were 0.66 and 0.77 respectively; the correlation between Anxiety and Depressive Symptoms Scales was 0.84.
IRT Scale Scores
Figure 2 shows the test information function for the six-item PROMIS Pediatric Anger Scale on a T-score scale with a mean of 50 and standard deviation of 10 (the standard metric for PROMIS scales). Test information is the expected value of the inverse of the squared standard error of measurement, which is an indicator of score precision. A standard error of 0.45 on the standardized scale, or 4.5 on the T-score metric, is associated with an information value of nearly 5 and hence a reliability coefficient of approximately 0.8. Anger scores between approximately 40 and 80 have information values greater than 5 on the T-score metric (Figure 2) and standard errors less than 4.5 (Table A1). This indicates that for the approximately 84% of respondents in the general population with anger scores that exceed 40 on the T-score scale, the IRT standard errors correspond to those that would be obtained with a scale with reliability of 0.8. The six-item PROMIS Pediatric Anger Scale listed in the Appendix contains the IRT-scaled scores from summed scores and each score’s conditional standard error. The items and score translation table are available at www.nihpromis.org.
Figure 2.
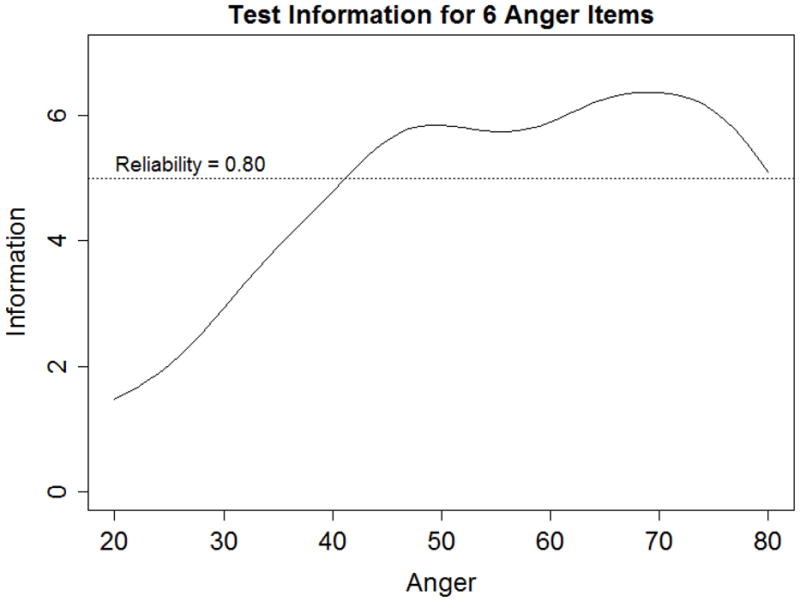
Test information curves for the most informative set of six items from the anger item pool at T-scores of 30, 40, 50, 60, and 70.
Table A1.
Summed Score to Scale Score Translation Table for the Anger Items
| Summed Score | Scale Score | SD |
|---|---|---|
| 0 | 31 | 5.8 |
| 1 | 36 | 5.1 |
| 2 | 39 | 4.9 |
| 3 | 42 | 4.7 |
| 4 | 44 | 4.6 |
| 5 | 46 | 4.5 |
| 6 | 49 | 4.4 |
| 7 | 51 | 4.4 |
| 8 | 52 | 4.3 |
| 9 | 54 | 4.3 |
| 10 | 56 | 4.3 |
| 11 | 58 | 4.3 |
| 12 | 60 | 4.3 |
| 13 | 61 | 4.3 |
| 14 | 63 | 4.3 |
| 15 | 65 | 4.2 |
| 16 | 66 | 4.2 |
| 17 | 68 | 4.2 |
| 18 | 70 | 4.2 |
| 19 | 72 | 4.2 |
| 20 | 73 | 4.3 |
| 21 | 75 | 4.3 |
| 22 | 78 | 4.5 |
| 23 | 80 | 4.6 |
| 24 | 83 | 4.9 |
Scale scores are on a T-score scale; the values of SD are reported as conditional standard errors of measurement.
Discussion
This study describes the development of the new PROMIS Pediatric Anger Scale based on IRT analyses regarding scale dimensionality, item local dependence and differential item functioning. After determining scale dimensionality, items with LD were next identified and removed resulting in the final PROMIS Pediatric Anger Scale, allowing a variety of possible scoring options that can be tailored to meet the objectives of most clinical research studies.
Two items that exhibited DIF between boys and girls (“I was so angry I felt like throwing something” which had higher scores for boys and “I felt upset” which had higher scores for girls) were included in the final short form. Used together, the DIF for these two items counterbalances almost exactly (see Figure 1). The expected summed scores for boys and girls for any level of underlying latent anger are nearly identical. It would not be recommended to construct an even shorter form that includes only one of these two items, but not the other, as such a shorter form may exhibit bias between boys and girls. However, when both items are used they increase precision of measurement over what it would be if they were both omitted.
In addition to investigating gender DIF, we subsequently considered DIF between younger (ages 8–12) and older (ages 13–17) children, and identified a single item, “I felt fed up”, which exhibited DIF after Benjamini-Hochberg correction. This DIF was mainly due to differences in IRT discrimination parameter between age groups. Use of a common discrimination parameter will lead to overestimation of test precision in the 8–12 year age group. The problem is minor, but can be solved by excluding the item. The six-item scale is available from the NIH PROMIS Assessment Center at www.nihpromis.org, and this site allows the researcher to exclude items from the scale. Several generic self-report HRQOL instruments exist for use in pediatric populations and most attempt to measure at least some aspect of emotional distress. However, these instruments typically do not have an anger specific domain [10]. Those that do exist are either typically not child self-reports and/or utilized classical test theory rather than taking advantage of IRT analysis in the scale development process [41, 42, 43, 44]. PROMIS psychometric analyses focus on determining the scale dimensionality and detecting sources of LD and considered final item selection using IRT analyses. Like PROMIS, two of these newer instruments, KIDSCREEN and PedsQL, utilized qualitative research methods for incorporating the child’s perspective during the development process [30, 31].
One major challenge prior to applying IRT models to the measurement of emotional distress is resolving issues of dimensionality. Conventional wisdom is that emotional distress scales are less likely to fit unidimensional models [32]. Often items are sampled from multiple domains (e.g. mood, behavior, somatic symptoms) in order to capture a comprehensive set of latent construct indications. Hence, it is common to observe higher correlations within domains than is expected under the conditional independence assumption of unidimensional IRT models [33]. One of the initial steps for this project was to develop multidimensional conceptual frameworks that were informed by previous empirical (e.g., factor analytic) and theoretical work as well as to determine the level of resolution at which unidimensional scales could be derived from the domains [3, 6, 7, 8]. Three constructs of emotional distress were conceptualized: depressive symptoms, anxiety and anger. These results of unidimensionality are consistent with a recent meta-analysis [34] and other published studies [35, 36, 37, 38, 39, 40].
The study population was utilized for testing of all of the PROMIS Pediatric items. Hence, we did not sample specifically the entire range of the anger latent trait and this may be a limitation. Instead we enrolled a large diverse sample of children from community and clinical settings [11] and we anticipate that we have good coverage across most of the important traits. Future studies should evaluate these items specifically in children recruited from behavioral or anger management programs. The PROMIS pediatric item scale for anger focuses on angry moods and aggression. Other scales focus on these components but may also contain other subdomains such as social skills with peers and authority figures [41–44].
The PROMIS scales provide separate scores for depressive symptoms, anger and anxiety, the PedsQL Emotional Functioning Scale also includes items that indicate depression, anxiety, and anger while the KIDSCREEN Moods and Emotions scale largely measures depressive symptoms, with one item that may indicate anxiety. It also remains a question for future validity studies to determine the usefulness of separate scores for depressive symptoms, anger and anxiety: Though these constructs are highly correlated, they may be differentially predictive or responsive to a particular treatment. In addition, there may be gender differences that might occur. The separate scores of the PROMIS pediatric emotional distress measures permit study of those questions.
Utilizing IRT analysis to identify final items ultimately offers more flexibility for future users of these items. This approach allows researchers the opportunity to select the most useful items for their study design. We proposed a 6-item anger scale; however, a smaller subset of items can also be used and scored on the same metric as the larger set.
The PROMIS pediatric PROs were developed to provide accurate and efficient assessment of important domains of HRQOL for children, including anger. This sample provides initial calibrations of the PROMIS pediatric anger items and the creation of the corresponding PROMIS Pediatric Anger Scale, version 1.0.
Acknowledgments
We would like to acknowledge the contribution of Harry A. Guess, MD, PhD to the conceptualization and operationalization of this research prior to his death.
This work was funded by the National Institutes of Health through the NIH Roadmap for Medical Research, Grant 1U01AR052181-01, and by SBIR contract HHSN-2612007-00013C with the National Cancer Institute of the National Institutes of Health. Information on the Patient-Reported Outcomes Measurement Information System (PROMIS) can be found at http://nihroadmap.nih.gov/ and http://www.nihpromis.org.
Abbreviations
- PROMIS
Patient Reported Outcomes Measurement Information System
- PedsQL™
Pediatric Quality of Life Inventory™
- HRQOL
health-related quality of life
- PRO
patient reported outcomes
- CFA
confirmatory factor analysis
- IRT
item response theory
- LD
local dependence
- DIF
differential item function
Appendix
Listed below are the item stems for the six-item PROMIS Pediatric Anger Scale. All items use a 7-day recall period (the preface is “In the past seven days”), and a 5-point response scale with the options never (0), almost never (1), sometimes (2), often (3) and almost always (4).
Anger:
I felt mad.
I was so angry I felt like yelling at somebody.
When I got mad, I stayed mad.
I felt fed up.
I was so angry I felt like throwing something.
I felt upset.
Summed score to scale score translation for these short forms is in Table A1.
References
- 1.Ader DN. Developing the Patient-Reported Outcomes Measurement Information System (PROMIS) Medical Care. 2007;45 (Suppl 1):S1–S2. doi: 10.1097/01.mlr.0000258615.42478.55. [DOI] [PMC free article] [PubMed] [Google Scholar]
- 2.Reeve BB, Hays RD, Bjorner JB, Cook KF, Crane PK, Teresi JA, Thissen D, Revicki DA, Weiss DJ, Hambleton RK, Liu H, Gershon R, Reise SP, Cella D. Psychometric evaluation and calibration of health-related quality of life items banks: Plans for the patient-reported outcome measurement information system (PROMIS) Medical Care. 2007;45:S22–31. doi: 10.1097/01.mlr.0000250483.85507.04. [DOI] [PubMed] [Google Scholar]
- 3.Cella D, Yount S, Rothrock N, Gershon R, Cook K, Reeve B, Ader DN, Fries JF, Bruce B, Rose M. The Patient-Reported Outcomes Measurement Information System (PROMIS): Progress of an NIH Roadmap Cooperative Group during its first two years. Medical Care. 2007;45 (Suppl 1):S3–S11. doi: 10.1097/01.mlr.0000258615.42478.55. [DOI] [PMC free article] [PubMed] [Google Scholar]
- 4. [last accessed Oct. 5, 2009]; http://www.nimh.nih.gov/health/topics/child-and-adolescent-mental-health/index.shtml.
- 5.Tangney JP, Hill-Barlow D, Wagner PE, Marschall DE, Borenstein JK, Sanftner J, Mohr T, Gramzow R. Assessing Individual Difference in Constructive Versus Destructive Responses to Anger Across the Lifespan. Journal of Personality and Social Psychology. 1996;70(4):780–796. doi: 10.1037//0022-3514.70.4.780. [DOI] [PubMed] [Google Scholar]
- 6.DeWalt D, Rothrock N, Yount S, Stone AA. PROMIS Cooperative Group: Evaluation of Item Candidates: The PROMIS qualitative item review. Medical Care. 2007;45 (Suppl 1):S12–S21. doi: 10.1097/01.mlr.0000254567.79743.e2. [DOI] [PMC free article] [PubMed] [Google Scholar]
- 7.Walsh TR, Irwin DE, Meier A, Varni JW, DeWalt D. The use of focus groups in the development of the PROMIS Pediatric Item Bank. Qual Life Res. 2008;17:725–735. doi: 10.1007/s11136-008-9338-1. [DOI] [PMC free article] [PubMed] [Google Scholar]
- 8.Irwin DE, Varni JW, Yeatts K, DeWalt D. Cognitive Interviewing Methodology in the Development of a Pediatric Item Bank: A Patient Reported Outcomes Measurement Information System (PROMIS) Study. Health and Quality of Life Outcomes. 2009;7(3):1–10. doi: 10.1186/1477-7525-7-3. [DOI] [PMC free article] [PubMed] [Google Scholar]
- 9.Matza LS, Swensen AR, Flood EM, Secnik K, Leidy NK. Assessment of Health-related quality of life in children: A review of conceptual, methodological, and regulatory issues. Value in Health. 2004;7:79–92. doi: 10.1111/j.1524-4733.2004.71273.x. [DOI] [PubMed] [Google Scholar]
- 10.Ravens-Sieberer U, Erhart M, Wille N, Wetzel R, Nickel J, Bullinger M. Generic Health-Related Quality-of-Life Assessment in Children and Adolescents: Methodological Considerations. Pharmacoeconomics. 2006;24(12):1199–1220. doi: 10.2165/00019053-200624120-00005. [DOI] [PubMed] [Google Scholar]
- 11.Irwin DE, Stucky BD, Thissen D, Morgan DeWitt E, Lai JS, Yeatts K, Varni JW, DeWalt DA. Sampling Plan and Patient Characteristics of the PROMIS Pediatrics Large Scale Survey. Qual Life Res. 2010;19(4):585–594. doi: 10.1007/s11136-010-9618-4. [DOI] [PMC free article] [PubMed] [Google Scholar]
- 12.Muthén B, du Toit SHC, Spisic D. Unpublished technical report. Los Angeles, CA: Muthén & Muthén; 1997. Robust inference using weighted least squared and quadratic estimating equations in latent variable modeling with categorical and continuous outcomes. [Google Scholar]
- 13.Muthen LK, Muthen BO. Mplus User’s Guide. 2. Los Angeles CA: Muthen & Muthen; 2004. [Google Scholar]
- 14.Hill CD, Edwards MC, Thissen D, Langer MM, Wirth RJ, Burwinkle TM, Varni JW. Practical issues in the application of item response theory: A demonstration using items from the Pediatric Quality of Life Inventory™ (PedsQL™) 4.0 Generic Core Scales. Medical Care. 2007;45:S39–47. doi: 10.1097/01.mlr.0000259879.05499.eb. [DOI] [PubMed] [Google Scholar]
- 15.Samejima F. Estimation of latent ability using a response pattern of graded scores. Psychometrika Monograph. 1969;(17) [Google Scholar]
- 16.Samejima F. Graded response model. In: van der Linden WJ, Hambleton RK, editors. Handbook of Modern Item Response Theory. New York: Springer; 1997. pp. 85–100. [Google Scholar]
- 17.du Toit M, editor. IRT from SSI. Lincolnwood, IL: Scientific Software International; 2003. [Google Scholar]
- 18.Orlando M, Thissen D. Likelihood-based item-fit indices for dichotomous item response theory models. Applied Psychological Measurement. 2000;24:50–64. [Google Scholar]
- 19.Orlando M, Thissen D. Further examination of the performance of S-X2, an item fit index for dichotomous item response theory models. Applied Psychological Measurement. 2003;27:289–298. [Google Scholar]
- 20.Bjorner JB, Smith KJ, Edelen MO, Stone C, Thissen D, Sun X. IRTFIT: A Macro for Item Fit and Local Dependence Tests under IRT Models. Lincoln, RI: QualityMetric Incorporated; 2007. [Google Scholar]
- 21.Thissen D, Steinberg L, Wainer H. Detection of differential item functioning using the parameters of item response models. In: Holland PW, Wainer H, editors. Differential Item Functioning. Hillsdale, NJ: Lawrence Erlbaum Associates; 1993. pp. 67–113. [Google Scholar]
- 22.Thissen D. IRTLRDIF: Software for the computation of the statistics involved in item response theory likelihood-ratio tests for differential item functioning. Chapel Hill, NC: L.L. Thurstone Psychometric Laboratory, The University of North Carolina at Chapel Hill; 2001. [Google Scholar]
- 23.Benjamini Y, Hochberg Y. Controlling the false discovery rate: A practical and powerful approach to multiple testing. J Roy Stat Soc B. 1995;57:289–300. [Google Scholar]
- 24.Williams VSL, Jones LV, Tukey JW. Controlling error in multiple comparisons, with examples from state-to-state differences in educational achievement. J Educ Behav Stat. 1999;24:42–69. [Google Scholar]
- 25.Steinberg L, Thissen D. Using effect sizes for research reporting: Examples using item response theory to analyze differential item functioning. Psych Methods. 2006;11:402–415. doi: 10.1037/1082-989X.11.4.402. [DOI] [PubMed] [Google Scholar]
- 26.Drasgow F. Study of the measurement bias of two standardized psychological tests. Journal of Applied Psychology. 1987;72:19–29. [Google Scholar]
- 27.Thissen D, Nelson L, Rosa K, McLeod LD. Item response theory for items scored in more than two categories. In: Thissen D, Wainer H, editors. Test Scoring. Mahwah, NJ: Lawrence Erlbaum Associates; 2001. pp. 141–186. [Google Scholar]
- 28.Thissen D, Reeve BB, Bjorner JB, Chang CH. Methodological issues for building item banks and computerized adaptive scales. Quality of Life Research. 2007;16:109–116. doi: 10.1007/s11136-007-9169-5. [DOI] [PubMed] [Google Scholar]
- 29.Chen WH, Thissen D. Local dependence indices for item pairs using item response theory. J Educ Behav Stat. 1997;22:265–289. [Google Scholar]
- 30.Varni JW, Seid M, Kurtin PS. PedsQL 4.0: Reliability and validity of the Pediatric Quality of Life Inventory Version 4.0 Generic Core Scales in healthy and patient populations. Medical Care. 2001;39:800–812. doi: 10.1097/00005650-200108000-00006. [DOI] [PubMed] [Google Scholar]
- 31.Ravens-Sieberer U, Gosch A, Rajmil L, Erhart M, Bruil J, Duer W, Auquier P, et al. KIDSCREEN-52 Quality of Life Measure for Children and Adolescents. Expert Review of Pharmacoeconomics and Outcomes Research. 2005;5:353–364. doi: 10.1586/14737167.5.3.353. [DOI] [PubMed] [Google Scholar]
- 32.Gibbons RD, Weiss DJ, Kupfer DJ, Frank E, Fagiolini A, Grochocinski VJ, Bhaumik DK, Stover A, Bock RD, Immekus JC. Using computerized adaptive testing to reduce the burden of mental health assessment. Psychiatric Services. 2008;59:361–368. doi: 10.1176/appi.ps.59.4.361. [DOI] [PMC free article] [PubMed] [Google Scholar]
- 33.Bjorner JB, Chang CH, Thissen D, Reeve BB. Developing tailored instruments: item banking and computerized adaptive assessment. Quality of Life Research. 2007;16:95–108. doi: 10.1007/s11136-007-9168-6. [DOI] [PubMed] [Google Scholar]
- 34.Shafer AB. Meta-analysis of the factor structures of four depression questionnaires: Beck, CES-D, Hamilton, and Zung. Journal of Clinical Psychology. 2006;62:123–146. doi: 10.1002/jclp.20213. [DOI] [PubMed] [Google Scholar]
- 35.Watson D, Clark LA, Weber K, Assenheimer JA, Strauss ME, McCormick RA. Testing a tripartite model: I. Evaluating the convergent and discriminant validity of anxiety and depression symptoms. Journal of Abnormal Psychology. 1995a;104:3–14. doi: 10.1037//0021-843x.104.1.3. [DOI] [PubMed] [Google Scholar]
- 36.Watson D, Clark LA, Weber K, Assenheimer JS, Strauss ME, McCormick RA. Testing a tripartite model: II. Exploring the symptom structure of anxiety and depression in student, adult, and patient samples. Journal of Abnormal Psychology. 1995b;104:15–25. doi: 10.1037//0021-843x.104.1.15. [DOI] [PubMed] [Google Scholar]
- 37.Clark LA, Watson D. Tripartite model of anxiety and depression: Psychometric evidence and taxonomic implications. Journal of Abnormal Psychology. 1991;100:316–336. doi: 10.1037//0021-843x.100.3.316. [DOI] [PubMed] [Google Scholar]
- 38.Chorpita BF, Albano AM, Barlow DH. The structure of negative emotions in a clinical sample of children and adolescents. Journal of Abnormal Psychology. 1998;107:74–85. doi: 10.1037//0021-843x.107.1.74. [DOI] [PubMed] [Google Scholar]
- 39.Brown TA, Chorpita BF, Barlow DH. Structural relationships among dimensions of the DSM-IV anxiety and mood disorders and dimensions of negative affect, positive affect, and autonomic arousal. Journal of Abnormal Psychology. 1998;107:179–192. doi: 10.1037//0021-843x.107.2.179. [DOI] [PubMed] [Google Scholar]
- 40.Pilkonis PA, Reise SP, Stover AM, Riley WT, Cella D. Items Banks for Measuring Emotional Distress from the Patient-Reported Outcomes Measurement Information System (PROMIS): Depression, Anxiety, and Anger. 2010 doi: 10.1177/1073191111411667. Manuscript in process. [DOI] [PMC free article] [PubMed] [Google Scholar]
- 41.Flanagan R, Allen K. A Review of the Children’s Inventory of Anger (CHIA): A Needed Measure. Jorunal of Rational-Emotive & Cognitive-Behavior Therapy. 2005;23(3):263–273. [Google Scholar]
- 42.Hagglund KJ, Clay DL, Frank RG, Beck NC, Kashani JH, Hewett J, Johnson J, Goldstein DE, Cassidy JT. Assessing Anger Expression in Children and Adolescents. Journal of Pediatric Psychology. 1992;19(3):291–304. doi: 10.1093/jpepsy/19.3.291. [DOI] [PubMed] [Google Scholar]
- 43.Beck JS, Beck AT, Jolly J Beck. Manual for the Beck Youth Inventories of Emotional & Social Impairment. San Antonio, TX: Psychological Corporation; 2001. [Google Scholar]
- 44.Achenbach TM, Rescorla LA. Manual for the ASEBA school-age forms and profiles. Burlington: University of Vermont, Research Center for Children Youth and Families; 2001. [Google Scholar]
- 45.DeWitt EM, Stucky BD, Thissen D, Irwin DE, Varni JW, Lai JS, Yeatts KB, DeWalt DA. Construction of PROMIS Pediatric Physical Function Scales: Built using Item Response Theory. J Clin Epi. doi: 10.1016/j.jclinepi.2010.10.012. (in press) [DOI] [PMC free article] [PubMed] [Google Scholar]
- 46.Varni JW, Stucky BD, Thissen D, DeWitt EM, Irwin DE, Lai JS, Yeatts K, DeWalt DA. PROMIS Pediatric Pain Interference Scale: An item response theory analysis of the pediatric pain item bank. Journal of Pain. 2010;11:1109–1119. doi: 10.1016/j.jpain.2010.02.005. [DOI] [PMC free article] [PubMed] [Google Scholar]
- 47.Irwin DE, Stucky BD, Langer MM, Thissen D, DeWitt EM, Lai JS, Varni JW, Yeatts K, DeWalt DA. An Item Response Analysis of the Pediatric PROMIS Anxiety and Depressive Symptoms Scales. Quality of Life Research. 2010;19(4):595–607. doi: 10.1007/s11136-010-9619-3. [DOI] [PMC free article] [PubMed] [Google Scholar]
- 48.Yeatts K, Stucky BD, Thissen D, Irwin DE, Varni JW, DeWitt EM, Lai JS, DeWalt DA. Item-analysis of the Pediatric Asthma Impact Scale (PAIS) for the Patient Reported Outcomes Measurement Information System (PROMIS) Journal of Asthma. 2010;47:295–302. doi: 10.3109/02770900903426997. [DOI] [PMC free article] [PubMed] [Google Scholar]