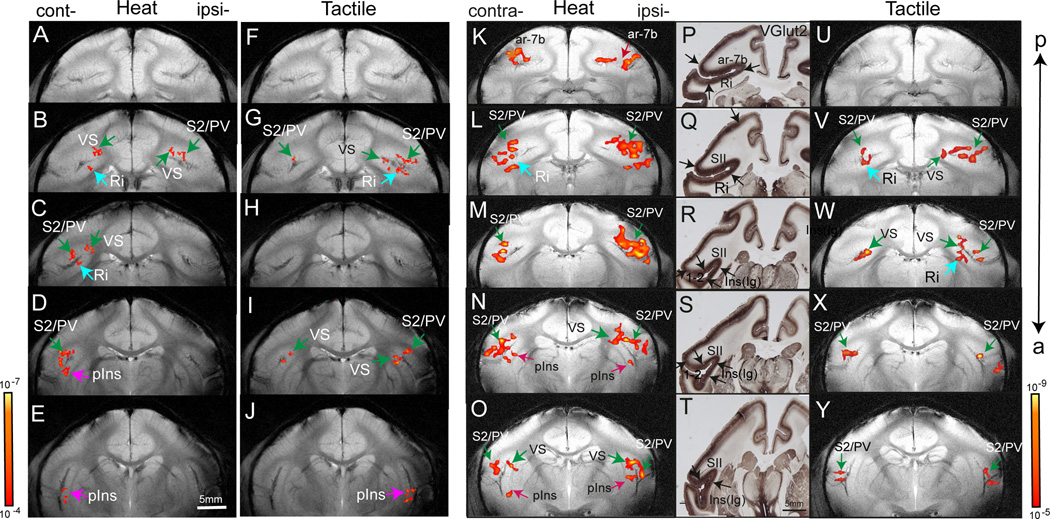
Figure 2.
Comparison of fMRI activation maps in response to nociceptive heat and tactile stimulation in two representative monkeys (M1 and M2). Nociceptive heat (47.5° C) (A–E, K–O) and 8 Hz tactile stimulation (FJ, U–Y) activation maps were overlaid on T2* weighted MRI structural images for display. FMRI activation maps were obtained in M1 at 0.35 × 0.35 mm2 in plane resolution (threshold at p≤ 10−4 and a minimum voxel size of four) and in M2 at 0.7 × 0.7 mm2 in plane resolution (threshold at p≤ 10−5 and a minimum voxel size of two). The p value ranges are indicated in two scale bars next to E and Y. P–T: Immunohistology for VGlut2 in corresponding brain sections. Black arrows indicate the transition area of the stain density of middle layers. Cont-: contralateral hemisphere. Ipsi-: ipsilateral hemisphere. ar-7b: area 7b. Ri: retroinsula. S2: second somatosensory area. PV: parietal ventral area. VS: ventral somatosensory area. pIns: posterior insular region. a: anterior. p: posterior.

