

Abstract
Background
Substantive plasma proteomic changes follow lentiviral infection and disease pathobiology. We posit that such protein alterations are modified during drug abuse, further serving to affect the disease. To this end, we investigated the effect of opiate administration on the plasma proteome of Indian-strain rhesus monkeys infected with simian immunodeficiency virus (SIV) strain smm9.
Methods
Whole blood was collected at 7 weeks prior to and 1.4 and 49 weeks after viral infection. Viral load, CD4+ T cell subsets, and plasma protein content were measured from monkeys that did or did not receive continuous opiate administrations. The plasma proteome was identified and quantified by isobaric tags for relative and absolute quantitation labeling (iTRAQ) and mass spectrometry.
Results
While substantive changes in plasma proteins were seen during SIV infection, the addition of opiates led to suppression of these changes as well as increased variance of the proteome. These changes demonstrate that opiates induce broad but variant immune suppression in SIV-infected monkeys.
Conclusion
The broad suppressive changes seen in plasma of SIV-infected monkeys likely reflect reduced multisystem immune homeostatic responses induced by opiates. Such occur as a consequence of complex cell-to-cell interactions operative between the virus and the host. We conclude that such changes in plasma proteomic profiling may be underappreciated and as such supports the need for improved clinical definitions.
Keywords: SIV, drugs of abuse, plasma proteins, proteomics, opiates, morphine, iTRAQ
1. Introduction
The impact of abused drugs on individuals and society is substantive (Cohen et al., 2002; Kapadia et al., 2005; Pirard et al., 2005; Celentano and Lucas 2007; Bruchas et al., 2010; Fernandez-Serrano et al., 2010). Those who abuse drugs underestimate how the drugs impact their own lives and the lives of those closest to them (Pirard et al., 2005; Bruchas et al., 2010; Fernandez-Serrano et al., 2010). From a healthcare viewpoint, abused drugs significantly impact the transmission of microbial infections as well as affect the tempo and progression of life threatening diseases, most notably human immunodeficiency virus (HIV) infections (Friedman et al., 1997; Cohen et al., 2002; Kapadia et al., 2005; Celentano and Lucas 2007). Recently, many have theorized that genetic and proteomic tests could prove helpful in better predicting addiction behavior and interventional therapeutic successes. Indeed, the need for biomarkers reflective of drug abuse and addiction for cause, symptom and prevention is profound (Waszkiewicz et al., 2010). Thus, diagnostic measures that assess patterns of drug abuse are being sought particularly in HIV infected people where disease morbidities are significant. Even during clinical studies when patients are under observational scrutiny, co-variables cannot readily be removed. Because of such limitations in data acquisitions, researchers have turned to animal models that offer strictly controlled conditions with complex study design, disease mechanisms, and technical proteomic approaches.
Opiates are a diverse group of natural narcotics that originate from opium or its synthetic forms. They include endogenous opioid peptides; opium alkaloids, such as morphine (the prototypical opioid) and codeine; semi-synthetic opioids (heroin and oxycodone); and synthetic opioids (pethidine and methadone) (McCarthy et al., 2001). Opioids act through three major classes of opioid receptors: μ, κ and δ (Vadivelu et al., 2011). The μ receptor, also known as the morphine receptor, elicits numerous pharmacological effects. In the clinic, morphine is used for pain treatment amongst other medical conditions (Duggan and Scott 2010). Morphine as a drug of abuse is used because of eliciting euphoria. As such, it is responsible for multiple adverse effects and has been used as a model drug in multiple studies that eventually led to the formation of a morphinome database (Bodzon-Kulakowska et al., 2011).
Although many animal models have been used to study the effect of drugs of abuse and HIV infection, non-human primates infected with the simian immunodeficiency virus (SIV) have proven most reflective of human disease (Fox et al., 1997; Roberts et al., 2003; Kapadia et al., 2005). Moreover, monkeys can be quarantined while subjected to controlled infection and to single drug dosing (Kapadia et al., 2005; Donahoe et al., 2009; Riazi et al., 2009). To this end, we used proteomic untargeted profiling of plasma collected from rhesus macaques made dependent on morphine prior to and after being infected with SIV. Moreover, the work builds upon a well focused prior study demonstrating protein changes induced by viral infection (Wiederin et al., 2009). SIV infected animals were administered opiates prior to and throughout infection to gauge host responses after opiate administration (Donahoe et al., 2009). We posited that opiates would provide a unique proteomic signature as a result of its effects on cell biology. Isobaric tag for relative and absolute quantitation (iTRAQ) labeling and mass spectrometry for data acquisition were used on plasma samples to perform proteomic profiling. The experimental design ensured a complete control of individual animals as to age, route of infection, sex, time of administration and opiate concentration (Donahoe et al., 2009). Broad changes occurred in blood proteins with substantive induced animal-to-animal variance following opiate administration during SIV infection. Importantly, opiates introduced broad suppression of the plasma proteome that was associated by time of drug exposure. These data demonstrate how multi-system host responses to viral infection and opiates can affect the plasma proteome and lead to substantive variance in suppressive protein responses and its related activities. Moreover, the works support the need for thoughtful experimental designs in human studies evaluating changes in the proteome of an infected host as a consequence of drugs of abuse.
2. Experimental Procedures
2.1 Animal Cohort and Experimental Outline
Animals used in this study, their environmental conditions, and their experimental treatment are described in full detail by Donahoe et al (2009). Briefly, eight, 3-5 year old male rhesus macaques from Yerkes National Primate Research Center (YNPRC, Atlanta, GA) were acclimated to strictly controlled environmental conditions for approximately two years prior to initiation of experimental protocol. After this acclimation period, blood samples were drawn from each animal to establish a baseline prior to treatment with saline or opiates and before infection with SIVsmm9. Plasma was obtained by centrifuging whole blood collected in EDTA-containing vacutainers (BD Biosciences, Franklin Lakes, NJ). The eight monkeys then were randomly split into two groups. Five weeks post-baseline blood collection, animals were started on regular intramuscular injections of either saline (control group) or opiates diluted in saline. All monkeys were infected with SIVsmm9 at an effective dose of 10,000 TCID50 two weeks after initiation of saline and opiate injections. Blood draws were taken 1.4 weeks (acute) and 49 weeks (chronic) after infection. For the experimental timeline illustration, see Figure 1.
Figure 1. Experimental design and timeline.
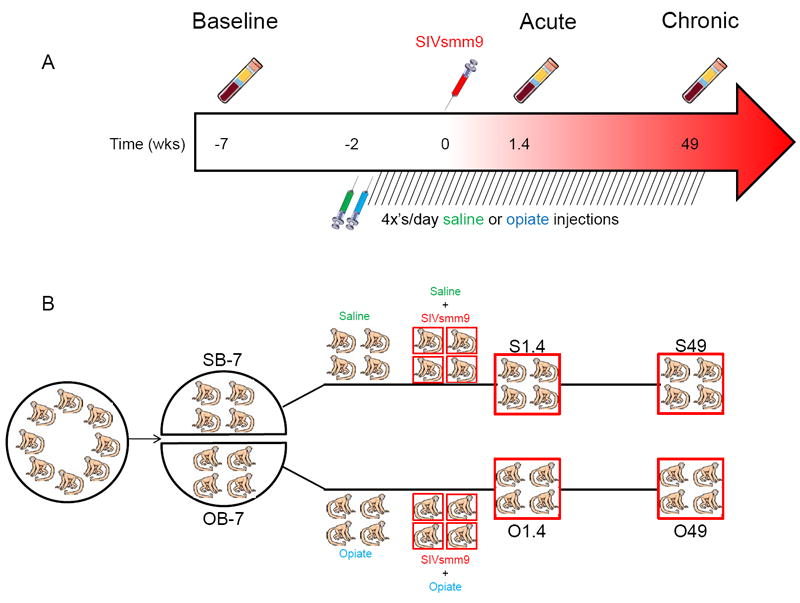
(A) Timeline of blood collections, initiation of saline/opiate injections, and infection with SIVsmm9. (B) Experimental design and division of animals into groups.
2.2 Saline/Opiate Injection and Dependency
Animals received opiate dosages on the following ramp-up schedule: 1 mg morphine/kg body weight every 6 hr (4 times a day) for 2 d; then 2 mg/kg every 6 hr for 2 d; then held at 3 mg/kg every 6 hr for 4.5 months until the dose was lowered to 2 mg/kg every 6 hr for the duration of the study. Control animals received parallel saline injections at proportional volume:weight relative to opiate injected animals. It was noted that within weeks of initiating opiates, the opiate-exposed animals eagerly presented themselves for routine injections. Opiate dependency was verified on three occasions by withholding three concurrent opiate injections. Withdrawal symptoms were recorded as grimacing, restlessness and increased vocalizations, none of which were observed in withholding saline injections from control animals.
2.3 Clinical-pathological Classifications
Monkeys were monitored daily for changes in behavioral habits and illnesses and received clinical care at the discretion of veterinarians. Monkeys were euthanized based on bioanalytical tests and/or meeting morbidity criteria as previously reported (Donahoe et al., 2009) following standard protocol at YNPRC for SIV-infected monkeys. Assessments and diagnosis of AIDS was founded on the Center for Disease Control and Prevention criteria.
2.4 Sample Preparation and Analysis Using Quantitative Proteomic Methods
All sample preparation and subsequent experimental methods are outlined in complete detail by Wiederin et al. (Wiederin et al., 2009). We present here an outline of all experimental methods. All plasma samples were treated with 0.1% Triton X-100 and 1X Protease Inhibitor (Sigma-Aldrich Corp., St. Louis, MO) to neutralize active SIV and proteases. We immunodepleted each sample using the Proteome Lab IgY-12 High Capacity Proteome Partitioning Kit (Beckman Coulter, Fullerton, CA). Flow through fractions were collected andconcentrated using VIVASPIN 15R (5000 MWC, Sartorius BioLab Products, Cole-Parmer, Vernon Hills, IL); the protein amount was determined using NanoDrop ND-1000 (Thermo Fisher Scientific, Inc., Waltham, MA). Fifty micrograms each of baseline, acute and chronic plasma samples were tryptic digested and labeled with iTRAQ, then pooled respectively for each individual animal. We followed the Applied Biosystems Reagents Protocol for 4-plex iTRAQ labeling of plasma, adapted by performing initial protein precipitation using ethanol rather than acetone in order to remove buffers and non-proteinaceous impurities that might interfere with iTRAQ labeling.
After pooling the 4 iTRAQ labeled samples for each individual animal (baseline, acute, chronic and pooled control), all samples were cleaned up using Waters Oasis MCX cartridge (Waters Corp., Milford, MA), a process that improved the quality of the subsequent strong cation exchange (SCX) method. Due to the complexity of plasma, all pooled iTRAQ samples were fractionated using a SCX PolySULFOETHYL A column (100 × 2.1mm, 5 μm, 3 Å, PolyLC, Columbia, MD). Samples were fractionated using HPLC and a continuous salt gradient of 10-500 mM of KCl over 80 min; fractions were collected every 3 min. We performed C18 RP-HPLC (Jupiter 4u Proteo 90A, 50 × 4.6 mm, 4 μm, Phenomenex, Torrence, CA) on each SCX fraction to remove any salts prior to MS-MS analysis. Each desalted SCX fraction was further fractionated using the Tempo LC MALDI spotting system with a C18 reversed phase capillary column (AB Sciex, Foster City, CA) followed by data acquisition on 4800 MALDI TOF/TOF (AB Sciex) (Akkina et al., 2009).
2.5 Database searches
TOF MS and MS/MS spectra were analyzed using Protein Pilot v.2.0.1 software which utilizes the Paragon scoring algorithm (Shilov et al., 2007). Search parameters included: iTRAQ 4plex (peptide labeled) sample type, iodoacetemide cys alkylation, trypsin digest, biological modifications ID focus and thorough search effort. Mass tolerance for precursor and fragment ions, number of missed cleavages, and justification of threshold scores for accepting individual spectra are all built in as set values by Protein Pilot v.2.0.1 software. A catalog of modifications provided by ABSciex and used by Protein Pilot v.2.0.1 software is included as supplementary text1. The detected protein threshold selected as unused ProtScore equal to 0.47 with 66% confidence cut-off value based on recommendations from personal communications (LeeAnn Higgins, University of Minnesota, MN). The protein FASTA database used for searches was a concatenated “target-decoy” version of Macaca subset of the NCBI Ref Sequence (http://www.ncbi.nlm.nih.gov/RefSeq/) database (March, 2009; 44,047 protein entries) to which 110 ‘contaminant’ proteins were added (source: http://www.thegpm.org/crap/index.html). A total of 76,252 protein sequences comprised the target-decoy database.
2.6 Western Blot Analyses
Western blot assays were performed in triplicate as previously described (Wiederin et al., 2009). Primary antibodies used for validation were: mouse anti-gelsolin monoclonal (mAb) (BD Transduction Laboratories, San Jose, CA), rabbit anti-vitronectin polyclonal (pAb) (Santa Cruz Biotechnology, Inc., Santa Cruz, CA), and mouse anti-ceruloplasmin mAb (BD Transduction Laboratories). Following incubation with the primary antibody, the membrane was incubated with the appropriate horseradish peroxidase conjugated goat anti-mouse (Jackson ImmunoResearch, West Grove, PA) or goat anti-rabbit (Jackson ImmunoResearch) secondary antibodies. All Western blots were performed in triplicate and densitometry measurements performed using ImageJ freeware available through NIH.
2.7 Statistical Methods: iTRAQ Analysis
Statistical analyses of iTRAQ ratios of proteins from monkeys exposed to opiates during SIV infection were performed as previously reported for monkeys infected with SIV without opiate exposure (Wiederin et al., 2009). The relative protein abundance comparing different experimental conditions was estimated, and the proteins with differential expression between different experimental conditions were identified.
2.8 Statistical Methods: Variance Analyses
The variance analyses were performed on the normalized data as analyzed by the iTRAQ analysis in Part I. Two subsets of the normalized data were analyzed: (I) A large data set (Data Set I) containing all 114 proteins with at least three records under each experimental condition for variance evaluation; and (II) A subset of the large data set containing 62 proteins (Data Set II) with differential expression between the saline samples and the opiate samples at some experimental time point. First, the variance of the normalized protein/peptide abundance measurements on each protein was compared between the opiate and saline group at each time point [i.e., Baseline (B-7), Acute (1.4), Chronic (49)] via Levene’s test. Then the standard deviation of the abundances’ measurements under each of the two treatment conditions [i.e., Saline (S) or Opiate (O)], at different time points was calculated on each protein to measure the variation of the protein under the corresponding group. The difference in the standard deviation from the same protein was calculated between OB-7 and SB-7, between O1.4 and S1.4, as well as between O49 and S49. Nonparametric methods (ranked sum test) were used to check whether the difference in the standard deviations were equal to zero across all proteins at baseline, acute or chronic time points. A p-value of less than 0.05 was considered to be significant.
3. Results
In our previous study (Wiederin et al., 2009), changes in the plasma proteomes of SIV-infected rhesus were described. We selected three time points for study measured in weeks: baseline (-7), acute (1.4) and chronic (49 wks) after infection was initiated. The current study followed this design; however, in addition to SIV infection, we introduced an additional condition of morphine administration. Our goal was to observe whether the addition of opiates, administered in a very well controlled manner by intramuscular injections, could influence disease outcome; and, if so, how this is reflected by changes in the proteome profile. We applied exactly the same methodology of iTRAQ quantitation using MALDI-TOF/TOF mass spectrometry to avoid variance originating from technical and instrumental differences. The same person performed sample preparation at the same time; the mass spectrometry analyses were performed by the same facility and personnel. This was pursued in order to gain insight as to why monkeys that received continuous opiate doses showed longer survival rates after SIV infection (Donahoe et al., 2009). Detailed experimental design and timeline for blood collections, initiation of opiate injections, and SIV infection are presented in Figure 1.
3.1 Clinical-Pathological Classifications
An in-depth summary of clinical-pathological classifications of monkeys has been described in a previous paper (Donahoe et al., 2009). For the current study, we selected clinical parameters that are most commonly used to evaluate progression of HIV infection in patients: white blood cell counts, lymphocyte counts, viral counts, and CD4+CD25+ T-cell numbers (Table 1). Although these clinical parameters vary in a broad range similar to humans infected with HIV, it is noticeable that monkeys RKE4 and RPD4, which survived more than 50 weeks, had a lower viral load on week 49 indicating better control of infection by their immune system and survived the total study period without the development of AIDS, as opposed to the other two opiate-treated monkeys or the four saline-treated monkeys. It is important to note that the plasma viral loads of the saline treated monkeys versus opiate-treated monkeys are not significantly different at either 1.4 weeks (p=0.672) or 49 weeks (p=0.528).
Table 1.
Summary of selected clinical parameters of monkeys included in this study
| Treatment | Animal Id* | Time point (wk) | White blood cells/ mm3 | Lymphocyte/ mm3 | Viral count (log10 mRNA/mL) | CD4+CD25+ Tcells/mm3 | CoD_ AIDS† | Survival (mpi)** | Histopath |
|---|---|---|---|---|---|---|---|---|---|
| Saline | RIW3 | -7 | 7500 | 2550 | 205 | 1 | 27 | AIDS Category C | |
| 1.4 | 3900 | 2106 | 8.380 | 178 | |||||
| 49 | 9400 | 3572 | 5.658 | 111 | |||||
| RMH4 | -7 | 5600 | 1680 | 126 | 1 | 39 | AIDS Category A3 | ||
| 1.4 | 3500 | 875 | 7.496 | 56 | |||||
| 49 | 3300 | 1584 | 2.699 | 88 | |||||
| RRR3 | -7 | 5100 | 2193 | 136 | 1 | 23 | AIDS Category C | ||
| 1.4 | 3600 | 936 | 7.453 | 60 | |||||
| 49 | 5100 | 1530 | 7.306 | 25 | |||||
| RQN4 | -7 | 6800 | 1904 | 121 | 1 | 24 | AIDS Category A3 | ||
| 1.4 | 3000 | 1080 | 7.753 | 60 | |||||
| 49 | 6100 | 1525 | 4.620 | 35 | |||||
| Opiate | RKE4 | -7 | 6700 | 1943 | 86 | 0‡ | >50 | ||
| 1.4 | 3100 | 1674 | 7.714 | 50 | |||||
| 49 | 6000 | 1980 | 3.025 | 66 | |||||
| RPP3 | -7 | 8100 | 2025 | 120 | 1 | 40 | AIDS Category A3 | ||
| 1.4 | 5500 | 1925 | 8.000 | 89 | |||||
| 49 | 8600 | 3440 | 6.012 | 96 | |||||
| RPD4 | -7 | 9900 | 3762 | 141 | 0‡ | >50 | |||
| 1.4 | 5000 | 4000 | 7.107 | 204 | |||||
| 49 | 4200 | 1932 | 2.699 | 315 | |||||
| RDE4 | -7 | 7600 | 3496 | 134 | 1 | 23 | AIDS Category C | ||
| 1.4 | 5200 | 1040 | 7.751 | 31 | |||||
| 49 | 6300 | 2835 | 5.166 | 86 |
Alpha-numerical id refers to nomenclature in Donahoe et al (Donahoe et al., 2009)
Cause of death due to AIDS. 1=yes; 0=no
mpi is the number of months after inoculation with SIVsmm9
These animals survived the initial 216 week study
3.2 iTRAQ quantitation
Spectra acquired from TOF-MS and TOF/TOF-MS were analyzed using Protein Pilot v.2.0.1, which uses the Paragon Scoring Algorithm (Shilov et al., 2007) and exported to spreadsheet for further analysis. Protein Pilot provides a list of all identified isoforms and selects which isoform is quantified. All raw Protein Pilot data are included in Supplemental Table 12. In the subsequent step of statistical data analyses, the distributions of the normalized (log) abundance measures for each protein were compared using the Wilcoxon rank-sum test, with the false discovery rate of 5% (Storey and Tibshirani 2003). The relative protein abundance comparing experimental condition(j) to experimental condition(i) (where “j” and “i” represent any two experimental conditions to be compared) was estimated from normalized log(abundance) as: exp (mean{log(abundance)j} - mean{log(abundance)i}). Statistical analyses showed that levels of 72 proteins were differentially expressed during SIV infection with opiate exposure. Supplemental Table 22 summarizes an abbreviated list of 30 proteins that were differentially regulated during SIV infection alone as previously reported (Wiederin et al., 2009) and with opiate treatment. Supplemental Table 32 summarizes the proteins that were differentially regulated in monkeys with opiate exposure during SIV infection, but not during SIV infection alone.
3.3 Validation
As in our previous studies, we used quantitative Western blot to validate differentially regulated proteins (Rozek et al., 2008; Wiederin et al., 2009; Wiederin et al., 2010). We initially selected three proteins for validation: gelsolin, vitronectin and ceruloplasmin that were differentially expressed and successfully validated in our previous monkey study of experimental SIV infection (Figure 2 A, C) as well as identified in our current study of the effects of opiate administration on SIV infection (Figure 2 B, D). These three proteins were also found to be differentially expressed in our previous proteomic profiling studies of serum and CSF of HIV infected patients. While performing quantitative Western blot for orthogonal validation, we consistently observed that the standard errors in plasma protein level determination seen in monkeys exposed to opiates during SIV infection were larger than those during SIV infection alone (Figure 2 C, D). We then looked at protein expression for each individual monkey and noticed varying trends for opiate treated SIV infected monkeys as compared to SIV infection in the saline controls. We concluded that these differing experimental conditions led to increased variance as reflected in large standard errors (Figure 2 E, F). It is important to note that this increased variance is not correlated to monkeys with low or high viral set points (LVSP or HVSP, respectively) as previously defined (Donahoe et al., 2009). Western blot assays provided validation of 2/3 proteins (gelsolin and ceruloplasmin), supporting the overall data as shown in Supplemental Table 23 that levels of many of the proteins found to be increased by SIV infection in our prior study were decreased in the presence of opiates. For example, when compared to the levels found in the same animals at baseline, ceruloplasmin increased by over 40% in SIV infected monkeys treated with saline at both the acute and chronic time points, but decreased by over 40% in the SIV infected monkeys given opiates at these same time points. However, statistical evaluations of differences were less than those for SIV infection alone leading us to further analyze sources of protein variance and variances over time.
Figure 2. iTRAQ Ratios and Western blot Validation.
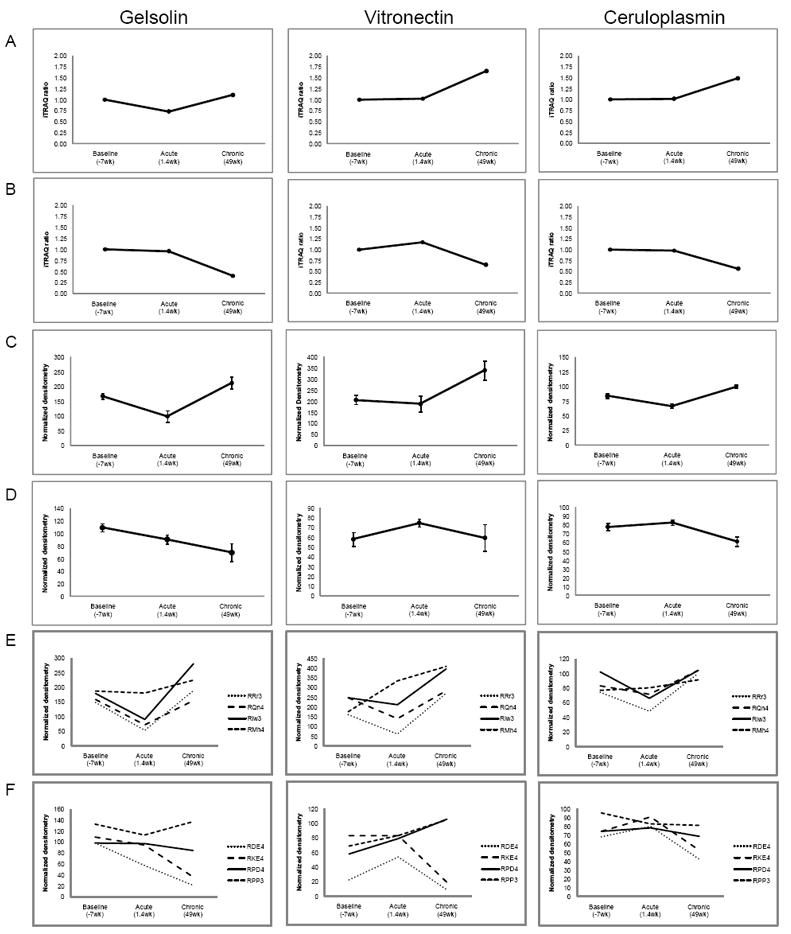
(A) iTRAQ ratios for selected proteins from monkeys infected with SIV only. (B) iTRAQ ratios for selected proteins from opiate treated monkeys infected with SIV. (C) Densitometry measurements for selected proteins from monkeys infected with SIV. (D) Densitometry measurements for selected proteins from opiate treated monkeys infected with SIV. (E) Averages of densitometry measurements performed in triplicate for each monkey infected with SIV. (F) Averages of densitometry measurements performed in triplicate for each opiate treated monkeys infected with SIV. Viral set points for each monkey are: RDE4 (HVSP), RKE4 (LVSP), RPD4 (LVSP), RPP3 (HVSP). HVSP = high viral set point; LVSP = low viral set point.
3.4 Source of Variance
Levene’s test was first used to evaluate whether different variance exist between different experimental conditions on individual proteins, as determined in the iTRAQ analysis. Table 2 summarizes the percentage of proteins showing different variances between saline and opiate at each time point based on the analysis of both datasets. Under both Data Set I (114 proteins present in at least three samples) and II (62 proteins differentially expressed at some experimental time point between morphine treated SIV infected animals and SIV infected animals administered saline), less than 14% of the proteins were found to have different variances between the saline and opiate group at the baseline and acute time point. The percentage was found to increase to 50% at the chronic time point for Data Set I and 71% for Data Set II.
Table 2.
The percentage of proteins with different variability in the protein abundances between monkeys infected with SIV only and opiate treated monkeys infected with SIV at baseline, acute or chronic time points.
| Baseline (-7 wks) | Acute (1.4 wks) | Chronic (49 wks) | |
|---|---|---|---|
| Data Set I (114 proteins) | 11.4% | 13.2% | 50.0% |
| Data Set II (62 proteins) | 9.7% | 11.3% | 71.0% |
To identify the source of the heterogeneous variances between the saline and opiate groups, the standard deviation of the protein/peptide abundance measurements were calculated on each protein under each experimental condition. Then, the differences in the standard deviation values from different experimental conditions of the same protein were calculated. Figure 3 contains four sets of boxplots describing the distribution of these differences in the standard deviation across all proteins. In Figure 3A for Data Set I, the median value of the difference in standard deviation stays above zero and increases from baseline to acute and from acute to chronic. At the chronic time point, the median difference is around 0.25 and the box (the middle 50% of the data) is above zero. Significant differences were detected at acute (p=0.0005) and chronic time points (p<0.0001) by the signed rank test. A similar pattern was observed in Figure 3B for Data Set II with significant differences detected at acute (p=0.0001) and chronic time point (p<0.0001).
Figure 3. Comparison of Variability: Distribution of Differences in Standard Deviations.
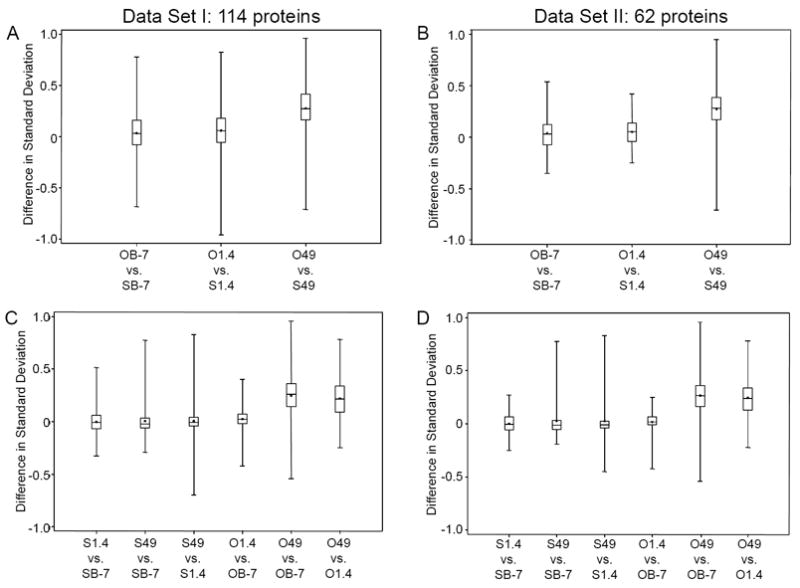
The distance each box is located from 0 is an indication of strength of significance. (A) Difference in standard deviation when comparing opiate treated monkeys versus saline treated monkeys at 3 different time points using Data Set I (114 proteins). (B) Difference in standard deviation when comparing opiate treated monkeys versus saline treated monkeys at three different time points using Data Set II (62 proteins). (C) Comparison of the standard deviation of abundances observed at different time points of the same treatment condition for Data Set I. (D) Comparison of the standard deviation of abundances observed at different time points of the same treatment condition for Data Set II.
Figure 3C and 3D display boxplots for Data Sets I and II, respectively, to compare the standard deviation of abundances observed at different time points of the same treatment condition. In both Figure 3C and 3D, the boxplots for animals administered opiates are located further away from the zero line, demonstrating that changes in their plasma proteome are more significant than those that did not receive drug. The most significant changes were observed when comparing the opiate group at chronic administration to the opiate baseline (O49 vs. OB-7). All these findings were supported by the signed rank test showing that the standard deviation keeps increasing from baseline to acute to chronic under the opiate group (p<0.0001) for both data. We also noted that the signed rank test indicates in the saline monkeys that the standard deviation is significantly different when comparing baseline to chronic (p=0.024) for Data Set I, but not for Data Set II (p=0.3832). Our data and results imply that significantly different variances were observed over time in the opiate samples and that these variances are larger with longer duration of opiate treatment.
4. Discussion and Conclusions
The proteomic profilings developed from plasma samples of opiate-administered SIV-infected rhesus macaques demonstrate broad suppressive biological responses. Such responses were not observed in our prior study in which monkeys were only infected with SIV (Wiederin et al., 2010). We posit that this is secondary to broad host homeostatic responses elicited by drug. Indeed, support for this conclusion rests in prior clinical and pathological evaluations of the animals studied. The in vivo monkey study strongly suggested that opiates can confer protection against the ravages of chronic viral infection in select susceptible animals under these well-defined clinical circumstances (Donahoe et al., 2009). This stands in contrast to the common notion that the health of HIV infected individuals deteriorates more rapidly when using drug of abuse. (Cherner et al., 2005; Chana et al., 2006; Huff 2006) However, opiate responses may not be uniform. In working to formulate a role of opiates in HIV-SIV/AIDS, the plasma samples from the prior study, due to its controlled conditions, proved most attractive for proteomic investigations. We found experimental conditions in this study as optimal; however, in reality, drug abusers do not have guaranteed access to drugs on a regular schedule and commonly have concurrent infections such HCV and/or malnutrition. We can readily parallel experimental conditions among animals and animal groups relative to housing, food, medical care and other issues that affect disease and health. Interestingly, what was observed showed far greater biological variances than the technology and methodologies combined. It is nevertheless likely that specific signatures for global protein suppression that were found through proteomic profiling are relevant for opiate use. Yet, the source of biological variances still awaits further definition.
We posit that any success realized from proteomic based biomarker discovery utilizing human samples must be carefully designed to acquire meaningful data and to limit effects of co-morbid factors. An important need is the assembly of clinically well-characterized patient groups. In a strictly controlled experiment, such as one using monkeys, four to eight animals can usually generate statistically significant data (Paweletz et al., 2010). Nonetheless, if other factors are introduced during execution of the experiment, it can lead to variable outcomes as was seen in the current report. We have calculated that the required number of subjects for the current study would be 54 animals (9 animals per group) to obtain a power of 91% to detect the differential protein expression due to different drug treatments (morphine compared to saline) to detect the changes among different time points (baseline as compared to acute or chronic) via two-way analysis of variance. It is likely that similar studies performed with human clinical material will require even larger numbers of subjects. It is now well accepted that quantitative proteomic studies need to be performed using higher number of un-pooled samples to support statistical analysis; however, the exact minimal number of subjects remains unclear (Levin et al., 2009). In many instances of clinical translational studies, it will be very difficult to achieve this goal as costs of such proteomic profiling will be significantly increased. To tackle this, we envision an experimental approach that will consist of two steps. First is to perform the experiment in an animal model under controlled conditions, and second is to design a proteomic experiment using human material that targets specific protein groups in a defined clinical settings. Statistical analyses applied to such an approach w previously published (Oberg and Vitek 2009; Cairns 2011).
Taken together, results of this study provide an explanation as to why, despite convincing quantitative measures seen during biomarker discovery, protein candidates often fail during subsequent validation phase. We posit that in chronic conditions, biological but not technical variance is a major obstacle in biomarker discoveries. Although by using a well-controlled animal model and reduced technical variability as much as possible at this time, we still observe variable changes in the plasma proteome as a consequence of co-morbid pathologic and exogenous conditions and differences in genetic background. We envision that to overcome such a hurdle better correlates need to be made in improving experimental models, in system biologic statistical and computational approaches and in using better defined and more relevant clinical endpoints.
Supplementary Material
Footnotes
Supplementary material can be found by accessing the online version of this paper at http://dx.doi.org and by entering doi:…
Supplementary text can be viewed by accessing the online version of this article at http://dx.doi.org and by entering doi:…
Supplementary tables can be viewed by accessing the online version of this article at http://dx.doi.org and by entering doi:…
Supplementary tables can be viewed by accessing the online version of this article at http://dx.doi.org and by entering doi:…
Publisher's Disclaimer: This is a PDF file of an unedited manuscript that has been accepted for publication. As a service to our customers we are providing this early version of the manuscript. The manuscript will undergo copyediting, typesetting, and review of the resulting proof before it is published in its final citable form. Please note that during the production process errors may be discovered which could affect the content, and all legal disclaimers that apply to the journal pertain.
References
- Akkina SK, Zhang Y, Nelsestuen GL, Oetting WS, Ibrahlm HN. Temporal stability of the urinary proteome after kidney transplant: more sensitive than protein composition? J Proteome Res. 2009;8:94–103. doi: 10.1021/pr800646j. [DOI] [PMC free article] [PubMed] [Google Scholar]
- Bodzon-Kulakowska A, Kulakowski K, Drabik A, Moszczynski A, Silberring J, Suder P. Morphinome--a meta-analysis applied to proteomics studies in morphine dependence. Proteomics. 2011;11:5–21. doi: 10.1002/pmic.200900848. [DOI] [PubMed] [Google Scholar]
- Bruchas MR, Land BB, Chavkin C. The dynorphin/kappa opioid system as a modulator of stress-induced and pro-addictive behaviors. Brain Res. 2010;1314:44–55. doi: 10.1016/j.brainres.2009.08.062. [DOI] [PMC free article] [PubMed] [Google Scholar]
- Cairns DA. Statistical issues in quality control of proteomic analyses: good experimental design and planning. Proteomics. 2011;11:1037–1048. doi: 10.1002/pmic.201000579. [DOI] [PubMed] [Google Scholar]
- Celentano DD, Lucas G. Optimizing treatment outcomes in HIV-infected patients with substance abuse issues. Clin Infect Dis. 2007;45(Suppl. 4):S318–323. doi: 10.1086/522557. [DOI] [PubMed] [Google Scholar]
- Chana G, Everall IP, Crews L, Langford D, Adame A, Grant I, Cherner M, Lazzaretto D, Heaton R, Ellis R, Masliah E. Cognitive deficits and degeneration of interneurons in HIV+ methamphetamine users. Neurology. 2006;67:1486–1489. doi: 10.1212/01.wnl.0000240066.02404.e6. [DOI] [PubMed] [Google Scholar]
- Cherner M, Letendre S, Heaton RK, Durelle J, Marquie-Beck J, Gragg B, Grant I. Hepatitis C augments cognitive deficits associated with HIV infection and methamphetamine. Neurology. 2005;64:1343–1347. doi: 10.1212/01.WNL.0000158328.26897.0D. [DOI] [PubMed] [Google Scholar]
- Cohen MH, French AL, Benning L, Kovacs A, Anastos K, Young M, Minkoff H, Hessol NA. Causes of death among women with human immunodeficiency virus infection in the era of combination antiretroviral therapy. Am J Med. 2002;113:91–98. doi: 10.1016/s0002-9343(02)01169-5. [DOI] [PMC free article] [PubMed] [Google Scholar]
- Donahoe RM, O’Neil SP, Marsteller FA, Novembre FJ, Anderson DC, Lankford-Turner P, McClure HH. Probable deceleration of progression of Simian AIDS affected by opiate dependency: studies with a rhesus macaque/SIVsmm9 model. J Acquir Immune Defic Syndr. 2009;50:241–249. doi: 10.1097/QAI.0b013e3181967354. [DOI] [PubMed] [Google Scholar]
- Duggan ST, Scott LJ. Morphine/naltrexone. CNS Drugs. 2010;24:527–538. doi: 10.2165/11204620-000000000-00000. [DOI] [PubMed] [Google Scholar]
- Fernandez-Serrano MJ, Lozano O, Perez-Garcia M, Verdejo-Garcia A. Impact of severity of drug use on discrete emotions recognition in polysubstance abusers. Drug Alcohol Depend. 2010;109:57–64. doi: 10.1016/j.drugalcdep.2009.12.007. [DOI] [PubMed] [Google Scholar]
- Fox HS, Gold LH, Henriksen SJ, Bloom FE. Simian immunodeficiency virus: a model for neuroAIDS. Neurobiol Dis. 1997;4:265–274. doi: 10.1006/nbdi.1997.0159. [DOI] [PubMed] [Google Scholar]
- Friedman SR, Curtis R, Jose B, Neaigus A, Zenilman J, Culpepper-Morgan J, Borg L, Kreek J, Paone D, Des Jarlais DC. Sex, drugs, and infections among youth. Parenterally and sexually transmitted diseases in a high-risk neighborhood. Sex Transm Dis. 1997;24:322–326. doi: 10.1097/00007435-199707000-00003. [DOI] [PubMed] [Google Scholar]
- Huff B. Methamphetamine and HIV. Beta. 2006;18:42–47. [PubMed] [Google Scholar]
- Kapadia F, Vlahov D, Donahoe RM, Friedland G. The role of substance abuse in HIV disease progression: reconciling differences from laboratory and epidemiologic investigations. Clin Infect Dis. 2005;41:1027–1034. doi: 10.1086/433175. [DOI] [PubMed] [Google Scholar]
- Levin Y, Wang L, Ingudomnukul E, Schwarz E, Baron-Cohen S, Palotas A, Bahn S. Real-time evaluation of experimental variation in large-scale LC-MS/MS-based quantitative proteomics of complex samples. J Chromatogr B Analyt Technol Biomed Life Sci. 2009;877:1299–1305. doi: 10.1016/j.jchromb.2008.11.007. [DOI] [PubMed] [Google Scholar]
- McCarthy L, Wetzel M, Sliker JK, Eisenstein TK, Rogers TJ. Opioids, opioid receptors, and the immune response. Drug Alcohol Depend. 2001;62:111–123. doi: 10.1016/s0376-8716(00)00181-2. [DOI] [PubMed] [Google Scholar]
- Oberg AL, Vitek O. Statistical design of quantitative mass spectrometry-based proteomic experiments. J Proteome Res. 2009;8:2144–2156. doi: 10.1021/pr8010099. [DOI] [PubMed] [Google Scholar]
- Paweletz CP, Wiener MC, Bondarenko AY, Yates NA, Song Q, Liaw A, Lee AY, Hunt BT, Henle ES, Meng F, Sleph HF, Holahan M, Sankaranarayanan S, Simon AJ, Settlage RE, Sachs JR, Shearman M, Sachs AB, Cook JJ, Hendrickson RC. Application of an end-to-end biomarker discovery platform to identify target engagement markers in cerebrospinal fluid by high resolution differential mass spectrometry. J Proteome Res. 2010;9:1392–1401. doi: 10.1021/pr900925d. [DOI] [PubMed] [Google Scholar]
- Pirard S, Sharon E, Kang SK, Angarita GA, Gastfriend DR. Prevalence of physical and sexual abuse among substance abuse patients and impact on treatment outcomes. Drug Alcohol Depend. 2005;78:57–64. doi: 10.1016/j.drugalcdep.2004.09.005. [DOI] [PubMed] [Google Scholar]
- Riazi M, Marcario JK, Samson FK, Kenjale H, Adany I, Staggs V, Ledford E, Marquis J, Narayan O, Cheney PD. Rhesus macaque model of chronic opiate dependence and neuro-AIDS: longitudinal assessment of auditory brainstem responses and visual evoked potentials. J Neuroimmune Pharmacol. 2009;4:260–275. doi: 10.1007/s11481-009-9149-3. [DOI] [PMC free article] [PubMed] [Google Scholar]
- Roberts ES, Zandonatti MA, Watry DD, Madden LJ, Henriksen SJ, Taffe MA, Fox HS. Induction of pathogenic sets of genes in macrophages and neurons in NeuroAIDS. Am J Pathol. 2003;162:2041–2057. doi: 10.1016/S0002-9440(10)64336-2. [DOI] [PMC free article] [PubMed] [Google Scholar]
- Rozek W, Horning J, Anderson J, Ciborowski P. Sera proteomic biomarker profiling in HIV-1 infected subjects with cognitive impairment. Proteomics Clin App. 2008;2:1498–1507. doi: 10.1002/prca.200780114. [DOI] [PMC free article] [PubMed] [Google Scholar]
- Shilov IV, Seymour SL, Patel AA, Loboda A, Tang WH, Keating SP, Hunter CL, Nuwaysir LM, Schaeffer DA. The Paragon Algorithm, a next generation search engine that uses sequence temperature values and feature probabilities to identify peptides from tandem mass spectra. Mol Cell Proteomics. 2007;6:1638–1655. doi: 10.1074/mcp.T600050-MCP200. [DOI] [PubMed] [Google Scholar]
- Storey JD, Tibshirani R. Statistical significance for genomewide studies. Proc Natl Acad Sci USA. 2003;100:9440–9445. doi: 10.1073/pnas.1530509100. [DOI] [PMC free article] [PubMed] [Google Scholar]
- Vadivelu N, Mitra S, Hines RL. Peripheral opioid receptor agonists for analgesia: a comprehensive review. J Opioid Manag. 2011;7:55–68. doi: 10.5055/jom.2011.0049. [DOI] [PubMed] [Google Scholar]
- Waszkiewicz N, Konarzewska B, Waszkiewicz M, Poplawska R, Szajda SD, Zalewska A, Markowski T, Szulc A. Biomarkers of alcohol abuse. Part I. Traditional biomarkers and their interpretation. Psychiatr Pol. 2010;44:127–136. [PubMed] [Google Scholar]
- Wiederin J, Rozek W, Duan F, Ciborowski P. Biomarkers of HIV-1 associated dementia: proteomic investigation of sera. Proteome Sci. 2009;7:8–20. doi: 10.1186/1477-5956-7-8. [DOI] [PMC free article] [PubMed] [Google Scholar]
- Wiederin JL, Donahoe RM, Anderson JR, Yu F, Fox HS, Gendelman HE, Ciborowski PS. Plasma proteomic analysis of simian immunodeficiency virus infection of rhesus macaques. J Proteome Res. 2010;9:4721–4731. doi: 10.1021/pr1004345. [DOI] [PMC free article] [PubMed] [Google Scholar]
Associated Data
This section collects any data citations, data availability statements, or supplementary materials included in this article.