Abstract
While Fourier-Bessel methods gave rise to the first three-dimensional reconstruction of an object from electron microscopic images, and these methods have dominated three-dimensional reconstruction of helical filaments and tubes for thirty years, single-particle approaches to helical reconstruction have emerged within the past ten years that are now the main method being used. The Iterative Helical Real Space Reconstruction (IHRSR) approach has been the main methodology, and it surmounts many of the problems posed by real polymers that are flexible, display less than crystalline order, or are weakly scattering. The main difficulty in applying this method, or even Fourier-Bessel methods, is in determining the approximate helical symmetry. This chapter focuses on some of the intrinsic ambiguities that are present when trying to determine the helical symmetry from power spectra of images, and argues that complementary techniques or some form of prior knowledge about the subunit may be needed to have confidence in the solution that is found.
Much of the protein in bacterial, archaeal and eukaryotic cells exists in the form of helical polymers. Rather than being the result of some (either moronic or intelligent) design (Egelman, 2010), the abundance of helices arises from the fact that helical polymers are the consequence of the simplest bonding rule that can be created between any two copies of an asymmetric unit, such as a protein (Egelman, 2003). In general, such a bonding rule can be repeated many times to generate a helical lattice. Large numbers of helical polymers, from F-actin (Moore et al., 1970) to tubes containing the dynamin molecule (Chen et al., 2004) have been studied by electron microscopy, reflecting the central role of such structures in all aspects of cell and molecular biology. But helical polymers have also been ideal objects for electron microscopic study and three-dimensional reconstruction. In many cases, a single image of a helical polymer provides all of the views necessary to generate a three-dimensional reconstruction. This is because a single asymmetric unit is repeated many times in a helical polymer, with each copy of this asymmetric unit providing a different projection due to a different orientation. The apparent simplicity of helical reconstruction is why the first three-dimensional reconstruction from electron microscopic images was of a helical polymer (DeRosier and Klug, 1968).
Because of the utility of helical arrays, and the elimination of the need to obtain tilts when working with two-dimensional crystals, some effort has actually been placed in forming synthetic helical tubes as a means to reconstruct a protein or complex (Dang et al., 2005;Toyoshima and Unwin, 1990;Zhang et al., 1998). On the other hand, some viral capsid proteins have been observed to form helical tubes (or polyheads), rather than closed shells, under the appropriate conditions (Li et al., 2000;Steven et al., 1976). Most other helical assemblies that have been studied (and there are many!) occur naturally. I will not distinguish in this chapter between artificially created helical tubes and naturally occurring helical filaments, as the methods and problems are quite similar.
For more than 30 years after DeRosier and Klug (1968) almost all helical reconstructions involved the Fourier-Bessel formalism (Klug et al., 1958). In this approach, the Fourier transform of a helical object is described in terms of Bessel functions. Since a helical polymer has axial periodicity, the three-dimensional Fourier transform is non-zero only on layer planes. The images recorded in an electron microscope correspond (ideally) to the projection of a three-dimensional density distribution onto a two-dimensional image, and the Fourier transform of the projected image is the central section of the three-dimensional Fourier transform (Penczek, MiE, this volume). Layer planes are thus intersected by the central section to become the layer lines seen in a two-dimensional Fourier transform. On each layer line, the amplitudes can be described very simply by a Bessel function whose argument involves the radius of a point scatterer giving rise to the diffraction. Since any atomic density can be thought of as a sum of many point-like atoms, the sum of all of these Bessel terms generates the observed amplitudes. To reconstruct in three-dimensions, one must simply “index” the diffraction pattern in terms of assigning an order n to each Bessel function, and then do a Fourier-Bessel inversion. There are a number of excellent reviews that discuss the Fourier-Bessel approach in some depth (Stewart, 1988).
Over the past 10 years, however, it has become apparent that single-particle type approaches to helical reconstruction offer many advantages (Egelman, 2000;Egelman, 2007a;Egelman, 2007b;Sachse et al., 2007;Sachse et al., 2008). In the limit of nearly crystalline helical structures (Yonekura et al., 2003) one may do as well with Fourier-Bessel methods as with the single-particle type approach, but such highly ordered samples are quite rare. One of the most highly ordered helical polymers, Tobacco Mosaic Virus, has now been solved by a single particle approach at better than 5 Å resolution (Sachse et al., 2007), so even in this rare limit there appear to be few reasons to use the Fourier-Bessel method. The advantages of the single-particle approach are many, and include: 1) elimination of the problem of Bessel overlap when the symmetry generates more than one Bessel function on a layer line (Crowther et al., 1985;Woodhead et al., 2005); 2) elimination of the need to computationally straighten images of flexible filaments (Egelman, 1986); 3) ability to solve weakly diffracting filaments, where Fourier transforms from individual filaments do not show the layer lines needed for Fourier-Bessel approaches (Craig et al., 2006;Fujii et al., 2009); and 4) ability to deal with variability in structure (Egelman et al., 1982), a property of most helical filaments, where long-range order is not maintained. In addition, because the method is based upon using large data sets in a single-particle approach (Frank et al., 1981), many different strategies may be employed for sorting and classification to achieve more homogeneous subsets of images.
The Iterative Helical Real Space Reconstruction (IHRSR) approach
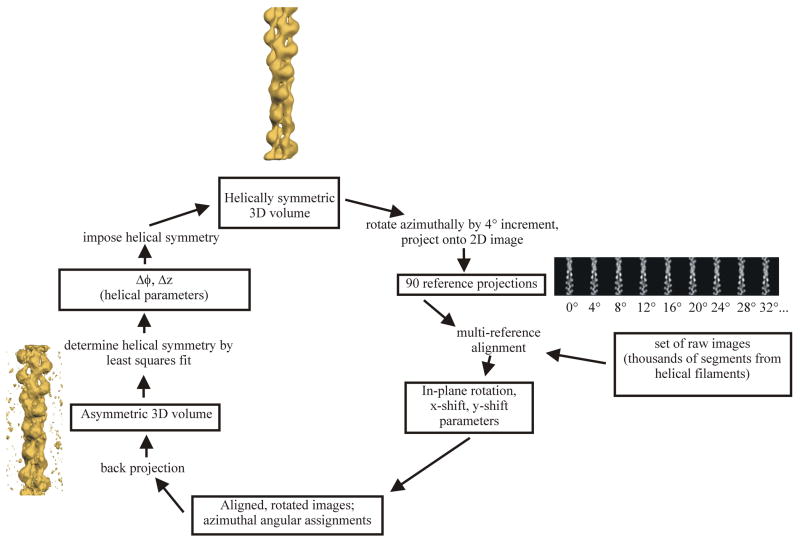
A general method for reconstructing helical polymers (Egelman, 2000) was proposed that involves an iterative determination and imposition of helical symmetry upon objects that have been reconstructed without any helical symmetry imposed. The method works very well, has been applied extensively (in more than 100 publications), and surmounts many of the problems mentioned above that are inherent in Fourier-Bessel approaches. As discussed below, however, the method does not eliminate the need to understand helical symmetry and helical diffraction. A schematic diagram (Fig. 1) shows the IHRSR cycle. A reference volume (top) is used to generate reference projections, where each involves a different azimuthal rotation of the reference volume. The actual angular increment between projections depends upon the diameter of the object (D) and the expected resolution (d), and should be 360o*d/(2πD). The number of reference projections is therefore simply 2πD/d. In the case of a point group symmetry (Cn) in addition to the helical screw symmetry, the number of reference projections is reduced to 2πD/nd. The reference projections are cross-correlated against the thousands or tens of thousands of actual image segments. The highest correlation yields the azimuthal orientation of the image in question, as well as the in-plane rotation and translation needed to bring it into register with the reference projection. The aligned images are then used in a back-projection algorithm to generate a three-dimensional reconstruction (Fig. 1, lower left corner). This volume is searched for the helical screw operator (the coupled rotation and axial translation) that minimizes the variance between the actual volume and a symmetrized version of the volume. This screw operator is then imposed on the reconstruction to generate a helically symmetric volume used as a new reference (Fig. 1, top) for the next cycle of the procedure.
Figure 1.
The IHRSR cycle, reproduced from (Egelman, 2007b). A reference volume (top) is used to generate 90 reference projections, where each involves a 4° azimuthal rotation of the reference volume. The actual angular increment (4° in this example) depends upon the diameter of the object (D) and the expected resolution (d). The reference projections (90 in this case) are cross-correlated against the actual image segments. The highest correlation determines the azimuthal orientation of the image in question, as well as providing the in-plane rotation and translation needed to bring it into register with the reference projection. The aligned images are then used in a back-projection to generate a three-dimensional reconstruction (lower left corner). This volume is searched for the helical screw operator (the coupled rotation and axial translation) that minimizes the variance between the actual volume and a symmetrized version of the volume. This screw operator is then imposed on the reconstruction to generate a helically symmetric volume used as a new reference (top) for the next cycle of the procedure.
Since each cycle involves the use of a reference volume (Fig. 1, top), a question is obviously raised as to how one can begin with no prior knowledge of what the structure looks like. Numerous applications have shown that no prior knowledge of the appearance of the structure is needed, as the method always works when starting with a solid cylinder as an initial reference (Egelman, 2007b). Images are cross-correlated each cycle with different projections of the reference volume to assign Euler angles to each image. Since all projections of a solid cylinder are the same when the azimuthal angle is changed, the effect of using a solid cylinder as an initial reference is to simply assign random azimuthal angles to each image. In fact, the solid cylinder can be eliminated, and random azimuthal angles can be assigned to generate the starting volume. In this sense, the IHRSR method does not require any starting reference volume. The method does require some estimate of the helical symmetry, and this is potentially problematic. The problems arise not from limitations of the IHRSR procedure, but from intrinsic ambiguities that exist at limited resolution, and this is discussed in much more detail later.
Using IHRSR
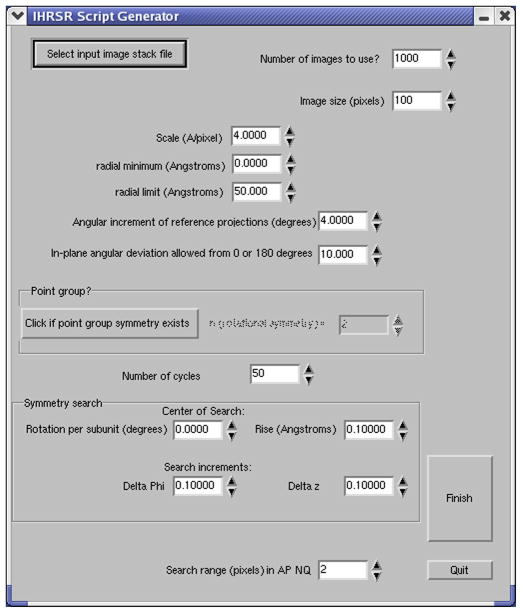
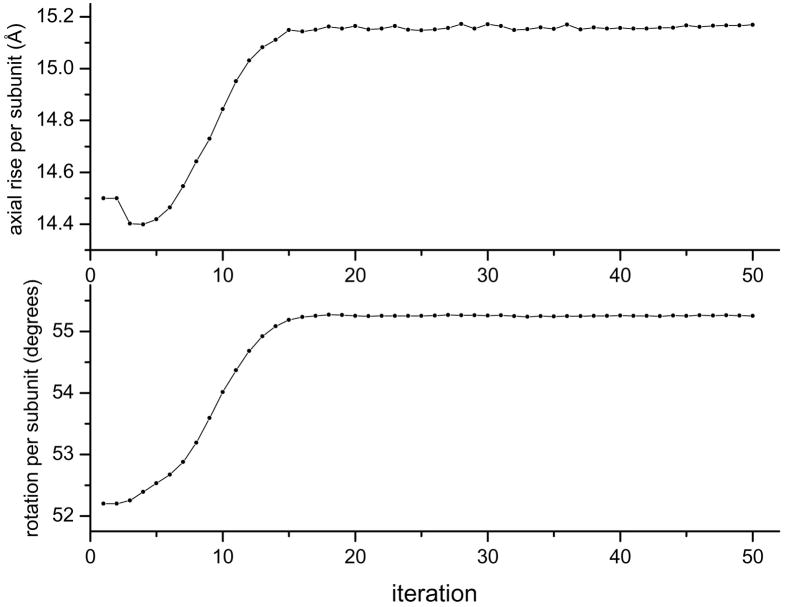
With the hope that the caveats discussed below about helical ambiguities will be fully appreciated, IHRSR works very simply when one starts with an estimate of the helical symmetry. This estimate can come from indexing power spectra obtained from the images, from knowledge of the mass per unit length, or from trial and error. At this point, IHRSR scripts only exist for SPIDER (Frank et al., 1996), but that will be changing and IHRSR approaches should be available in the future for packages such as EMAN (Ludtke et al., 1999), EMAN2 (Tang et al., 2007) and SPARX (Hohn et al., 2007). A graphical user interface (Fig. 2), called generator, exists to write the SPIDER script and create the initial symmetry file. This symmetry file is updated each cycle (Fig. 3) as the iterations proceed.
Fig. 2.
A graphical interface is shown for writing the IHRSR Spider script. All of the needed parameters are entered through this interface, including the initial estimate of the helical symmetry (the rotation and axial translation that operates on one subunit to generate another one). For objects with a rotational point group symmetry Cn in addition to a helical symmetry, the value of n can be entered.
Fig. 3.
The helical screw symmetry (axial rise and rotation per subunit) are determined each iteration of IHRSR. The figure shows the convergence of both parameters from initial values for filaments of the human Dmc1 protein formed on DNA (Sheridan et al., 2008).
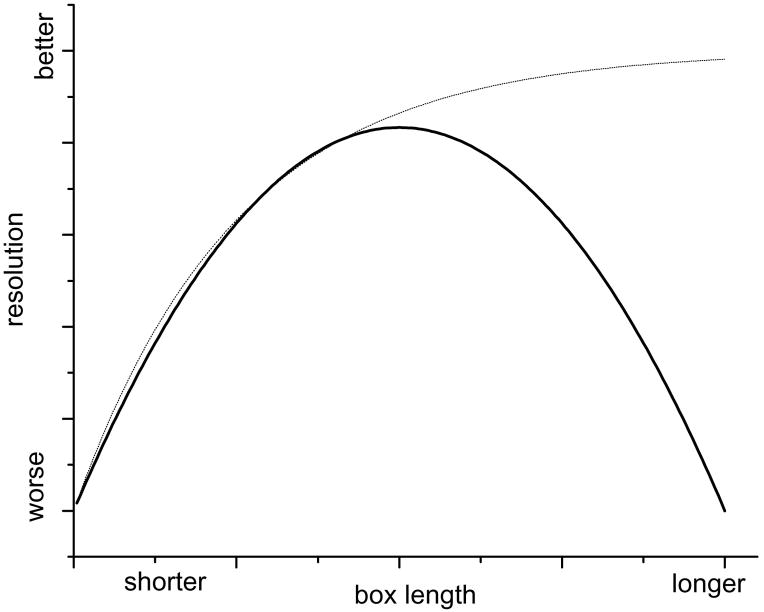
There are many practical questions that arise when using IHRSR, and one of the first is the optimal length of the segments to be used, and the optimal overlap (or shift) between adjacent boxes. In conventional single-particle reconstruction, the box size is simply determined by the size of the object. For helical filaments, the minimum width of the box is determined by the object size, but the length is arbitary. A “gedanken” experiment is shown in Fig. 4 for the resolution as a function of box length. For a perfectly ordered specimen (thin dotted line), the longer the box length the better the resolution that one can achieve. This can be understood due to the fact that the shorter the box length, the greater the error in alignment of segments against reference projections. The main limitation on resolution would thus be the errors in alignment.
Fig. 4.
A “gedanken” experiment showing resolution as a function of box length. For a perfectly ordered ideal helical specimen (dotted line) the resolution will improve as the box becomes longer, due to the fact that there will be less alignment error the longer the box. For most real specimens (solid curve) there is an optimal box length that can only be found empirically.
For most real specimens, however, the resolution as a function of box length would more likely follow the solid curve. When one uses boxes longer than optimal, the resolution suffers due to the fact that the “coherence” of the polymer (Egelman and DeRosier, 1982) is shorter than the box length, and one is blurring the reconstruction by adding in portions that are not in helical register. Similarly, the flexibility and curvature of the polymer will be a factor in determining the optimum box length. While algorithms have existed to computationally straighten images of curved polymers (Egelman, 1986), these are intrinsically artifactual, as they assume that the polymer is undergoing a normal mode of bending. While such an assumption is reasonable for a homogeneous solid, it fails for a helical polymer that has grooves which may be compressed more readily than subunits. The IHRSR approach relies upon using a piece-wise linear approximation of the continuum, so a gently curving polymer is broken up into short lengths that are each treated as a straight segment. The radius of curvature will obviously be important in determining the optimal box length. If the box length is too long, curvature within a segment will degrade the resolution, so as the box becomes longer than optimal (Fig. 4) the resolution will decline. Unfortunately, the optimal box length may only be determined empirically for each specimen, will depend upon the signal-to-noise ration in the images as well as the properties of the polymer, and there are no simple formulas describing what is optimal.
There is absolutely no relation between the box length chosen and the classical notion of a helical repeat. A helical repeat is defined as the distance that a subunit must be translated along the axis to be in register with another subunit. This helical repeat must be the product of an integer multiplied by the axial rise per subunit. I have argued (Egelman, 2007b) that this description of helical symmetry is a poor one, as it is ill-conditioned. Consider an actin filament with the simplest possible repeat, 13 subunits in 6 turns of the left-handed 1-start helix, with an axial rise per subunit of 27.3 Å. This filament will have a repeat of 13*27.3 Å=355 Å. The angle between adjacent subunits is 360o*6/13=166.15°. If this angle is changed by.03°, the best approximation of the repeat might be 938 subunits in 433 turns, with a repeat distance of 25,607 Å. Thus, a nearly infinitesimal change in the twist gives rise to a catastrophic change in the repeat distance. On the other hand, one would have a very difficult time experimentally distinguishing between an actin helix that repeats every 938 subunits versus one that repeats every 13 subunits, which is another reason why the use of the term “repeat” is a poor one. The length of the box chosen must be at least three or four times the axial rise per subunit (27.3 Å in the case of F-actin) for the helical search and imposition to work, but there is no relationship between this box length and whether F-actin repeats in 13 subunits, 28 subunits or 938 subunits.
The optimal overlap between adjacent boxes also depends upon the axial rise per subunit. The search range that is used in SPIDER in the multi-reference alignment sets a limit for how far images are translated when seeking the best alignment against reference projections. This search range must be at least half the axial rise per subunit. That is the maximal axial translation that is needed to bring any given image into register with the best-matching projection. If the shift between adjacent overlapping segments is only twice the search range, then one image may be translated down by the search range to align it with a reference projection, and the subsequent image may be translated up by the search range so that they are both in register with the same reference projection. These two images will therefore be used in the back-projection as the same view of the object being reconstructed. One will waste time in both the alignment phase and the reconstruction phase without including any new information. On the other hand, if there is little or no overlap, one is essentially throwing out useful data, as an overlapping image shifted by several subunits provides a completely different view of the helical structure. So one needs to introduce as much overlap of adjacent boxes as possible, as long as two adjacent boxes are not being translated in the alignment and reconstruction procedure to provide the same view of the helix.
Intrinsic ambiguities in helical symmetry
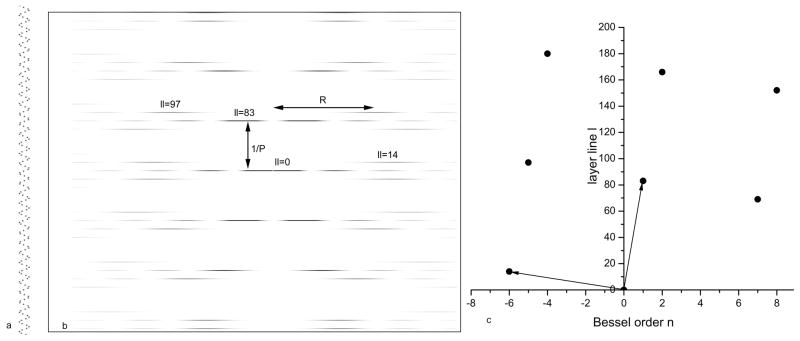
To understand these intrinsic ambiguities, let us look at the amplitudes along a layer line of order n generated by a helical arrangement of atoms, all at a radius r=ro. As shown (Klug et al., 1958), the layer line amplitude F(R) in the Fourier transform (where R is the radius in reciprocal space from the meridian, the imaginary vertical line that runs through the center of the transform) will be proportional to Jn(2πRro), with Jn being an ordinary Bessel function of order n. Let us set ro=24 Å for a three-dimensional helical array of atoms, and an image, corresponding to the projection of the three-dimensional array onto a plane, is shown in Fig. 5a. The power spectrum of this image is shown in Fig. 5b. Indexing this power spectrum involves assigning Bessel orders to each layer line. Let us look at the layer line marked as “ll=97”, where we can measure R ≈0.043 Å−1 for the position of the first maximum. Since EM image analysis of helical polymers (as opposed to electron or x-ray diffraction) begins with images, one can easily measure the maximum diameter of this array of atoms, which would yield an estimate of ro ≈24 Å. We can therefore see that 2π(0.043)(24)=6.5, and |n| must be 5 on this layer line, since the function J5(x) has its first maximum when the argument x is equal to 6.4 (the difference between 6.4 and 6.5 is experimental error). We only need to do this for two independent layer lines (such as the two marked by the basis vectors shown in Fig. 5c), and we can then index all layer lines as shown in the n,l plot. The only ambiguity that exists is with the helical hand. In the n,l plot shown in Fig. 5c, it is assumed that the 1-start helix (which passes through every subunit) is right-handed, hence it has been assigned n=+1. But from the information shown, this could just as well be left-handed (generating the same projection seen in Fig. 5a), and the n,l plot would be mirrored. In this case, there would be n=+5 on ll=97, rather than n=−5 as shown. Information would need to be obtained, such as by tilting the sample in the EM (Finch, 1972) or by metal shadowing (Woodward et al., 2008), to determine the hand of the helix. Because of the projection theorem (relating the image to the projection of the three-dimensional density distribution onto two-dimensions) any information about hand has been simply lost, whether one is using cryo-EM of unstained, frozen-hydrated samples or conventional EM of negatively stained samples (Egelman and Amos, 2009).
Fig. 5.
A helical array of “atoms” having 6.17 atoms per turn is shown in (a). The power spectrum of this array (the squared modulus of the Fourier transform) is shown in (b). The n,l plot, showing which Bessel function n is allowed on each layer line l, is shown in (c). The n=1 layer line, labeled ll=83 in (b), corresponds to a 1-start helix which passes through every subunit. The distance from this layer line to the equator is the reciprocal of the pitch of this 1-start helix, and this distance is labeled 1/P in (b). The layer line nearest the equator, ll=14, can be seen from (c) to have n=−6, while ll=97 can be seen to have n=−5. Two arbitrary basis vectors have been drawn in (c), and every other point in the n,l plot arises from a linear combination of these two vectors. Other basis vectors might have been chosen, such as (n=−5, ll=97) and (n=7, ll=69), as long as these vectors are independent and not simply different orders of the same vector (such as (n=1, ll=83) and (n=2, ll=166)). The n,l plot corresponds to a right-handed 1-start helix, but this information cannot be determined from the projection in (a), as a left-handed 1-start helix would give rise to the same projection in (a) and power spectrum in (b).
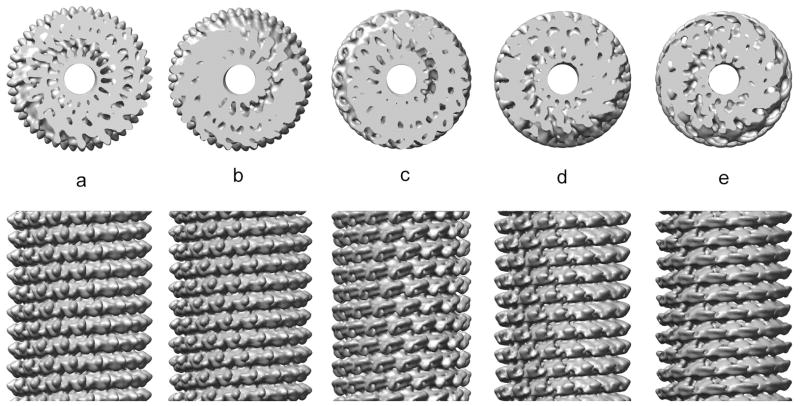
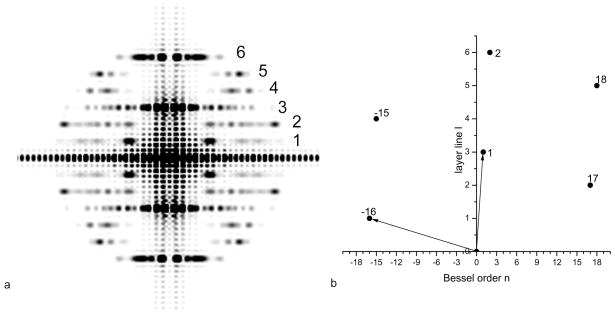
The point of this exercise has been to show that the helical diffraction pattern of an array of points (or atoms) can be simply indexed when these points are all at a single radius. The problem with electron microscopy of helical protein polymers is that subunits are rarely approximated well by a single point scatterer. Let us look at the example of Tobacco Mosaic Virus, which has been a model system in EM (Jeng et al., 1989;Sachse et al., 2007;Zhu et al., 2001). Fig. 6a shows the 5 Å resolution reconstruction of TMV (Sachse et al., 2007) when filtered to 10 Å resolution. Projections were made from this volume at random azimuthal angles, generating 1,000 images. These images were reconstructed using the IHRSR algorithm shown in Fig. 1, starting with a symmetry of 16.4 subunits per turn of a 23 Å pitch helix, and with a solid cylinder as an initial reference volume. These parameters are quite close to the actual symmetry of TMV, with ~ 16.33 subunits per turn of a 23 Å pitch helix. The IHRSR method rapidly converges to the correct structure, and a volume is shown after 10 cycles (Fig. 6b). Next, the IHRSR algorithm was started with a twist and axial rise corresponding to 15.67 subunits per turn of a 23 Å pitch helix. This also converges rapidly, but to this wrong solution (Fig. 6c). Similarly, convergence occurs to 14.33 units per turn (Fig. 6d) and 12.33 units per turn (Fig. 6e) when the IHRSR algorithm is started near these values. To understand what is taking place here one needs to recognize the intrinsic ambiguities in helical indexing, the procedure where one assigns a Bessel function to a layer line. The power spectrum from the images used in this simulation is shown in Fig. 7a, and the layer lines are labeled 1–6. Since the three-dimensional volume was filtered to 10 Å resolution, the power spectrum does not extend beyond 1/(10 Å). This is an important point, as the ambiguities that I discuss disappear in this case when higher resolution is available. The n,l plot for this power spectrum is shown in Fig. 7b, and was generated since we know the symmetry of the model! The n,l plot shows us that there is an n=−16 on ll=1, and an n=17 on ll=2. What can be determined unambiguously from the power spectrum, since one knows the outer diameter of the particles used to generate the power spectrum (~ 180 Å), is that there must be an n=1 on ll=3 and an n=2 on ll=6. This follows from the fact that the outer radius of the particle sets a maximum limit on the Bessel function generating a peak at a radius R in the power spectrum. Determining the Bessel orders on the other layer lines is problematic, in contrast to what has been shown in Fig. 5 for an array of atoms at a single radius, since the outer diameter of the particle does not set a minimum allowable Bessel function. The problem that arises is in conflict with statements in the literature suggesting that the indexing of such power spectra from real structures (and not an array of atoms at a single radius) is simple.
Fig. 6.
A model for TMV has been constructed (a) using the EM structure (Sachse et al., 2007), but filtered to 10 Å resolution. An axial view is shown at the top, and the side view at the bottom. Random azimuthal projections (120 px long, with 2 Å/px sampling) have been generated from this model (n=1,000), and these have been used for different IHRSR reconstructions (b–e). The reconstruction in (b) has the correct symmetry, 16.33 subunits per turn of a 23 Å pitch helix, and is nearly indistinguishable from the starting model (a). Different incorrect symmetries are shown in (c–e), which look extremely different from the starting model (a), but which provide stable solutions to the IHRSR algorithm. In (c), the symmetry is 15.67 subunits/turn, in (d) it is 14.33 subunits/turn and in (e) it is 12.33 subunits/turn.
Fig. 7.
The averaged power spectrum (a) from the 120 px (240 Å) long projections of the TMV model in Fig. 6a. The layer lines are numbered 1–6, where layer line 3 is at a spacing of 1/(23 Å) and arises from the 23 Å pitch 1-start helix of TMV. The n,l plot for TMV (b) shows that layer line 1 contains n=−16, layer line 2 contains n=17, etc.
The solution in Fig. 6c had 15.67 units per turn, rather than the correct 16.33 units per turn. The power spectrum from this reconstruction (Fig. 8b) has an n=16 (rather than n=−16) on the first layer line, and an n=−17 (rather than an n=17) on the second layer line. The peaks of these layer lines appear in exactly the same position as do the peaks from the correct reconstruction in Fig. 8a. But whereas the correct solution (Fig. 8a) has n=−15 and n=18 on layer lines 4 and 5, respectively, the incorrect solution in Fig. 8b has n=17 and n=−14 on layer lines 4 and 5, respectively. What can be seen is that the peaks actually occur in the same positions (in R) in Fig. 8a and 8b, even though there are very different Bessel orders involved. This is due to the fact that the radius (r) at which contrast is being generated differs between these two reconstructions. Similarly, the power spectra from the two other incorrect solutions (Fig. 6d,e) are shown (Fig. 8c,d, respectively) and one can see that these are also indistinguishable from the correct power spectrum (Fig. 8a). What this means is that starting with a power spectrum from the actual images (Fig. 7a), at a limiting resolution of 10 Å in this example, there are multiple ways to index the diffraction, but only one is correct, and the correct solution cannot be distinguished from the incorrect ones solely from the power spectrum.
Fig. 8.
The degeneracy of solutions in Fig. 6 can be best understood by comparing the power spectra from the different reconstructions. The power spectra in (a–d) are from the reconstructions in Fig. 6(b–e), respectively. The power spectrum in (a) is from the correct solution, and the layer lines are indexed exactly as shown in the n,l plot in Fig. 7b. The power spectrum in (b) comes from a three-dimensional volume with 15.67 (rather then 16.33) units/turn, and has an n=16 (rather than an n=−16) on the first layer line, and an n=−17 (rather than an n=+17) on the second layer line. The power spectrum in (c) comes from a three-dimensional volume with 14.33 (rather then 16.33) units/turn, and has an n=−14 (rather than an n=−16) on the first layer line, and an n=15 (rather than an n=17) on the second layer line. Similarly, the power spectrum in (d) comes from a three-dimensional volume with 12.33 (rather then 16.33) units/turn, and has an n=−12 (rather than an n=−16) on the first layer line, and an n=13 (rather than an n=17) on the second layer line. Despite having different Bessel orders on layer lines 1, 2, 4 and 5, the power spectra all have peaks at identical positions due to the fact that the diffraction is coming from different radii.
In comparing power spectra from reconstructions (Fig. 8) with averaged power spectra from images (Fig. 7a) we are throwing out potentially valuable phase information. This phase information might be useful in discriminating between a correct and an incorrect solution. However, I previously provided an example (Egelman, 2007b) where the projections of a correct and incorrect reconstruction were indistinguishable, demonstrating that the two-dimensional Fourier transforms (containing both phase and amplitude information) of the correct and incorrect reconstructions must also be indistinguishable. If we look at the present example, one way to use the phase information would be to do cross-correlations between the projections of the different reconstructions and the images. These cross-correlations would be sensitive to both the phases and amplitudes, while power spectra involve throwing out the phase information and only looking at the squared amplitudes.
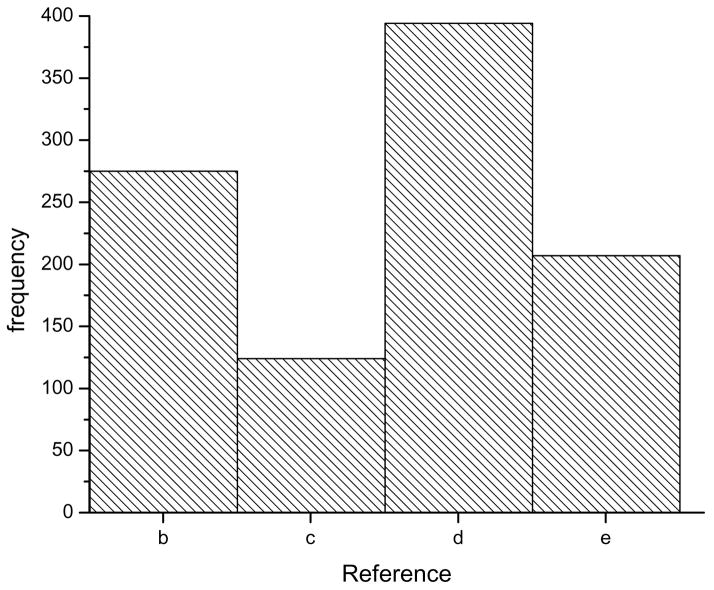
Fig. 9 shows the frequency of the highest cross-correlation between the images and projections of the five reconstructions shown in Fig. 6. Strikingly, the correct solution (Fig. 6b) does not achieve the highest cross-correlation. If one had only to choose between a symmetry of 16.33 units per turn (Fig. 6b) and a wrong symmetry of 15.67 units per turn (Fig. 6c), then this approach would be useful as it would show a higher cross-correlation for the correct solution. However, the incorrect solution of Fig. 6d with 14.33 units per turn actually has a higher cross-correlation with the images than the correct solution. One must also keep in mind that the present example has been done with perfect “images” in the absence of any noise. In reality, observed power spectra are rarely as perfect as the one in Fig. 7a, and this introduces further ambiguities.
Fig. 9.
The reconstructions in Fig. 6 can be used for a cross-correlation based sorting of the images. The histogram shows that of the three incorrect solutions (c,d,e), two (c,e) have a lower frequency than the correct solution (b). However, solution (d), which is wrong, has a higher frequency than the correct solution!
So how can one ever solve a helical structure given these potential problems? In some cases, the available resolution allows one to distinguish between different solutions. For example, one solution may predict an n=0 and another solution predicts an n=2 on the same layer line. Observing intensity on the meridian at this layer line requires that there be an n=0, establishing that it cannot be n=2. In other cases one may have prior knowledge of the structure of a subunit (but not of the polymer). As can be seen in Fig. 6, different solutions generate very different appearances for the subunit, so a solution that provides an excellent match with the prior structure provides a strong argument for the correctness of the solution. In many cases one can use additional information to discriminate. The possible solutions of 16.33, 14.33 and 12.33 units per turn make different predictions about the mass per unit length given a knowledge of the subunit molecular weight. Scanning transmission electron microscopy (STEM) is a very valuable technique for measuring mass per unit length (Wall and Hainfeld, 1986), and could discriminate among these solutions. The different solutions also make different predictions about the hand of surface helices. Techniques such as quick-freeze/deep-etch EM (Heuser, 1981), metal shadowing (Woodward et al., 2008) or AFM (Frederix et al., 2009) provide surface information that can also distinguish among solutions. Similarly, one can actually do tilts in the EM (Finch, 1972) to provide information that is lost when one is simply collecting projections.
Conclusion
This chapter has not been intended to serve as a comprehensive overview of helical symmetry, helical diffraction, and three-dimensional reconstruction from helical polymers. Rather, it is meant to provide an introduction to the IHRSR approach and some guidance and caution when dealing with the most important problem when reconstructing from images of helical polymers, deducing the helical symmetry. I show that when resolution is limited there are intrinsic ambiguities that cannot be resolved with the images alone. One must rely upon prior knowledge of the subunit appearance, or use data from complementary techniques such as metal-shadowing, STEM or AFM, to distinguish between a correct solution and ones that are wrong.
Acknowledgments
This work was supported by NIH EB001567. I thank the members of my laboratory for most of the applications of IHRSR that have appeared.
Reference List
- Chen YJ, Zhang P, Egelman EH, Hinshaw JE. The stalk region of dynamin drives the constriction of dynamin tubes. Nat Struct Mol Biol. 2004;11:574–575. doi: 10.1038/nsmb762. [DOI] [PubMed] [Google Scholar]
- Craig L, Volkmann N, Arvai AS, Pique ME, Yeager M, Egelman EH, Tainer JA. Type IV pilus structure by cryo-electron microscopy and crystallography: implications for pilus assembly and functions. Mol Cell. 2006;23:651–662. doi: 10.1016/j.molcel.2006.07.004. [DOI] [PubMed] [Google Scholar]
- Crowther RA, Padron R, Craig R. Arrangement of the heads of myosin in relaxed thick filaments from tarantula muscle. J Mol Biol. 1985;184:429–439. doi: 10.1016/0022-2836(85)90292-x. [DOI] [PubMed] [Google Scholar]
- Dang TX, Farah SJ, Gast A, Robertson C, Carragher B, Egelman E, Wilson-Kubalek EM. Helical crystallization on lipid nanotubes: streptavidin as a model protein. J Struct Biol. 2005;150:90–99. doi: 10.1016/j.jsb.2005.02.002. [DOI] [PubMed] [Google Scholar]
- DeRosier DJ, Klug A. Reconstruction of three-dimensional structures from electron micrographs. Nature. 1968;217:130–134. doi: 10.1038/217130a0. [DOI] [PubMed] [Google Scholar]
- Egelman EH. Reducing irreducible complexity: divergence of quaternary structure and function in macromolecular assemblies. Curr Opin Cell Biol. 2010;22:68–74. doi: 10.1016/j.ceb.2009.11.007. [DOI] [PubMed] [Google Scholar]
- Egelman EH. Single-particle reconstruction from EM images of helical filaments. Cur Opin Struct Biol. 2007a;17:556–561. doi: 10.1016/j.sbi.2007.07.006. [DOI] [PMC free article] [PubMed] [Google Scholar]
- Egelman EH. An algorithm for straightening images of curved filamentous structures. Ultramicroscopy. 1986;19:367–373. doi: 10.1016/0304-3991(86)90096-3. [DOI] [PubMed] [Google Scholar]
- Egelman EH. The iterative helical real space reconstruction method: Surmounting the problems posed by real polymers. J Struct Biol. 2007b;157:83–94. doi: 10.1016/j.jsb.2006.05.015. [DOI] [PubMed] [Google Scholar]
- Egelman EH. A tale of two polymers: new insights into helical filaments. Nat Rev Mol Cell Biol. 2003;4:621–630. doi: 10.1038/nrm1176. [DOI] [PubMed] [Google Scholar]
- Egelman EH. A robust algorithm for the reconstruction of helical filaments using single-particle methods. Ultramicroscopy. 2000;85:225–234. doi: 10.1016/s0304-3991(00)00062-0. [DOI] [PubMed] [Google Scholar]
- Egelman EH, Amos LA. Electron microscopy of helical filaments: rediscovering buried treasures in negative stain. BioEssays. 2009;31:909–911. doi: 10.1002/bies.200900075. [DOI] [PubMed] [Google Scholar]
- Egelman EH, DeRosier DJ. The Fourier transform of actin and other helical systems with cumulative random angular disorder. Acta Cryst. 1982;A38:796–799. [Google Scholar]
- Egelman EH, Francis N, DeRosier DJ. F-actin is a helix with a random variable twist. Nature. 1982;298:131–135. doi: 10.1038/298131a0. [DOI] [PubMed] [Google Scholar]
- Finch JT. The hand of the helix of tobacco virus. J Mol Biol. 1972;66:291–294. doi: 10.1016/0022-2836(72)90480-9. [DOI] [PubMed] [Google Scholar]
- Frank J, Radermacher M, Penczek P, Zhu J, Li Y, Ladjadj M, Leith A. SPIDER and WEB: Processing and visualization of images in 3D electron microscopy and related fields. J Struct Biol. 1996;116:190–199. doi: 10.1006/jsbi.1996.0030. [DOI] [PubMed] [Google Scholar]
- Frank J, Verschoor A, Boublik M. Computer averaging of electron micrographs of 40S ribosomal subunits. Science. 1981;214:1353–1355. doi: 10.1126/science.7313694. [DOI] [PubMed] [Google Scholar]
- Frederix PL, Bosshart PD, Engel A. Atomic force microscopy of biological membranes. Biophys J. 2009;96:329–338. doi: 10.1016/j.bpj.2008.09.046. [DOI] [PMC free article] [PubMed] [Google Scholar]
- Fujii T, Kato T, Namba K. Specific arrangement of alpha-helical coiled coils in the core domain of the bacterial flagellar hook for the universal joint function. Structure. 2009;17:1485–1493. doi: 10.1016/j.str.2009.08.017. [DOI] [PubMed] [Google Scholar]
- Heuser J. Preparing biological samples for stereomicroscopy by the quick-freeze, deep-etch, rotary-replication technique. Methods Cell Biol. 1981;22:97–122. doi: 10.1016/s0091-679x(08)61872-5. [DOI] [PubMed] [Google Scholar]
- Hohn M, Tang G, Goodyear G, Baldwin PR, Huang Z, Penczek PA, Yang C, Glaeser RM, Adams PD, Ludtke SJ. SPARX, a new environment for Cryo-EM image processing. J Struct Biol. 2007;157:47–55. doi: 10.1016/j.jsb.2006.07.003. [DOI] [PubMed] [Google Scholar]
- Jeng TW, Crowther RA, Stubbs G, Chiu W. Visualization of alpha-helices in tobacco mosaic virus by cryo-electron microscopy. J Mol Biol. 1989;205:251–257. doi: 10.1016/0022-2836(89)90379-3. [DOI] [PubMed] [Google Scholar]
- Klug A, Crick FH, Wyckoff HW. Diffraction by helical structures. Acta Cryst. 1958;11:199–213. [Google Scholar]
- Li S, Hill CP, Sundquist WI, Finch JT. Image reconstructions of helical assemblies of the HIV-1 CA protein. Nature. 2000;407:409–413. doi: 10.1038/35030177. [DOI] [PubMed] [Google Scholar]
- Ludtke SJ, Baldwin PR, Chiu W. EMAN: semiautomated software for high-resolution single-particle reconstructions. J Struct Biol. 1999;128:82–97. doi: 10.1006/jsbi.1999.4174. [DOI] [PubMed] [Google Scholar]
- Moore PB, Huxley HE, DeRosier DJ. Three-dimensional reconstruction of F-actin, thin filaments, and decorated thin filaments. J Mol Biol. 1970;50:279–295. doi: 10.1016/0022-2836(70)90192-0. [DOI] [PubMed] [Google Scholar]
- Sachse C, Chen JZ, Coureux PD, Stroupe ME, Fandrich M, Grigorieff N. High-resolution electron microscopy of helical specimens: a fresh look at tobacco mosaic virus. J Mol Biol. 2007;371:812–835. doi: 10.1016/j.jmb.2007.05.088. [DOI] [PMC free article] [PubMed] [Google Scholar]
- Sachse C, Fandrich M, Grigorieff N. Paired beta-sheet structure of an Abeta(1–40) amyloid fibril revealed by electron microscopy. Proc Natl Acad Sci U S A. 2008;105:7462–7466. doi: 10.1073/pnas.0712290105. [DOI] [PMC free article] [PubMed] [Google Scholar]
- Sheridan SD, Yu X, Roth R, Heuser JE, Sehorn MG, Sung P, Egelman EH, Bishop DK. A comparative analysis of Dmc1 and Rad51 nucleoprotein filaments. Nucleic Acids Res. 2008 doi: 10.1093/nar/gkn352. [DOI] [PMC free article] [PubMed] [Google Scholar]
- Steven AC, Couture E, Aebi U, Showe MK. Structure of T4 polyheads. II A pathway of polyhead transformation as a model for T4 capsid maturation. J Mol Biol. 1976;106:187–221. doi: 10.1016/0022-2836(76)90307-7. [DOI] [PubMed] [Google Scholar]
- Stewart M. Computer image processing of electron micrographs of biological structures with helical symmetry. J Electron Microsc Tech. 1988;9:325–358. doi: 10.1002/jemt.1060090404. [DOI] [PubMed] [Google Scholar]
- Tang G, Peng L, Baldwin PR, Mann DS, Jiang W, Rees I, Ludtke SJ. EMAN2: an extensible image processing suite for electron microscopy. J Struct Biol. 2007;157:38–46. doi: 10.1016/j.jsb.2006.05.009. [DOI] [PubMed] [Google Scholar]
- Toyoshima C, Unwin N. Three-dimensional structure of the acetylcholine receptor by cryoelectron microscopy and helical image reconstruction. J Cell Biol. 1990;111:2623–2635. doi: 10.1083/jcb.111.6.2623. [DOI] [PMC free article] [PubMed] [Google Scholar]
- Wall JS, Hainfeld JF. Mass Mapping with the Scanning Transmission Electron Microscope. Annu Rev Biophys Biophys Chem. 1986;15:355–376. doi: 10.1146/annurev.bb.15.060186.002035. [DOI] [PubMed] [Google Scholar]
- Woodhead JL, Zhao FQ, Craig R, Egelman EH, Alamo L, Padron R. Atomic model of a myosin filament in the relaxed state. Nature. 2005;436:1195–1199. doi: 10.1038/nature03920. [DOI] [PubMed] [Google Scholar]
- Woodward JD, Weber BW, Scheffer MP, Benedik MJ, Hoenger A, Sewell BT. Helical structure of unidirectionally shadowed metal replicas of cyanide hydratase from Gloeocercospora sorghi. J Struct Biol. 2008;161:111–119. doi: 10.1016/j.jsb.2007.09.019. [DOI] [PubMed] [Google Scholar]
- Yonekura K, Maki-Yonekura S, Namba K. Complete atomic model of the bacterial flagellar filament by electron cryomicroscopy. Nature. 2003;424:643–650. doi: 10.1038/nature01830. [DOI] [PubMed] [Google Scholar]
- Zhang P, Toyoshima C, Yonekura K, Green NM, Stokes DL. Structure of the calcium pump from sarcoplasmic reticulum at 8-A resolution. Nature. 1998;392:835–839. doi: 10.1038/33959. [DOI] [PubMed] [Google Scholar]
- Zhu Y, Carragher B, Kriegman DJ, Milligan RA, Potter CS. Automated identification of filaments in cryoelectron microscopy images. J Struct Biol. 2001;135:302–312. doi: 10.1006/jsbi.2001.4415. [DOI] [PubMed] [Google Scholar]


