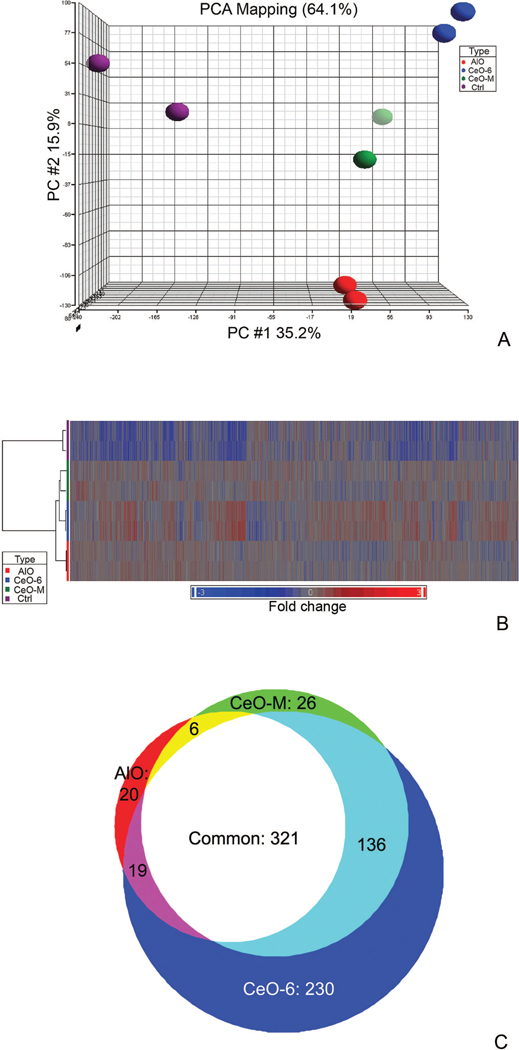
Figure 2.
Microarray analysis on HT22 cell exposed to particles of different sizes and chemistry. (A) Principal Component Analysis (PCA) of four HT22 groups: 1. No particle control, 2. CeO-6, 3. CeO-M and 4. AlO. 64.1% of the data were represented in the scatter plot and were divided among the three PCA component vectors: PC#1 (x-axis), PC #2 (y-axis), and PC#3 (z-axis). Biological duplicates were included in each group. (B) Unsupervised hierarchical clustering of expressed genes for HT22 cells exposed to different particles indicated two distinct clusters which segregated the particle-treated and non-treated group. Each row represents a sample and each column represents a gene. Red color represents over-expressed genes while blue color represents down-regulated genes, fold change is indicated on the bottom bar. (C) Comparison of global gene expression profiles of cells treated with different particles. One-way ANOVA analysis comparing gene expression of each treated group to control was performed, and the Venn diagram was produced by overlaying each group.

