
Fig. 1.
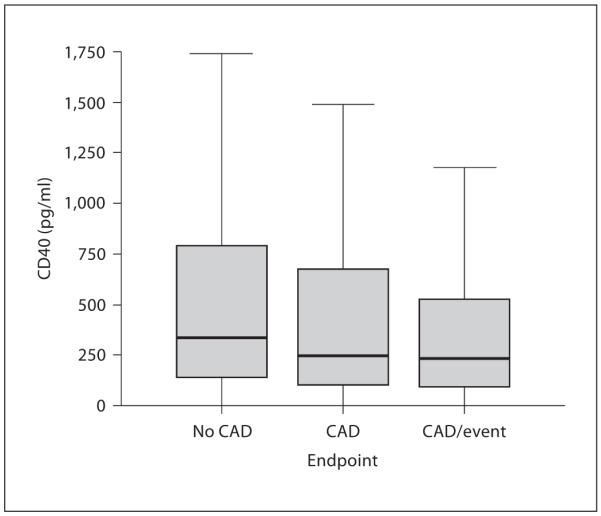
Box plot of sCD40L levels by disease endpoint. A significant inverse relationship was discovered (linear trend: p < 0.001), although this disappeared after multivariable adjustment.
Official websites use .gov
A
.gov website belongs to an official
government organization in the United States.
Secure .gov websites use HTTPS
A lock (
) or https:// means you've safely
connected to the .gov website. Share sensitive
information only on official, secure websites.
Box plot of sCD40L levels by disease endpoint. A significant inverse relationship was discovered (linear trend: p < 0.001), although this disappeared after multivariable adjustment.