

Abstract
Aging is associated with loss of muscle volume (MV) and force leading to difficulties with activities of daily living. However, the relationship between upper limb MV and joint strength has not been characterized for older adults. Quantifying this relationship may help our understanding of the functional upper limb declines older adults experience. Our objective was to assess the relationship between upper limb MV and maximal isometric joint moment-generating capacity (IJM) in a single cohort of healthy older adults (age≥65 years) for 6 major functional groups (32 muscles). MV was determined from MRI for 18 participants (75.1±4.3 years). IJM at the shoulder (abduction/adduction), elbow (flexion/extension), and wrist (flexion/extension) was measured. MV and IJM measurements were compared to previous reports for young adults (28.6±4.5 years). On average older adults had 16.5% less total upper limb MV compared to young adults. Additionally, older adult wrist extensors composed a significantly increased percentage of upper limb MV. Older adult IJM was reduced across all joints, with significant differences for shoulder abductors (p<0.0001), adductors (p=0.01), and wrist flexors (p<0.0001). Young adults were strongest at the shoulder, which was not the case for older adults. In older adults, 40.6% of the variation in IJM was accounted for by MV changes (p≤0.027), compared to 81.0% in young adults. We conclude that for older adults, MV and IJM are, on average, reduced but the significant linear relationship between MV and IJM is maintained. These results suggest that older adult MV and IJM cannot be simply scaled from young adults.
Keywords: Muscle volume, Strength, Upper limb, Aging, Joint moment
Introduction
Sarcopenia is an age-associated loss of muscle mass (Jones et al., 2008; Macaluso and De Vito, 2004; Narici and Maffulli, 2010; Rosenberg, 1989). Muscle fiber atrophy is accompanied by reduced muscle force, decreased neural activation, and diminished contractile protein quality (Clark and Manini, 2010; Macaluso and De Vito, 2004; Merletti et al., 2002; Narici and Maffulli, 2010). Some suggest that sarcopenia and muscle force reductions begin as early as the second decade of life (Macaluso and De Vito, 2004; Narici and Maffulli, 2010), with more pronounced changes later in life (Metter et al., 1997).
To better elucidate the functional declines experienced by older adults there is a need to describe the relationship between upper limb muscle volume (MV) and strength by joint (Clark and Manini, 2010). One reason for this is that muscular atrophy may differ by functional group. While overall muscle mass declines with age, the lower limb loses proportionately more mass than the upper limb (Ferrreira et al., 2009; Hughes et al., 2001; Janssen et al., 2000; Janssen and Ross, 2005; Landers et al., 2001; Macaluso and De Vito, 2004; Narici and Maffulli, 2010; Reimers et al., 1998). It is hypothesized that older adults’ sedentary behavior is partly responsible for lower limb muscle mass reductions, while upper limb muscle mass is conserved, since arms are used for activities of daily living (Landers et al., 2001; Narici and Maffulli, 2010). Within the upper limb, differential muscle atrophy by functional group has been reported at the elbow (Klein et al., 2001). Understanding how atrophy varies among major upper limb functional groups in older adults may provide information important to future work designed to mitigate age-related functional declines from experimental and computational modeling perspectives.
Muscle strength reductions may exceed muscle mass reductions with age, indicating a muscle quality decrement (Clark and Manini, 2010; Goodpaster et al., 2001; Newman et al., 2003; Park et al., 2007). Strength losses 2–5 times greater than muscle size decreases have been reported in the lower limb (Delmonico et al., 2009). Maximal isometric joint moment-generating capacity (IJM) provides a strength assessment of muscles crossing a joint. In young adults, IJM variability is largely explained by MV variations (Akagi et al., 2009b; Fukunaga et al., 2001; Holzbaur et al., 2007a; Jones et al., 2008). Relative IJM of functional muscle groups crossing the shoulder, elbow, and wrist joints have been reported for young adults (Holzbaur et al., 2007a), while reports from older adults have focused on single joints (Akagi et al., 2009b; Bazzucchi et al., 2004; Frontera et al., 2000; Hughes et al., 2001; John et al., 2009; Klein et al., 2001; Landers et al., 2001; Metter et al., 1997; Park et al., 2007; Yassierli et al., 2007). No studies have thoroughly investigated the relationship between IJM and MV for functional groups in the shoulder, elbow, and wrist of older adults.
By measuring upper limb MV and IJM in the same older adult cohort we can evaluate the distribution of and relationship between MV and strength of major upper limb functional groups. The study aims were to (1) measure MV and IJM at the shoulder, elbow, and wrist; (2) characterize the relationship between MV and IJM and; (3) compare these data on older adults to young adult data reported previously.
Methods
We recruited eighteen healthy older adults (Table 1). This study was approved by our institutional review board and all participants provided written informed consent in accordance with institutional guidelines. MV and IJM were evaluated for each subject’s dominant arm. Previously established methods (Holzbaur et al., 2007a; Holzbaur et al., 2007b) were used to assess MV and IJM to facilitate comparison between young and old cohorts. IJM testing postures were chosen because they are functional postures near the position where we expect the maximum moment to be generated (Holzbaur et al., 2007a).
Table 1.
Characteristics of older adult sample (mean ± SD). All subjects were right hand dominant except M09.
| Subjecta | Age | Height (cm) | Percentile (height)b | Body mass (kg) | Percentile (body mass)b | Total arm length (cm) |
|---|---|---|---|---|---|---|
| F01 | 75 | 154.9 | 10.0 | 56.7 | 30.0 | 51.0 |
| F02 | 72 | 160.0 | 35.0 | 54.4 | 20.0 | 53.0 |
| F03 | 77 | 167.6 | 75.0 | 78.0 | 95.0 | 56.0 |
| F04 | 83 | 167.6 | 75.0 | 71.7 | 85.0 | 54.0 |
| F05 | 80 | 157.5 | 20.0 | 49.9 | 5.0 | 54.5 |
| F06 | 66 | 160.0 | 35.0 | 86.2 | 99.0 | 49.0 |
| F07 | 69 | 162.6 | 50.0 | 72.6 | 90.0 | 55.0 |
| F08 | 73 | 165.1 | 65.0 | 83.9 | 99.0 | 52.0 |
| M01 | 72 | 171.5 | 25.0 | 78.0 | 50.0 | 54.0 |
| M02 | 76 | 180.3 | 75.0 | 81.6 | 65.0 | 61.0 |
| M03 | 77 | 181.6 | 80.0 | 81.6 | 65.0 | 60.5 |
| M04 | 80 | 177.8 | 65.0 | 90.7 | 85.0 | 59.0 |
| M05 | 81 | 160.0 | 1.0 | 63.0 | 5.0 | 51.5 |
| M06 | 73 | 185.4 | 90.0 | 81.6 | 65.0 | 62.5 |
| M07 | 74 | 172.7 | 35.0 | 90.7 | 85.0 | 54.0 |
| M08 | 73 | 177.8 | 65.0 | 79.4 | 55.0 | 61.0 |
| M09 | 76 | 180.3 | 75.0 | 84.8 | 75.0 | 59.0 |
| M10 | 74 | 172.7 | 35.0 | 78.0 | 50.0 | 54.0 |
|
| ||||||
| Cohort average | 75.1 ± 4.3 | 169.8 ± 9.4 | 50.6 ± 26.7 | 75.7 ± 12.2 | 62.4 ± 30.7 | 55.6 ± 4.0 |
| Male average | 75.6 ±3.0 | 176.0 ± 7.2 | 54.6 ± 28.8 | 81.0 ± 7.8 | 60.0 ± 23.1 | 57.7 ± 3.9 |
| Female average | 74.4 ±5.6 | 161.9 ± 4.7 | 45.6 ± 24.7 | 69.2 ±13.9 | 65.4 ± 39.8 | 53.1 ±2.3 |
The letter in the subject code designates sex (F = female; M = male).
Percentiles determined using Gordon et al. (1989).
Participants were imaged supine in a 1.5T MRI scanner (GE Healthcare, Milwaukee, WI) using a 3-dimensional spoiled gradient imaging sequence. The body coil (Table 2) was used to image muscles crossing the glenohumeral joint. A flexed array long bone coil (Invivo, Orlando, FL) was used to image muscles crossing the elbow and wrist (Table 2).
Table 2.
3-dimensional spoiled gradient imaging parameters.
| Body coil | Long bone coil | |
|---|---|---|
| Echo time (TE) | 3 ms | 5 ms |
| Relaxation time (TR) | 11.6 ms | 23 ms |
| Flip angle (FA) | 30° | 45° |
| Matrix size | 512 × 192 | 320 × 192 |
| Bandwidth | ± 31.25 kHz | ± 15.63 kHz |
| Field of view (FOV) | 32 cm | 16 cm |
| Slice thickness | 3 mm | 3 mm |
| Total scan time | ~16 min | ~22 min |
Muscle boundaries were manually segmented on each image slice (3D Doctor, Able Software Corp., Lexington, MA). A 3D polygonal surface was constructed for each muscle from the boundaries, and MV was calculated from these surfaces (Figure 1). MR image segmentation is a reliable and repeatable method to determine MV (Koltzenburg and Yousry, 2007; Tingart et al., 2003). MV was determined individually for muscles crossing glenohumeral and elbow joints and several forearm muscles (flexor carpi radialis, flexor carpi ulnaris, extensor carpi radialis longus and brevis). Remaining muscles crossing the wrist were segmented in wrist flexor and extensor groups, due to close association and few anatomical structures (e.g. bone, connective tissue) separating muscles.
Figure 1.
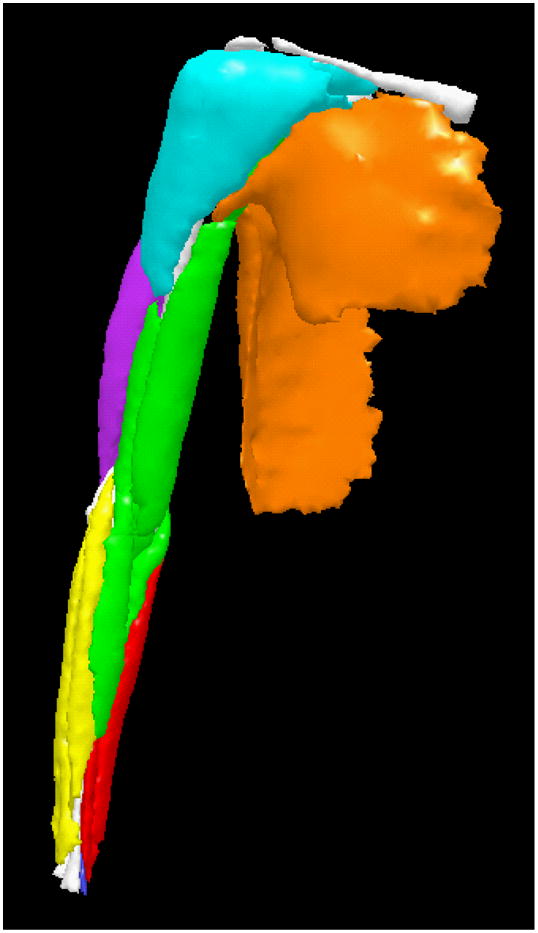
Muscle volumes by functional group in the upper limb, including shoulder abductors (cyan), shoulder adductors (orange), elbow flexors (green), elbow extensors (purple), wrist flexors (red), wrist extensors (yellow), pronator quadratus (blue), and bones (white).
Total upper limb MV (Vtotal) was calculated by summing all MV. Segmented muscles were assigned to functional groups and summed to obtain functional group MV (Vfg) (Table 3). MV distribution was determined by calculating functional group MV fraction (Ffg) as a percent of Vtotal (Equation 1). Mean Ffg was calculated across participants (Table 4).
Table 3.
Muscle volumes by functional group for older adults (mean ± SD).
| Cohort average volume (cm3) | Male average volume (cm3) | Female average volume (cm3) | |
|---|---|---|---|
|
Shoulder adductor functional group
| |||
| Coracobrachialis | 13.1 ± 3.7 | 14.7 ± 3.0 | 11.2 ± 3.8 |
| Latissimus dorsi | 268.1 ± 91.9 | 324.9 ± 78.7 | 197.1 ± 46.6 |
| Pectoralis Major | 203.6 ± 86.2 | 262.9 ± 64.5 | 129.5 ± 37.5 |
| Teres major | 34.4 ± 10.7 | 40.6 ± 8.9 | 26.8 ± 7.4 |
| Teres minor | 25.3 ± 8.1 | 31.1 ± 5.0 | 18.1 ± 4.3 |
|
Shoulder abductor functional group
| |||
| Deltoid | 313.7 ± 77.3 | 370.1 ± 39.8 | 243.2 ± 47.2 |
| Infraspinatus | 101.7 ± 28.4 | 118.6 ± 26.7 | 80.7 ± 11.5 |
| Subscapularis | 102.5 ± 31.5 | 122.2 ± 26.4 | 77.8 ± 16.1 |
| Supraspinatus | 39.9 ± 15.0 | 48.1 ± 15.0 | 29.5 ± 6.3 |
|
Elbow flexor functional group
| |||
| Biceps brachii | 142.8 ± 50.6 | 178.7 ± 37.5 | 97.9 ± 16.5 |
| Brachialis | 96.7 ± 25.1 | 111.0 ± 20.0 | 78.9 ± 19.0 |
| Brachioradialis | 41.7 ± 16.5 | 54.2 ± 9.2 | 26.1 ± 6.8 |
| Pronator teres | 31.9 ± 15.0 | 41.2 ± 13.7 | 20.4 ± 5.2 |
|
Elbow extensor functional group
| |||
| Anconeus | 6.4 ± 2.4 | 7.8 ± 2.3 | 4.7 ± 1.1 |
| Supinator | 16.8 ± 6.1 | 19.0 ± 6.7 | 14.0 ± 4.1 |
| Triceps brachii | 303.9 ± 87.4 | 369.1 ± 53.6 | 222.4 ± 34.6 |
|
Wrist flexor functional group
| |||
| Flexor carpi radialis | 41.2 ± 9.8 | 46.9 ± 8.6 | 34.1 ± 5.8 |
| Flexor carpi ulnaris | 39.3 ± 12.5 | 48.4 ± 8.5 | 27.8 ± 4.2 |
| Wrist flexorsa | 160.3 ± 59.2 | 198.8 ± 52.6 | 112.1 ± 14.2 |
|
Wrist extensor functional group
| |||
| Extensor carpi radialisb | 50.1 ± 15.5 | 59.7 ± 13.9 | 38.1 ± 6.2 |
| Wrist extensorsc | 93.8 ± 27.6 | 112.7 ± 19.7 | 70.2 ± 14.3 |
| Pronator quadratus | 6.4 ± 2.9 | 8.2 ± 2.8 | 4.3 ± 1.1 |
| Total | 2133.8 ± 615.1 | 2588.9 ± 387.9 | 1565.0 ± 244.7 |
WE volume includes palmaris longus, flexor digitorum superficialis, flexor digitorum profundus, flexor pollicis longus, and abductor pollicis longus.
Extensor carpi radialis volume includes extensor carpi radialis longus and extensor carpi radialis brevis.
WF volume includes extensor carpi ulnaris, extensor digitorum communis, extensor digiti minimi, extensor indicis proprius, extensor pollicis longus, and extensor pollicis brevis.
Table 4.
Functional group volume fractions and maximal isometric joint moments for older adults (mean ± SD).
| Functional group | Cohort average volume fraction (%) | Male average volume fraction (%) | Female average volume fraction (%) | Cohort average isometric joint moment (Nm) | Male average isometric joint moment (Nm) | Female average isometric joint moment (Nm) |
|---|---|---|---|---|---|---|
| Shoulder adductors | 25.2 ± 2.8 | 26.0 ± 2.9 | 24.2 ± 2.6 | 42.6 ± 24.7 | 54.4 ± 26.0 | 27.9 ± 13.1 |
| Shoulder abductors | 26.5 ± 2.4 | 25.6 ± 2.4 | 27.6 ± 2.2 | 25.8 ± 10.7 | 31.7 ± 7.6 | 18.3 ± 9.5 |
| Elbow flexors | 14.6 ± 0.9 | 14.9 ± 1.0 | 14.2 ± 0.7 | 44.7 ± 23.4 | 53.5 ± 25.9 | 33.7 ± 14.8 |
| Elbow extensors | 15.4 ± 0.7 | 15.3 ± 0.8 | 15.4 ± 0.5 | 37.6 ± 16.1 | 46.2 ± 14.9 | 27.0 ± 10.5 |
| Wrist flexors | 11.3 ± 1.3 | 11.3 ± 1.3 | 11.3 ± 1.4 | 10.0 ± 5.6 | 13.7 ± 5.0 | 5.4 ± 0.9 |
| Wrist extensors | 6.8 ± 0.8 | 6.6 ± 0.5 | 7.0 ± 1.1 | 8.9 ± 4.3 | 11.3 ± 4.0 | 5.9 ± 2.4 |
| (Equation 1) |
Muscles were grouped based on their moment arm in the postures used for IJM assessments. In a posture of 60° coronal plane abduction, Kuechle et al. (1997) report posterior deltoid with an abductor moment arm, while Ackland et al. (2008) report an adductor moment arm close to zero. Posterior deltoid was grouped with shoulder abductors, according to the whole muscle’s average moment arm (Ackland et al., 2008; Hughes et al., 1998; Kuechle et al., 1997).
IJM was assessed at the wrist (flexion/extension), elbow (flexion/extension) and shoulder (abduction/adduction) using a KIN-COM dynamometer (Isokinetic International, Harrison, TN). Postures were consistent with Holzbaur et al. (2007a) (Table 5). For each functional group, three 5-second trials were collected. Order of joints tested was randomized across participants. Participants rested for 60 seconds between trials, with ~2 minutes of rest between testing at each joint to reconfigure the dynamometer. Participants were verbally encouraged to provide maximal effort. A custom Matlab (The MathWorks, Natick, MA) program was used to assess the maximum IJM sustained for 0.5 seconds. The maximal moment across all trials was considered the subject’s maximum IJM (Table 4).
Table 5.
Testing postures for isometric joint moment-generating capacity measurements at the shoulder, elbow, and wrist joints. For all trials, participants were seated and restrained with straps crossing the shoulders and lap, restricting torso motion.
| Wrist (flexion/extension) | Elbow (flexion/extension) | Shoulder (abduction/adduction) |
|---|---|---|
| Wrist in neutral posture, forearm pronated, elbow flexed at 90°, shoulder in neutral abduction | Elbow flexed at 90°, forearm supinated with wrist braced, shoulder in neutral abduction | Shoulder abducted at 60L, elbow braced in extension, forearm in neutral rotation |
Our first objective was to measure MV and IJM at the shoulder, elbow, and wrist for older adults. For our second objective, linear regression was used to assess the association between IJM and functional group MV among older adults. For the third objective, these data on older adults were compared to previously reported measurements from young adults (Holzbaur et al., 2007a; Holzbaur et al., 2007b). Mixed effects models for repeated measures were used to evaluate age group differences for IJM, MV, and percent MV, adjusting for sex and body mass. Within these models, age group variation was explored by assessing differences between functional groups. Due to our small sample size, males and females were evaluated together with covariate adjustments for sex. Holm sequential Bonferroni (Holm, 1979) was used to control Type I error at the 0.05 level for comparisons of young and older adults for each outcome. Functional group ordering for IJM, MV, and percent MV by age group was compared using tests (p≤0.0125 level) of proportions under binomial distribution assumptions. We used SAS software (Cary, NC) for all analyses.
Results
We measured upper limb functional group MV (Table 3) and IJM at the shoulder, elbow, and wrist (Table 4) in older adults. Although older adults spanned a 2.5-fold range of total MV, small coefficients of variation (range 0.043–0.118) of functional group percent MV indicate low muscle distribution variability relative to means across individuals. There was a positive relationship between functional group MV and IJM at all joints for older adults (p≤0.027) (Figure 2). On average, MV changes accounted for 40.6% of the variation in IJM.
Figure 2.

Separate regression lines are fit to data from older and younger adults. Maximum isometric joint moment versus functional group muscle volume for (a) shoulder adduction, p<0.001; (b) shoulder abduction, p=0.026; (c) elbow flexion, p=0.003; (d) elbow extension, p=0.006; (e) wrist flexion, p=0.025; (f) wrist extension, p=0.002. Older adults are shown with circles (males=white circles; females=black circles) and young adults (Holzbaur et al., 2007a; Holzbaur et al., 2007b) are shown with triangles (males=white triangles; females=black triangles). Correlation coefficients represent the different age groups and p-values presented above represent the significance of the older adult linear regression. In older and young adult groups, there was a significant linear relationship between maximal isometric joint moment and functional group muscle volume for each joint. However, the older adult cohort demonstrated more variation in this relationship than the young adult group.
We evaluated differences between age groups for MV, IJM, and the relationship between MV and IJM. On average, total upper limb MV in older adults was 16.5% lower than young adult total MV, despite similar body mass (older adults 5–99th percentile, young adults 5–90th percentile) (Table 1) (Holzbaur et al., 2007b). Older adult MV was reduced significantly compared to young adults for shoulder abductors (mean difference=155.7cm3; p=0.0002), elbow flexors (mean difference=77.7cm3; p=0.0001), and elbow extensors (mean difference=75.5cm3; p=0.0007) (Figure 3). We observed a significant increase in MV as a percentage of total upper limb MV for wrist extensors (mean difference=−1.8%; p<0.0001) (Figure 4). For both age groups, ordering of functional groups by volume remained consistent; shoulder abductors and wrist extensors comprised the largest and smallest upper limb volumes, respectively.
Figure 3.
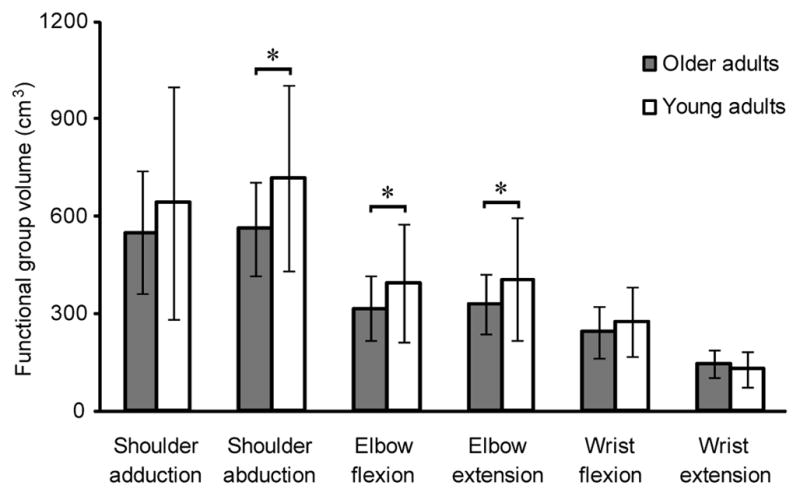
Muscle volume by functional group for older adults and young adults (mean ± SD) (Holzbaur et al., 2007b). * indicates significant difference between older adults and young adults using the Holm sequential procedure. Mean difference is the difference in mean volume between older adults and young adults. Shoulder adductor volume mean difference=93.5 cm3; p=0.0627; shoulder abductor volume mean difference=155.7 cm3; p=0.0002; elbow flexor volume mean difference=77.7 cm3; p=0.0001; elbow extensor volume mean difference=75.5 cm3; p=0.0007; wrist flexor volume mean difference=30.0 cm3; p=0.0325; wrist extensor volume mean difference=−17.1 cm3; p=0.7418. Older adults had significantly reduced volume for all functional groups, except wrist extensors. Despite this volume reduction, the ordering of the functional groups by volume remained consistent with young adults, whereby the shoulder had the largest volume and wrist had the smallest volume in the upper limb.
Figure 4.
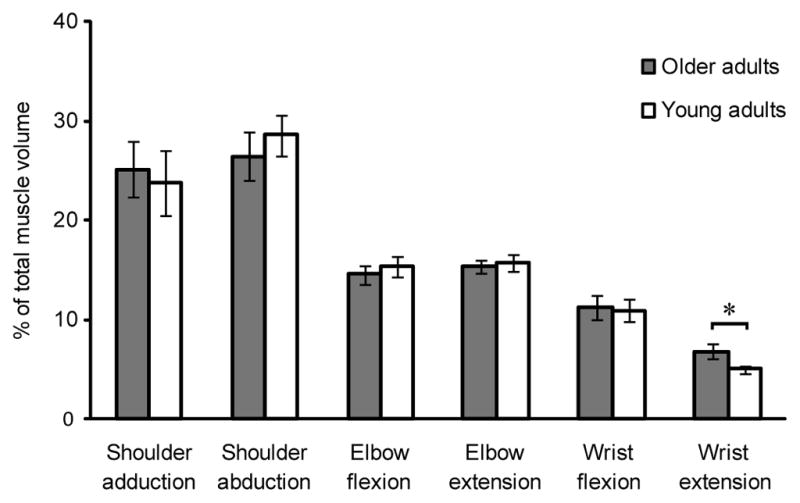
Functional group muscle volume as a percent of total upper limb muscle volume for older adults and young adults (mean ± SD) (Holzbaur et al., 2007b). * indicates significant difference between older adults and young adults using the Holm sequential procedure. Mean difference is the difference in mean volume between older adults and young adults. Shoulder adductor mean difference=−1.4%; p=0.2574; shoulder abductor mean difference=2.2%; p=0.0245; elbow flexor mean difference=−0.7%; p=0.1932; elbow extensor mean difference=0.4%; p=0.1753; wrist flexor mean difference=−0.3%; p=0.3039; wrist extensor mean difference=−1.8%; p<0.0001. Despite having a reduction in muscle volume, the order of functional group volumes remained consistent between the older and younger adult groups, whereby shoulder abductors and wrist extensors made up the largest and smallest proportions of upper limb volume, respectively.
IJM was significantly reduced in older adults compared to young adults for shoulder adduction (mean difference=25.3Nm; p=0.01), shoulder abduction (mean difference=28.9Nm; p<0.0001), and wrist flexion (mean difference=8.1Nm; p<0.0001) (Figure 5). Mixed effects analyses showed that differences in IJM between shoulder abduction and wrist flexion (p=0.0003), shoulder adduction and elbow extension (p=0.0181), and shoulder adduction and wrist extension (p=0.0146) were significantly lower in older adults, indicating the shoulder is relatively weaker compared to distal joints in older adults.
Figure 5.

Maximal isometric joint moments for older adults and young adults (mean ± SD) (Holzbaur et al., 2007a; Holzbaur et al., 2007b). * indicates significant difference. Mean difference is the difference in mean volume between older adults and young adults using the Holm sequential procedure. Shoulder adduction mean difference=25.3 Nm; p=0.01; shoulder abduction mean difference=28.9 Nm; p<0.0001; elbow flexion mean difference=11.0 Nm; p=0.1554; elbow extension mean difference=5.1 Nm; p=0.3239; wrist flexion mean difference=8.1 Nm; p<0.0001; wrist extension mean difference=1.3 Nm; p=0.1001. Older adults generated less joint moment than young adults across all joints tested, which was significant for shoulder adduction, shoulder abduction and wrist flexion. Differences in strength between shoulder abduction and wrist flexion (p=0.0003), shoulder adduction and elbow extension (p=0.0181), and shoulder adduction and wrist extension (p=0.0146) were significantly lower in older adults, indicating that the shoulder is relatively weaker compared to distal joints in older adults.
Binomial distribution analysis showed consistent ordering of MV between age groups, with shoulder>elbow>wrist (p<0.001, all comparisons), although relative functional group IJM was altered. Young adults were significantly stronger in shoulder adduction compared to elbow extension (p<0.001), whereas older adults were significantly stronger in elbow flexion compared to shoulder abduction (p=0.004). Both age groups were significantly stronger at the elbow compared to the wrist (p<0.001, flexion and extension). Young adults had a 6.7-fold mean difference between strongest (shoulder adduction) and weakest (wrist extension) functional groups, while older adults had a 5-fold mean difference between strongest (elbow flexion) and weakest (wrist extension) functional groups.
We observed significant linear relationships between functional group MV and IJM in older adults (p≤0.027) (Figure 2), consistent with previous observations in young adults. However, corresponding functional group MV explained less variation in IJM for older adults (mean r2=40.6%) than for young adults (mean r2=81.0%). No statistically significant difference between slopes was observed, but there was a trend toward markedly lower shoulder volume and strength in old compared to young adults.
Discussion
We measured upper limb functional group MV and obtained maximum IJM at the shoulder, elbow, and wrist in 18 older adults. In older adults, total MV, functional group MV, and IJM were reduced compared to young adults, despite similar body mass between groups. We observed markedly reduced MV at the shoulder in older adults compared to young adults. Older adults were not strongest at the shoulder like young adults, suggesting that relative differences between strength at different joints are not consistent with age. Although age-related MV and IJM reductions occur, the linear relationship between functional group MV and IJM was maintained in older adults. While older adults presented with overall decreases in functional group MV and IJM compared to young adults, the shoulder had the most marked deficits.
Shoulder abductor MV and IJM were significantly reduced in older compared to young adults. Other age-related neuromuscular changes, in addition to decline in MV, that have been implicated in IJM deficits, include infiltration of intramuscular fat, increased connective tissue, reduced contractile tissue, reduced neural drive, changes at the neuromuscular junction, increased antagonist muscle coactivation, decreased muscle fiber specific tension, and preferential atrophy of type II muscle fibers (Dey et al., 2009; Frontera et al., 2000; Janssen and Ross, 2005; Jones et al., 2008; Klein et al., 2001; Landers et al., 2001; Lynch, 2004; Lynch et al., 1999; Merletti et al., 2002; Narici et al., 1991; Narici and Maffulli, 2010; Narici et al., 2003; Valdez et al., 2010). The difference in upper limb MV observed in older adults may also be due to disuse, either alone or in combination with a pre-existing injury, like an asymptomatic rotator cuff tear. Between 20–50% of older adults have a torn rotator cuff, so it is possible that some participants had asymptomatic tears, causing atrophy and decreased strength of affected muscles (Lin et al., 2008; Yamamoto et al., 2010). This was not explicitly investigated because our images were not T2-weighted. On the other hand, wrist extensors represented proportionally more total upper limb volume in older compared to younger adults. One possible explanation for the observed differences is that daily living tasks may use wrist and elbow joints more than the shoulder, causing both MV and IJM deficits at the shoulder (Landers et al., 2001).
We investigated shoulder, elbow, and wrist joints concurrently in older adults to assess relative differences in IJM of major upper extremity functional groups. Our data expand upon findings of Klein et al. (2001), who observed differing MV and strength changes among elbow functional groups. Our finding of reduced IJM in older adults is consistent with previous studies investigating single joints (Akagi et al., 2009b; Bazzucchi et al., 2004; Frontera et al., 2000; Hughes et al., 2001; John et al., 2009; Klein et al., 2001; Landers et al., 2001; Metter et al., 1997; Park et al., 2007; Yassierli et al., 2007). Our assessment of multiple joints concurrently allowed us to describe relationships in MV and IJM between upper limb joints. Differences between functional groups were largest at the shoulder; young adults were strongest at the shoulder, whereas older adults had markedly reduced shoulder strength.
We observed a significant relationship between MV and IJM in older adults, but an important observation was that less variation in IJM was accounted for by MV for older compared to young adults. This may be due to age-related decreases in neural stimulation and muscle tissue composition changes (Jones et al., 2008), or caused by reduced contractile protein and fat-free mass in aged muscle (Dey et al., 2009; Janssen and Ross, 2005; Narici and Maffulli, 2010; Narici et al., 2003). These changes may affect the ability of older adults to maximally activate all muscle volume that could contribute to IJM generation. The relationship between muscle strength and cross-sectional area (CSA) has been presented previously for young and older adults (Akagi et al., 2009a; Ikai and Fukunaga, 1968; Jones et al., 2008). We measured MV, which is the product of physiological CSA and optimal fiber length, (e.g. Fukunaga et al., 2001). Volume is consistent with calculations utilizing physiological CSA measurements (Holzbaur et al., 2007b) and does not depend on optimal fiber length or pennation angle estimates, which are difficult to measure in vivo and can decrease with age. Our results expand on previous work reporting the relationship between MV and force-generating ability to include older adults (Akagi et al., 2009b; Fukunaga et al., 2001; Holzbaur et al., 2007a; Jones et al., 2008). Our findings are consistent with previous studies reporting decreased peak IJM with each decade past 50 years (Jones et al., 2008; Lynch et al., 1999; Macaluso and De Vito, 2004).
This work provides a foundation for understanding clinically-relevant, age-related upper limb changes, and for ultimately making rehabilitation or injury treatment recommendations for older adults. Efforts to mitigate age-related strength losses to retain an unimpaired strength profile are necessary for older adults to maintain independence. We anticipate that upper limb coordination will be affected by musculoskeletal system changes, such as antagonist co-contraction or a decreased ability to activate the entire muscle volume. Subsequently, some functional tasks may not be possible to perform. This work also provides a foundation for future studies characterizing coordination changes in older adults with reduced MV and altered IJM. Further analyses of upper extremity movements in healthy or impaired older adults would benefit from development of musculoskeletal models better reflecting the force-generating characteristics of older individuals described here.
This study has several limitations. Males and females were evaluated in the same analyses, due to our small sample size. While absolute volumes and strengths differed by sex, similar relationships were seen across groups. However, sex-based differences warrant further study. Our small sample also limits generalizability of our data.
Intramuscular fat content was not measured. An additional fat quantification scan was not included to reduce scan time and participant burden. While our method may have overestimated the amount of contractile tissue, reduced upper limb MV and altered relationships between MV and IJM at the shoulder were detected. Accounting for intramuscular fat in future work may improve our ability to explain age-related differences in MV and IJM.
Muscle force generation is posture dependent (Zajac, 1989), but we tested IJM in a single posture for each joint. Postures were selected for comparison with previously reported young adult measurements (Holzbaur et al., 2007a; Holzbaur et al., 2007b). Therefore, our functional group classifications and results are limited to these specific postures. While different muscle compartments (e.g. anterior, middle, posterior deltoid) may play different mechanical roles (Ackland et al., 2008; Kuechle et al., 1997), compartments are not easily distinguished using MR. Therefore, we grouped compartments according to the whole muscle’s primary function (Kuechle et al., 1997) and electromyographic activity (Wickham et al., 2010) in the postures used to assess IJM.
Muscle moment arm, like MV, is an important determinant of strength and is posture dependant. Moment arms were not measured in this study. MR images were not obtained in IJM testing postures due to scanner size constraints. However, previous studies have shown that MV is a major determinant of strength variation (Akagi et al., 2009b; Fukunaga et al., 2001; Holzbaur et al., 2007a; Jones et al., 2008), and we postulate that age-related MV changes are more remarkable than moment arm changes. Variation of moment arm with age may be an area for future study.
Three degrees of freedom at the shoulder are used in activities of daily living (Kuechle et al., 2000). We observed relative weakness in shoulder abduction/adduction in older adults, but did not measure flexion or axial rotation due to concerns regarding participant burden and fatigue. Weakness in flexion or axial rotation could also have important functional implications and may be associated with the decreased MV reported here. Our group is currently investigating shoulder MV and IJM in 3 degrees of freedom in healthy and impaired older adults.
We investigated upper limb MV and IJM at the shoulder, elbow, and wrist joints in older adults and compared these data to measurements previously collected on younger adults. Our findings of reduced MV and IJM with notable differences at the shoulder show that older adults are not simply weaker younger adults, since declines are not uniform across functional groups. While volume was a significant predictor of IJM in older adults, variation in IJM accounted for by MV was half that of young adults. These data provide a foundation for exploring functional deficits in older adults from an experimental perspective and as a resource for developing simulation-based analyses reflecting older adult strength and muscle characteristics, which we have shown cannot be simply scaled from young adult characteristics.
Acknowledgments
The Wake Forest University Cross-campus Collaboration Research Fund and the Wake Forest University Science Research Fund provided funding for this work. This work was also supported in part by the Center for Biomolecular Imaging of Wake Forest School of Medicine. The work of Michael Miller, Anthony Marsh, and Katherine Saul was partially supported by the WFU Claude Pepper Older Americans Independence Center, National Institutes for Aging P30 AG021332.
Footnotes
Conflict of Interest Statement
None.
Publisher's Disclaimer: This is a PDF file of an unedited manuscript that has been accepted for publication. As a service to our customers we are providing this early version of the manuscript. The manuscript will undergo copyediting, typesetting, and review of the resulting proof before it is published in its final citable form. Please note that during the production process errors may be discovered which could affect the content, and all legal disclaimers that apply to the journal pertain.
References
- Ackland DC, Pak P, Richardson M, Pandy MG. Moment arms of the muscles crossing the anatomical shoulder. Journal of Anatomy. 2008;213 (4):383–390. doi: 10.1111/j.1469-7580.2008.00965.x. [DOI] [PMC free article] [PubMed] [Google Scholar]
- Akagi R, Takai Y, Kato E, Fukuda M, Wakahara T, Ohta M, Kanehisa H, Kawakami Y, Fukunaga T. Relationships between muscle strength and indices of muscle cross-sectional area determined during maximal voluntary contraction in middle-aged and elderly individuals. Journal of Strength and Conditioning Research. 2009a;23 (4):1258–1262. doi: 10.1519/JSC.0b013e3181918a9b. [DOI] [PubMed] [Google Scholar]
- Akagi R, Takai Y, Ohta M, Kanehisa H, Kawakami Y, Fukunaga T. Muscle volume compared to cross-sectional area is more appropriate for evaluating muscle strength in young and elderly individuals. Age and Ageing. 2009b;38 (5):564–569. doi: 10.1093/ageing/afp122. [DOI] [PubMed] [Google Scholar]
- Bazzucchi I, Felici F, Macaluso A, De Vito G. Differences between young and older women in maximal force, force fluctuations, and surface EMG during isometric knee extension and elbow flexion. Muscle & Nerve. 2004;30 (5):626–635. doi: 10.1002/mus.20151. [DOI] [PubMed] [Google Scholar]
- Clark BC, Manini TM. Functional consequences of sarcopenia and dynapenia in the elderly. Current Opinion in Clinical Nutrition and Metabolic Care. 2010;13 (3):271–276. doi: 10.1097/MCO.0b013e328337819e. [DOI] [PMC free article] [PubMed] [Google Scholar]
- Delmonico MJ, Harris TB, Visser M, Park SW, Conroy MB, Velasquez-Mieyer P, Boudreau R, Manini TM, Nevitt M, Newman AB, Goodpaster BH. Longitudinal study of muscle strength, quality, and adipose tissue infiltration. The American Journal of Clinical Nutrition. 2009;90 (6):1579–1585. doi: 10.3945/ajcn.2009.28047. [DOI] [PMC free article] [PubMed] [Google Scholar]
- Dey DK, Bosaeus I, Lissner L, Steen B. Changes in body composition and its relation to muscle strength in 75-year-old men and women: a 5-year prospective follow-up study of the NORA cohort in Goteborg, Sweden. Nutrition. 2009;25 (6):613–619. doi: 10.1016/j.nut.2008.11.023. [DOI] [PubMed] [Google Scholar]
- Ferrreira L, Gobbi S, Gobbi LT. An explanatory mechanism for the different decline in limb strength in older women. Archives of Gerontology and Geriatrics. 2009;49 (3):373–377. doi: 10.1016/j.archger.2008.12.002. [DOI] [PubMed] [Google Scholar]
- Frontera WR, Hughes VA, Fielding RA, Fiatarone MA, Evans WJ, Roubenoff R. Aging of skeletal muscle: a 12-yr longitudinal study. Journal of Applied Physiology. 2000;88 (4):1321–1326. doi: 10.1152/jappl.2000.88.4.1321. [DOI] [PubMed] [Google Scholar]
- Fukunaga T, Miyatani M, Tachi M, Kouzaki M, Kawakami Y, Kanehisa H. Muscle volume is a major determinant of joint torque in humans. Acta Physiologica Scandinavica. 2001;172 (4):249–255. doi: 10.1046/j.1365-201x.2001.00867.x. [DOI] [PubMed] [Google Scholar]
- Goodpaster BH, Carlson CL, Visser M, Kelley DE, Scherzinger A, Harris TB, Stamm E, Newman AB. Attenuation of skeletal muscle and strength in the elderly: The Health ABC Study. Journal of Applied Physiology. 2001;90 (6):2157–2165. doi: 10.1152/jappl.2001.90.6.2157. [DOI] [PubMed] [Google Scholar]
- Holm S. A simple sequentially rejective multiple test procedure. Scandinavian Journal of Statistics. 1979;6 (2):65–70. [Google Scholar]
- Holzbaur KR, Delp SL, Gold GE, Murray WM. Moment-generating capacity of upper limb muscles in healthy adults. Journal of Biomechanics. 2007a;40 (11):2442–2449. doi: 10.1016/j.jbiomech.2006.11.013. [DOI] [PubMed] [Google Scholar]
- Holzbaur KR, Murray WM, Gold GE, Delp SL. Upper limb muscle volumes in adult subjects. Journal of Biomechanics. 2007b;40 (4):742–749. doi: 10.1016/j.jbiomech.2006.11.011. [DOI] [PubMed] [Google Scholar]
- Hughes RE, Niebur G, Liu J, An KN. Comparison of two methods for computing abduction moment arms of the rotator cuff. Journal of Biomechanics. 1998;31 (2):157–160. doi: 10.1016/s0021-9290(97)00113-9. [DOI] [PubMed] [Google Scholar]
- Hughes VA, Frontera WR, Wood M, Evans WJ, Dallal GE, Roubenoff R, Fiatarone Singh MA. Longitudinal muscle strength changes in older adults: influence of muscle mass, physical activity, and health. The journals of gerontology Series A, Biological sciences and medical sciences. 2001;56 (5):B209–217. doi: 10.1093/gerona/56.5.b209. [DOI] [PubMed] [Google Scholar]
- Ikai M, Fukunaga T. Calculation of muscle strength per unit cross-sectional area of human muscle by means of ultrasonic measurement. Internationale Zeitschrift für Angewandte Physiologie, Einschliesslich Arbeitsphysiologie. 1968;26 (1):26–32. doi: 10.1007/BF00696087. [DOI] [PubMed] [Google Scholar]
- Janssen I, Heymsfield SB, Wang ZM, Ross R. Skeletal muscle mass and distribution in 468 men and women aged 18–88 yr. Journal of Applied Physiology. 2000;89 (1):81–88. doi: 10.1152/jappl.2000.89.1.81. [DOI] [PubMed] [Google Scholar]
- Janssen I, Ross R. Linking age-related changes in skeletal muscle mass and composition with metabolism and disease. Journal of Nutrition Health & Aging. 2005;9 (6):408–419. [PubMed] [Google Scholar]
- John EB, Liu W, Gregory RW. Biomechanics of muscular effort: age-related changes. Medicine and Science in Sports and Exercise. 2009;41 (2):418–425. doi: 10.1249/MSS.0b013e3181884480. [DOI] [PubMed] [Google Scholar]
- Jones EJ, Bishop PA, Woods AK, Green FM. Cross-sectional area and muscular strength: a brief review. Sports Medicine. 2008;38 (12):987–994. doi: 10.2165/00007256-200838120-00003. [DOI] [PubMed] [Google Scholar]
- Klein CS, Rice CL, Marsh GD. Normalized force, activation, and coactivation in the arm muscles of young and old men. Journal of Applied Physiology. 2001;91 (3):1341–1349. doi: 10.1152/jappl.2001.91.3.1341. [DOI] [PubMed] [Google Scholar]
- Koltzenburg M, Yousry T. Magnetic resonance imaging of skeletal muscle. Current Opinion in Neurology. 2007;20 (5):595–599. doi: 10.1097/WCO.0b013e3282efc322. [DOI] [PubMed] [Google Scholar]
- Kuechle DK, Newman SR, Itoi E, Morrey BF, An KN. Shoulder muscle moment arms during horizontal flexion and elevation. Journal of Shoulder and Elbow Surgery. 1997;6 (5):429–439. doi: 10.1016/s1058-2746(97)70049-1. [DOI] [PubMed] [Google Scholar]
- Kuechle DK, Newman SR, Itoi E, Niebur GL, Morrey BF, An KN. The relevance of the moment arm of shoulder muscles with respect to axial rotation of the glenohumeral joint in four positions. Clinical Biomechanics. 2000;15 (5):322–329. doi: 10.1016/s0268-0033(99)00081-9. [DOI] [PubMed] [Google Scholar]
- Landers KA, Hunter GR, Wetzstein CJ, Bamman MM, Weinsier RL. The interrelationship among muscle mass, strength, and the ability to perform physical tasks of daily living in younger and older women. The journals of gerontology Series A, Biological sciences and medical sciences. 2001;56 (10):B443–448. doi: 10.1093/gerona/56.10.b443. [DOI] [PubMed] [Google Scholar]
- Lin JC, Weintraub N, Aragaki DR. Nonsurgical treatment for rotator cuff injury in the elderly. Journal of the American Medical Directors Association. 2008;9 (9):626–632. doi: 10.1016/j.jamda.2008.05.003. [DOI] [PubMed] [Google Scholar]
- Lynch GS. Tackling Australia’s future health problems: developing strategies to combat sarcopenia--age-related muscle wasting and weakness. Internal medicine journal. 2004;34 (5):294–296. doi: 10.1111/j.1444-0903.2004.00568.x. [DOI] [PubMed] [Google Scholar]
- Lynch NA, Metter EJ, Lindle RS, Fozard JL, Tobin JD, Roy TA, Fleg JL, Hurley BF. Muscle quality. I. Age-associated differences between arm and leg muscle groups. Journal of Applied Physiology. 1999;86 (1):188–194. doi: 10.1152/jappl.1999.86.1.188. [DOI] [PubMed] [Google Scholar]
- Macaluso A, De Vito G. Muscle strength, power and adaptations to resistance training in older people. European Journal of Applied Physiology. 2004;91 (4):450–472. doi: 10.1007/s00421-003-0991-3. [DOI] [PubMed] [Google Scholar]
- Merletti R, Farina D, Gazzoni M, Schieroni MP. Effect of age on muscle functions investigated with surface electromyography. Muscle & Nerve. 2002;25 (1):65–76. doi: 10.1002/mus.10014. [DOI] [PubMed] [Google Scholar]
- Metter EJ, Conwit R, Tobin J, Fozard JL. Age-associated loss of power and strength in the upper extremities in women and men. The journals of gerontology Series A, Biological sciences and medical sciences. 1997;52 (5):B267–276. doi: 10.1093/gerona/52a.5.b267. [DOI] [PubMed] [Google Scholar]
- Narici MV, Bordini M, Cerretelli P. Effect of aging on human adductor pollicis muscle function. Journal of Applied Physiology. 1991;71 (4):1277–1281. doi: 10.1152/jappl.1991.71.4.1277. [DOI] [PubMed] [Google Scholar]
- Narici MV, Maffulli N. Sarcopenia: characteristics, mechanisms and functional significance. British medical bulletin. 2010 doi: 10.1093/bmb/ldq008. [DOI] [PubMed] [Google Scholar]
- Narici MV, Maganaris CN, Reeves ND, Capodaglio P. Effect of aging on human muscle architecture. Journal of Applied Physiology. 2003;95 (6):2229–2234. doi: 10.1152/japplphysiol.00433.2003. [DOI] [PubMed] [Google Scholar]
- Newman AB, Haggerty CL, Goodpaster B, Harris T, Kritchevsky S, Nevitt M, Miles TP, Visser M. Strength and muscle quality in a well-functioning cohort of older adults: the Health, Aging and Body Composition Study. Journal of the American Geriatrics Society. 2003;51 (3):323–330. doi: 10.1046/j.1532-5415.2003.51105.x. [DOI] [PubMed] [Google Scholar]
- Park SW, Goodpaster BH, Strotmeyer ES, Kuller LH, Broudeau R, Kammerer C, de Rekeneire N, Harris TB, Schwartz AV, Tylavsky FA, Cho YW, Newman AB. Accelerated loss of skeletal muscle strength in older adults with type 2 diabetes: the health, aging, and body composition study. Diabetes Care. 2007;30 (6):1507–1512. doi: 10.2337/dc06-2537. [DOI] [PubMed] [Google Scholar]
- Reimers CD, Harder T, Saxe H. Age-related muscle atrophy does not affect all muscles and can partly be compensated by physical activity: an ultrasound study. Journal of the Neurological Sciences. 1998;159 (1):60–66. doi: 10.1016/s0022-510x(98)00134-8. [DOI] [PubMed] [Google Scholar]
- Rosenberg IH. Summary comments. American Journal of Clinical Nutrition. 1989;50:1231–1233. [Google Scholar]
- Tingart MJ, Apreleva M, Lehtinen JT, Capell B, Palmer WE, Warner JJP. Magnetic resonance imaging in quantitative analysis of rotator cuff muscle volume. Clinical Orthopaedics and Related Research. 2003;(415):104–110. doi: 10.1097/01.blo.0000092969.12414.e1. [DOI] [PubMed] [Google Scholar]
- Valdez G, Tapia JC, Kang H, Clemenson GD, Jr, Gage FH, Lichtman JW, Sanes JR. Attenuation of age-related changes in mouse neuromuscular synapses by caloric restriction and exercise. Proceedings of the National Academy of Sciences of the United States of America. 2010;107 (33):14863–14868. doi: 10.1073/pnas.1002220107. [DOI] [PMC free article] [PubMed] [Google Scholar]
- Wickham J, Pizzari T, Stansfeld K, Burnside A, Watson L. Quantifying ‘normal’ shoulder muscle activity during abduction. Journal of Electromyography and Kinesiology. 2010;20 (2):212–222. doi: 10.1016/j.jelekin.2009.06.004. [DOI] [PubMed] [Google Scholar]
- Yamamoto A, Takagishi K, Osawa T, Yanagawa T, Nakajima D, Shitara H, Kobayashi T. Prevalence and risk factors of a rotator cuff tear in the general population. Journal of Shoulder and Elbow Surgery. 2010;19 (1):116–120. doi: 10.1016/j.jse.2009.04.006. [DOI] [PubMed] [Google Scholar]
- Yassierli, Nussbaum MA, Iridiastad H, Wojcik LA. The influence of age on isometric endurance and fatigue is muscle dependent: a study of shoulder abduction and torso extension. Ergonomics. 2007;50 (1):26–45. doi: 10.1080/00140130600967323. [DOI] [PubMed] [Google Scholar]
- Zajac FE. Muscle and tendon: properties, models, scaling, and application to biomechanics and motor control. Critical reviews in biomedical engineering. 1989;17 (4):359–411. [PubMed] [Google Scholar]