

Abstract
Background
This study characterizes the walking limitations of bariatric surgery candidates by age and body mass index (BMI) and determines factors independently associated with walking capacity.
Setting
Multi-institutional at research university hospitals in the United States.
Methods
2458 participants of the Longitudinal Assessment of Bariatric Surgery study (age: 18-78 y, BMI: 33-94 kg/m2) attended a pre-operative research visit. Walking capacity was measured via self-report and the 400 meter Long Distance Corridor Walk (LDCW).
Results
Almost two-thirds (64%) of subjects reported limitations walking several blocks, 48% had an objectively-defined mobility deficit, and 16% reported at least some walking aid use. In multivariable analysis, BMI, older age, lower income and greater bodily pain were independently associated (p<.05) with walking aid use, physical discomfort during the LDCW, inability to complete the LDCW, and slower time to complete the LDCW. Female sex, Hispanic ethnicity (but not race), higher resting heart rate, history of smoking, several comoribidities (history of stroke, ischemic heart disease, diabetes, asthma, sleep apnea, venous edema with ulcerations), and depressive symptoms were also independently related (p<.05) to at least one measure of reduced walking capacity.
Conclusions
Walking limitations are common in bariatric surgery candidates, even among the least severely obese and youngest patients. Physical activity counseling must be tailored to individuals' abilities. While several factors identified in this study (e.g., BMI, age, pain, comorbidities) should be considered, directly assessing walking capacity will facilitate appropriate goal-setting.
Keywords: mobility disability, walking capacity, functional limitation, body composition, severe obesity, bariatric surgery
Introduction
Walking is essential to performing many activities of daily living, such as doing light housework, crossing a street, and grocery shopping. In addition, walking limitations are a precursor to dependency in more basic activities of daily living, such as getting in or out of bed, bathing, and dressing.(1) Thus, walking is often prescribed to retain and improve physical function.(2) Walking is also promoted, especially among obese adults, as a practical and convenient way to meet national physical activity guidelines for health and weight loss.(3) However, walking capacity is often impaired as a direct consequence of obesity, through excess weight bearing, and reduced flexibility of movement. Obesity can also impact walking capacity indirectly via musculoskeletal pain,(4) destructive joint disease,(5;6) and loss of muscle mass due to the pro-inflammatory state associated with adiposity and related comorbidities.(5) Severe obesity (BMI ≥ 40 kg/m2) may magnify these problems, and contribute to additional problems such as increased friction from excess gluteal fat, and insufficient exercise capacity (VO2max) leading to rapid exhaustion, making walking even more difficult or unpleasant.(7;8)
An analysis from the Longitudinal Assessment of Bariatric Surgery (LABS)-1 study showed that inability to walk 200 feet (approximately 61 m) prior to surgery was independently associated with a more than doubling in the odds of a major adverse outcome within 30 days of surgery.(9) Similarly, McCullough and colleagues found that reduced cardiorespiratory fitness, which limits walking capacity, was associated with increased short-term post-surgical complications following Roux-en-Y Gastric Bypass (RYGB).(10) Limited walking capacity may also contribute to the low levels of physical activity among bariatric surgery candidates, the majority of whom are sedentary or insufficiently active.(11;12)
Over the last two decades functional limitations (i.e., restriction in basic movement ability) among obese adults appear to have increased,(13) perhaps due to the shift in weight distribution towards higher body mass index (BMI).(14) Several studies have shown that walking limitations(15) and declines in activities of daily living(16) are greater in adults with class 2 (BMI 35-<40 kg/m2) and severe obesity compared to adults with class 1 obesity (BMI 30-<35 kg/m2). However, little is known about the prevalence of walking limitations in bariatric surgery candidates, and in particular, what factors are related to reduced walking capacity. Therefore, this study describes self-reported and objectively-measured walking limitations of obese and severely obese adults preceding bariatric surgery by severity of obesity and by age group. In addition, this study identifies factors independently associated with walking aid use, physical discomfort from walking, inability to walk 400 meters, and 400 meter walk time. Finally, this study examines the contribution of walking limitations to variance in physical activity level.
Methods
Subjects
The Longitudinal Assessment of Bariatric Surgery (LABS-2) is an observational study designed to assess the risks and benefits of bariatric surgery.(17) Between February 1, 2006 and February 17, 2009 patients at least 18 years old seeking bariatric surgery by participating surgeons at ten locations throughout the United States were asked to participate if they had not had previous weight loss surgery. Of those consenting, 2458 participants proceeded to surgery before the end of recruitment. Within 30 days prior to scheduled surgery, participants attended a research visit. All centers had institutional review board approval and all participants provided informed consent. The study is registered at www.clinicaltrials.gov.
Measures
Self-reported walking ability
Participants self-reported ability to walk 200 feet (approximately 61 meters) and type and frequency of walking aid (cane, walker, scooter or wheel chair) use. They also self-reported walking limitations (walking one block, several blocks, and more than a mile) due to health as part of the Medical Outcomes Study 36-item Short-Form Health Survey, a widely used instrument with well-established validity and reliability.(18)
Objective walk test
Walking capacity was measured objectively with the 400 meter Long Distance Corridor Walk (LDCW).(19) Similar to the 6 Minute Walk Test (6MWT), the LDCW was developed to estimate exercise capacity as an alternative to treadmill testing in those unable to maintain pace or balance. Exclusion criteria were conservative because a physician could not be present during the LDCW to assess and treat symptomatic participants. Participants were ineligible for the LDCW if they had a contraindication to exertion defined as having any of several cardiovascular risk factors or needing a walking aid other than a straight cane. In addition, eligible participants who did not feel safe to attempt the LDCW could elect not to participate. A heart rate monitor (Polar Fitness Monitor, Model 60908; Polar Electro, Oy, Finland) was used to assess heart rate before the LDCW after a five minute seated rest, during the walk, and immediately following the walk while the participant remained upright. To minimize risk participants were instructed to walk the 400 meter course “at your usual pace” rather than as fast as they could, as has been done in other studies.(19) After 160 meters and 320 meters, coordinators asked participants how hard they were working. If they reported “hard” or “very hard,” they were reminded to “walk your usual pace without overexerting yourself.” In addition, participants were asked to slow down if their heart rate reached 135 beats per minute (bpm). Testing could be terminated for various safety reasons (e.g. heart rate remained at or above 135 bpm for more than five minutes, debilitating pain, syncope). Completion time and ending heart rate were recorded. At the end of the walk, participants were asked if they had experienced chest pain, shortness of breath, back, hip, knee or foot pain, muscle pain, numbness or tingling in legs or feet, or other symptoms during the LDCW, and whether they had any discomfort after stopping the LDCW. Participants were categorized as having a mobility deficit if they a) met LDCW exclusion criteria, indicating a contraindication to exertion, or refused to attempt the LDCW, b) met stopping criteria for the LDCW, or c) took more than seven minutes to complete the LDCW, which equates to a cardiorespiratory fitness level of <12mL O2/kg/min, the minimum level deemed necessary to cross a traffic intersection.(20)
Physical activity
Physical activity assessment in LABS-2 has been previously described.(12) Briefly, participants were asked to wear the StepWatch™ 3 Activity Monitor (SAM, OrthoCare Innovations, Washington, D.C.)(21) for up to seven days prior to surgery. Forty-six percent of participants were not given a Stepwatch due to lack of monitors (n=917) or fewer than three day between the pre-operative assessment and surgery (n=208).
Another 104 participants were excluded from physical activity assessment for other reasons (e.g., refused, use of a wheel chair). Step counts at the minute level were used to calculate mean daily steps and mean daily high cadence minutes, i.e., the number of minutes with more than 80 steps, for the 929 participants (76% of those given a monitor) who wore the monitor for at least ten hours per day for at least three days.
Body composition
Anthropometric measurements were made by trained personnel. Given the difficulty in identifying the narrowest point of the torso on adults with severe obesity, waist circumference (WC) was measured at the midpoint between the highest point of the iliac crest and lowest part of the costal margin in the mid-axillary line with a fiberglass retractable tape measure to the nearest tenth of a centimeter. Height in bare feet was measured to the nearest inch with a wall-mounted stadiometer. Weight, to the nearest pound, and percent body fat, to the nearest tenth of a percent, were measured with a calibrated Body Composition Analyzer (Tanita, Model TBF-310, Arlington Heights, Illinois), which has been validated in severely obese adults.(22) When a study scale was not available (n=388), weight was determined with a medical office scale and percent body fat was not assessed. Body mass index (BMI) was calculated as weight (kg) divided by height squared (m2). Fat mass was calculated as weight (kg) multiplied by percent body fat. Fat-free mass was calculated as weight minus fat mass. The fat-free-to-fat ratio was calculated as fat-free mass divided by fat mass.
Demographics and health
Age, sex, race, ethnicity, marital status, education, employment status, household income and smoking status were assessed by questionnaire. Resting heart rate, used as a proxy for cardiovascular fitness,(23) was measured after a minimum of five minutes seated rest. Chronic medical conditions and medication use were determined with a combination of self-report, clinical assessment and medical chart review. An index of comorbidity was created as the number of the following 10 comorbidities (range 0 ∼ 10): diabetes, hypertension, ischemic heart disease, congestive heart failure, history of stroke, sleep apnea, pulmonary hypertension, asthma, history of deep vein thrombosis or pulmonary embolism (DVT/PE), and venous edema with ulcerations.
Depressive symptoms were assessed with the Beck Depression Inventory (BDI), version 1.(24) BDI scores were used to categorize participants as not depressed (0-9), or having mild to moderate (10-18), moderate to severe (19-29) or severe (30-63) depressive symptoms. Functional health and well-being was assessed with the Medical Outcomes Study 36-item Short-Form Health Survey.(18) This analysis utilized the bodily pain and vitality subscale scores, as both might influence walking capacity. In addition, the physical functioning and role limitations due to physical problems subscales were utilized as descriptive measures of function. Norm-based methods were used to transform scores to a mean of 50 and standard deviations of 10, in the general U.S. population.(25) Higher scores imply less pain or better function.
Analysis
The statistical significance (p<0.05) of differences in walking limitations were assessed across BMI and age groups with the Mantel-Haenszel chi-square test for trend. The association between self-reported limitations walking several blocks and objectively-defined mobility deficit was tested with the Pearson's chi-square test for association. Multivariable logistic regression was used to determine factors significantly related to walking aid use. Characteristics of participants who were ineligible for the LDCW, elected not to participate, started but did not complete, and completed the LDCW were compared with Pearson's chi-square test for categorical variables and Kruskal-Wallis test for continuous variables. Among those who started the LDCW, multivariable logistic regression was used to identify factors significantly related to 1) physical discomfort during the LDCW and 2) inability to complete the LDCW. Among those who completed the LDCW, multivariable linear regression was used to identify factors significantly associated with the natural log of walk time (used in place of walk time to obtain normally distributed errors). Finally, multivariable linear regression was used to test the association between each walking limitation measure (walking aid use, inability to walk 200 feet, limitations walking a block, a few blocks, and a mile, and mobility disability) and physical activity among the subsample with valid physical activity data; the natural log of steps/day and high-cadence minutes/week were used to obtain normally distributed errors. Variables considered in all models were: age, sex (forced in all models), race, ethnicity, education, household income, marital status, severity of obesity, resting heart rate, smoking status, medical comorbidities, depressive symptoms, vitality, and pain. Height and change in heart rate were also considered in the model predicting walk time. Continuous variables were centered. To ascertain the significance of association of walking limitations with severity of obesity, separate models were run incorporating, as independent variables, various measures of adiposity: BMI, percent body fat, fat mass, fat-free-to-fat ratio, and WC. Also, in one set of models, the number of comorbidities was substituted for individual comorbidities. Two way interactions of sex, age, pain, vitality, and severity of obesity were evaluated. Independent variables were retained in the final model if the p-value testing whether the associated coefficient was equal to zero was <0.05. Data analyses were conducted using SAS, version 9.1 (SAS Institute Inc., Cary NC, 2000).
Results
Walking Limitations by BMI and Age Groups
While only 7% of participants reported the inability to walk 200 ft (approximately 61 m) unassisted, 16% reported at least some use of a walking aid, and 64% reported limitations walking several blocks. Almost half of participants (48%) had an objectively-defined mobility deficit. There was a significant (p<0.0001) trend with BMI group and with age group for each walking limitations measure (table 1), such that more obese and older adults reported more walking limitations compared to less obese and younger adults, respectively. However, walking limitations were common among all BMI and age groups; more than two-thirds of adults with a BMI less than 40 kg/m2 and almost three-fourths of adults 18-34 years old reported that their health limits walking more than a mile.
Table 1.
Walking Capacity of Adults undergoing Bariatric Surgery by BMI and Age Groups.
| Total | BMI groups | Age groups | ||||||
|---|---|---|---|---|---|---|---|---|
| (N=2458) | < 40 kg/m2 (N=356) | 40 to < 50 kg/m2 (N=1343) | 50 to < 60 kg/m2 (N=595) | ≥60 kg/m2 (N=164) | 18-<35 years (N=471) | 35-<55 years (N=1387) | 55 years (N=600) | |
| n (%) | n (%) | n (%) | n (%) | n (%) | n (%) | n (%) | n (%) | |
| Health limits… | ||||||||
| Walking one block, missing=211 | ||||||||
| Yes, limited a lot | 240 (10.7) | 20 (6.1) | 97 (7.9) | 78 (14.3) | 45 (29.8) a | 26 (6.0) | 116 (9.2) | 98 (17.8) a |
| Yes, limited a little | 617 (27.5) | 45 (13.7) | 313 (25.6) | 195 (35.8) | 64 (42.4) | 89 (20.7) | 352 (27.8) | 176 (31.9) |
| No, not limited at all | 1390 (61.9) | 263 (80.2) | 814 (66.5) | 271 (49.8) | 42 (27.8) | 315 (73.3) | 798 (63.0) | 277 (50.3) |
| Walking several blocks, missing=199 | ||||||||
| Yes, limited a lot | 667 (29.5) | 50 (15.2) | 302 (24.5) | 222 (40.7) | 93 (61.6) a | 90 (21.0) | 355 (27.8) | 222 (40.1) a |
| Yes, limited a little | 770 (34.1) | 109 (33.0) | 427 (34.6) | 192 (35.2) | 42 (27.8) | 155 (36.1) | 438 (34.3) | 177 (31.9) |
| No, not limited at all | 822 (36.4) | 171 (51.8) | 504 (40.9) | 131 (24.0) | 16 (10.6) | 184 (42.9) | 483 (37.9) | 155 (28.0) |
| Walking more than a mile, missing=205 | ||||||||
| Yes, limited a lot | 1003 (44.5) | 87 (26.6) | 495 (40.1) | 310 (57.1) | 111 (74.0) a | 130 (30.3) | 548 (43.0) | 325 (59.2) a |
| Yes, limited a little | 795 (35.3) | 144 (44.0) | 455 (36.9) | 163 (30.0) | 33 (22.0) | 183 (42.7) | 457 (35.8) | 155 (28.2) |
| No, not limited at all | 455 (20.2) | 96 (29.4) | 283 (23.0) | 70 (12.9) | 6 (4.0) | 116 (27.0) | 270 (21.2) | 69 (12.6) |
| Ability to walk 200 ft (61 m), missing=1 | ||||||||
| Can walk unassisted | 2275 (92.6) | 345 (96.9) | 1272 (94.8) | 531 (89.2) | 127 (77.4) a | 467 (99.2) | 1313 (94.7) | 495 (82.5) a |
| Can walk assisted | 151 (6.1) | 9 (2.5) | 61 (4.5) | 54 (9.1) | 27 (16.5) | 4 (0.8) | 60 (4.3) | 87 (14.5) |
| Cannot walk | 31 (1.3) | 2 (0.6) | 9 (0.7) | 10 (1.7) | 10 (6.1) | 0 (0.0) | 13 (0.9) | 18 (3.0) |
| Assistive device use | ||||||||
| Use walking aid, missing=219 | 368 (16.4) | 29 (8.9) | 158 (13.0) | 116 (21.4) | 65 (41.7) a | 15 (3.6) | 172 (13.6) | 181 (32.8) a |
| Wheelchair, missing=247 | 92 (4.2) | 7 (2.2) | 31 (2.6) | 31 (5.8) | 23 (15.6) | 5 (1.2) | 41 (3.3) | 46 (8.5) |
| Walker, missing=252 | 88 (4.0) | 7 (2.2) | 31 (2.6) | 26 (4.9) | 24 (16.3) | 5 (1.2) | 30 (2.4) | 53 (9.8) |
| Cane, missing=252 | 255 (11.6) | 22 (6.8) | 111 (9.2) | 84 (15.7) | 38 (25.9) | 9 (2.2) | 111 (8.9) | 135 (25.1) |
| Long distance corridor walk (LDCW) Status, missing=106 | ||||||||
| Ineligible | 312 (13.3) | 33 (9.7) | 138 (10.8) | 92 (16.1) | 49 (30.8) a | 34 (7.5) | 156 (11.7) | 122 (21.7) a |
| Elected not to participate | 356 (15.1) | 53 (15.6) | 194 (15.1) | 85 (14.9) | 24 (15.1) | 56 (12.3) | 207 (15.5) | 93 (16.6) |
| Stopped | 74 (3.1) | 4 (1.2) | 27 (2.1) | 29 (5.1) | 14 (8.8) | 7 (1.5) | 37 (2.8) | 30 (5.3) |
| Completed 400 meters | 1610 (68.5) | 250 (73.5) | 923 (72.0) | 365 (63.9) | 72 (45.3) | 359 (78.7) | 935 (70.0) | 316 (56.3) |
| Mobility deficit*, missing=106 | 1126 (47.9) | 132 (38.8) | 528 (41.2) | 334 (58.5) | 132 (83.0) a | 158 (34.7) | 606 (45.4) | 365 (64.5) a |
Mobility deficit defined as not able to complete the LDCW in seven or fewer minutes (includes those who were ineligible, elected not to participate or stopped the LDCW).
P < 0.001. Mantel-Haenszel Chi Square test for trend.
Kg=kilograms, m=meters, ft=feet
Self-reported vs. Objectively-Measured Walking Limitations
Self-reported limitation walking several blocks was significantly associated with objectively-defined mobility deficit (p<.0001); 72% of those who reported “limited a lot” had mobility deficit vs. 47% of those who reported “limited a little,” and 29% of those who reported “not limited.” However, these measures identified different people; 41% of those who self-reported limitations walking several blocks did not have an objectively-defined mobility deficit, and 29% of those who self-reported no limitations walking several blocks had an objectively-defined mobility deficit.
Walking Aid Use
In multivariable analysis, higher BMI and older age were both independently associated with higher odds of walking aid use (OR=2.11 per 10 kg/m2; p<.0001, OR=2.43 per 10 years; p<.0001), as was history of stroke (OR=3.41; p=.03), greater bodily pain (OR=1.66 per 10 point decrease in SF-36 pain score; p<.0001), and lower income (e.g., OR=7.99 for <$25,000 compared to ≥$100,000; p<.0001).
LDCW Screening Results
LDCW screening results are shown in Figure 1. Participant characteristics of those who were ineligible for (n=312), elected not to participate in (n=356), stopped (n=74), and completed the LDCW (n=1610) are shown in table 2. Adults who were ineligible for or stopped the LDCW tended to be older, less educated, had a higher BMI, more comorbidities, higher resting heart rate, more pain, worse physical function and worse physical-role scores, compared to those who completed the LDCW. Those who elected not to participate were similar to completers with regards to BMI and several health indicators. However, compared to completers, a higher proportion were black/African American and tended to be older, less educated, with a lower income, higher resting heart rate, more pain and worse physical function and physical-role scores.
Figure 1. Long Distance Corridor Walk Status.
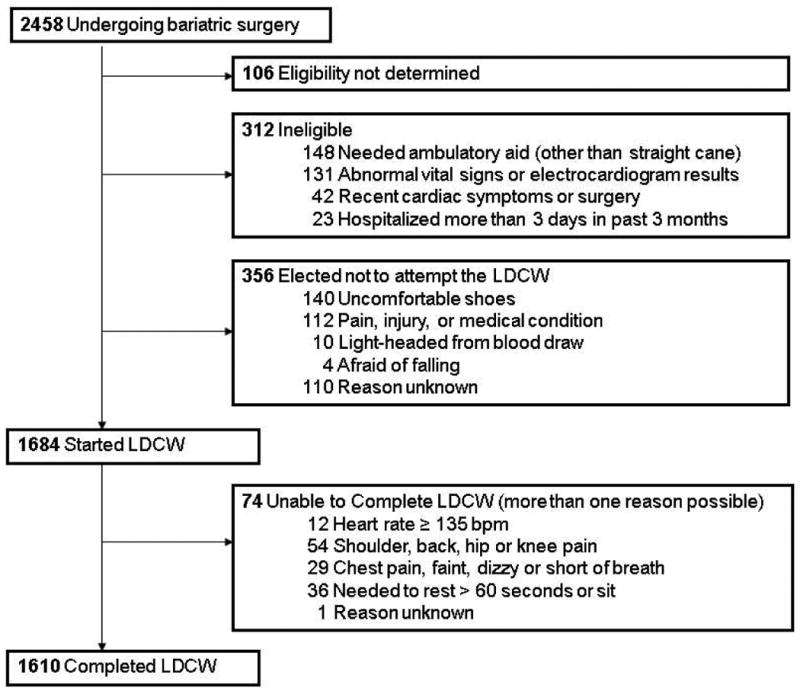
Table 2.
Characteristics of LABS-2 Participants by Long Distance Corridor Walk Status (N=2352).
| Total (N=2352) | Ineligible (N=312) | Refused (N=356) | Stopped (N=74) | Completed (N=1610) | ||
|---|---|---|---|---|---|---|
| Age (years) | 46.0 (37.0, 54.0) | 51.0 (42.0, 59.0) | 47.0 (38.0, 55.0) | 53.0 (46.0, 60.0) | 44.0 (36.0, 52.0) | d |
| Male, n (%) | 508 (21.6) | 78 (25.0) | 64 (18.0) | 8 (10.8) | 358 (22.2) | a |
| Race, missing=5, n (%) | a | |||||
| White | 2005 (85.4) | 258 (82.7) | 290 (81.7) | 65 (87.8) | 1392 (86.7) | |
| Black | 247 (10.5) | 40 (12.8) | 53 (14.9) | 7 (9.5) | 147 (9.2) | |
| Other | 95 (4.0) | 14 (4.5) | 12 (3.4) | 2 (2.7) | 67 (4.2) | |
| Hispanic, missing=1, n (%) | 115 (4.9) | 16 (5.1) | 8 (2.3) | 5 (6.8) | 86 (5.3) | |
| Education, missing=163, n (%) | b | |||||
| HS or less | 504 (23.0) | 76 (26.8) | 71 (21.8) | 21 (31.3) | 336 (22.2) | |
| Some college | 889 (40.6) | 124 (43.7) | 152 (46.8) | 26 (38.8) | 587 (38.8) | |
| College degree | 796 (36.4) | 84 (29.6) | 102 (31.4) | 20 (29.9) | 590 (39.0) | |
| Household income, missing=218, n (%) | d | |||||
| less than $25,000 | 384 (18.0) | 88 (32.2) | 66 (20.7) | 22 (33.3) | 208 (14.1) | |
| $25,000-$49,000 | 554 (26.0) | 76 (27.8) | 97 (30.4) | 14 (21.2) | 367 (24.9) | |
| $50,000-$74,999 | 509 (23.9) | 63 (23.1) | 80 (25.1) | 15 (22.7) | 351 (23.8) | |
| $75,000-$99,999 | 339 (15.9) | 27 (9.9) | 36 (11.3) | 8 (12.1) | 268 (18.2) | |
| $100,000 or more | 348 (16.3) | 19 (7.0) | 40 (12.5) | 7 (10.6) | 282 (19.1) | |
| Work for pay, missing=160, n (%) | 1514 (69.1) | 116 (40.8) | 222 (67.9) | 33 (49.3) | 1143 (75.5) | d |
| Married, missing=163, n (%) | 1404 (64.1) | 168 (58.4) | 203 (62.7) | 37 (54.4) | 997 (66.0) | a |
| Body mass index (kg/m2) | 45.9 (41.8, 51.4) | 48.8 (43.2, 55.8) | 46.1 (41.5, 51.3) | 51.5 (46.1, 57.0) | 45.3 (41.6, 50.5) | d |
| Body mass index (kg/m2), n (%) | d | |||||
| <40 | 340 (14.5) | 33 (10.6) | 53 (14.9) | 4 (5.4) | 250 (15.5) | |
| 40 to < 50 | 1282 (54.5) | 138 (44.2) | 194 (54.5) | 27 (36.5) | 923 (57.3) | |
| 50 to < 60 | 571 (24.3) | 92 (29.5) | 85 (23.9) | 29 (39.2) | 365 (22.7) | |
| ≥60 | 159 (6.8) | 49 (15.7) | 24 (6.7) | 14 (18.9) | 72 (4.5) | |
| Percent body fat, missing=388 | 51.2 (48.2, 53.9) | 52.1 (48.5, 55.0) | 52.2 (48.6, 54.7) | 52.9 (49.5, 55.5) | 50.9 (48.0, 53.5) | d |
| Fat mass (kg) | 64.7 (55.7, 76.2) | 69.5 (58.9, 85.5) | 67.1 (57.9, 79.1) | 72.7 (63.8, 85.5) | 63.8 (55.3, 74.0) | d |
| Fat-free mass (kg) | 62.1 (56.5, 71.4) | 65.3 (56.8, 76.4) | 62.1 (56.4, 70.3) | 63.9 58.9, 71.3) | 61.8 (56.5, 70.7) | a |
| Fat-free mass to fat mass | 1.0 (0.9, 1.1) | 0.9 (0.8, 1.1) | 0.9 (0.8, 1.1) | 0.9 (0.8, 1.0) | 1.0 (0.9, 1.1) | d |
| Waist circumference (cm), missing=121 | 130.9 (121.2, 143.0) | 137.0 (126.6, 150.0) | 130.3 (121.0, 142.0) | 134.5 (126.5, 147.5) | 129.8 (120.0, 141.0) | d |
| Resting heart rate (bpm), missing=21 | 78.0 (69.0, 86.0) | 79.0 (69.0, 89.0) | 80.0 (72.0, 87.0) | 82.0 (75.0, 88.0) | 77.0 (69.0, 85.0) | d |
| Smoking status, missing=4, n (%) | ||||||
| Never | 1314 (56.0) | 167 (53.7) | 196 (55.1) | 36 (48.6) | 915 (56.9) | |
| Former | 730 (31.1) | 110 (35.4) | 110 (30.9) | 26 (35.1) | 484 (30.1) | |
| Current/recent | 304 (12.9) | 34 (10.9) | 50 (14.0) | 12 (16.2) | 208 (12.9) | |
| # of comorbidities, missing=2, n (%) | ||||||
| 0 | 345 (14.7) | 20 (6.4) | 52 (14.6) | 1 (1.4) | 272 (16.9) | d |
| 1 | 604 (25.7) | 53 (17.0) | 95 (26.7) | 11 (14.9) | 445 (27.7) | |
| 2 | 648 (27.6) | 81 (26.0) | 98 (27.5) | 21 (28.4) | 448 (27.9) | |
| 3 | 452 (19.3) | 75 (24.0) | 66 (18.5) | 16 (21.6) | 295 (18.4) | |
| ≥ 4 | 301 (12.8) | 83 (26.6) | 45 (12.6) | 25 (33.8) | 148 (9.2) | |
| Depressive symptoms, missing=29, n (%) | b | |||||
| Not depressed | 1515 (65.2) | 171 (55.9) | 230 (67.3) | 37 (50.7) | 1077 (67.2) | |
| Mild-moderate | 621 (26.7) | 100 (32.7) | 85 (24.9) | 24 (32.9) | 412 (25.7) | |
| Moderate-severe | 162 (7.0) | 31 (10.1) | 22 (6.4) | 11 (15.1) | 98 (6.1) | |
| Severe | 25 (1.1) | 4 (1.3) | 5 (1.5) | 1 (1.4) | 15 (0.9) | |
| SF-36 Bodily Pain score, missing 195 | 39.6 (31.5, 48.5) | 35.4 (27.3, 39.6) | 35.4 (31.1, 44.3) | 35.4 (27.3, 39.6) | 40.0 (35.4, 49.4) | d |
| SF-36 Vitality score, missing 197 | 39.9 (32.7, 47.1) | 39.9 (30.3, 44.7) | 39.9 (32.7, 47.1) | 37.5 (30.3, 44.7) | 39.9 (32.7, 47.1) | b |
| SF-36 Physical Function score, missing 194 | 37.1 (28.4, 45.8) | 26.2 (19.6, 37.1) | 32.7 (25.2, 43.7) | 24.0 (21.8, 32.7) | 39.3 (30.6, 48.0) | d |
| SF-36 Physical Role score, missing 204 | 40.8 (26.0, 55.6) | 33.4 (26.0, 48.2) | 40.8 (26.0, 55.6) | 33.4 (26.0, 40.8) | 48.2 (33.4, 55.6) | d |
p < 0.05;
p < 0.01;
p < 0.001;
p < 0.001. Kruskal-Wallis one-way analysis of variance test for continuous variables (presented as median (quartiles)) and Pearson's Chi Square test for categorical variables (presented as n(%)).
Bpm= beats per minute, cm=centimeters, kg=kilogram, m=meters
Physical Discomfort during LDCW
Over half (n=941; 56%) of those who started the LDCW (n=1684) reported physical discomfort during the LDCW. Foot, knee or hip pain was the most common complaint (n=684; 41%), followed by shortness of breath (n=440; 26%), back pain (n=285; 17%), muscle pain (n=150; 9%), numbness or tingling in legs/feet (n=115; 7%), and chest pain (n=13; 1%). After controlling for bodily pain reported before the LDCW walk, higher BMI (OR=1.93 per 10 kg/m2; p<.0001), older age (OR=1.45 per 10 years; p<.0001), Hispanic ethnicity (OR=1.86; p=.02), lower household income (OR=1.50 for <$25,000; p=.02), having ever smoked (OR=1.35; p=.01), asthma (OR=1.89; p<.0001), ischemic heart disease (OR=1.73; p=.04), and moderate to severe depressive symptoms (OR=2.22 for BDI ≥19; p=.0031) were independently associated with higher odds of physical discomfort during the LDCW. Most symptoms resolved after stopping the LDCW. However, 6% (n=103) of those who started the LDCW reported discomfort following the LDCW; the most common complaints were joint or muscle pain (n=76; 5%) and shortness of breath (n=24; 1%)
Ability and Time to Complete LDCW
Nearly everyone (96%) who started the LDCW was able to complete it. Higher BMI (OR=3.09 per 10 kg/m2; p<.0001), older age (OR=2.42 per 10 years; p<.0001), female sex (OR=3.61; p<.0001), lower household income (OR=2.39 for <$25,000; p=.0045), higher resting heart rate (OR=1.33 per 10 bpm; p=.02), diabetes (OR=2.09; p.0096), venous edema with ulcerations (OR=2.28; p<.04), and more bodily pain (OR=1.75 per 10 point decrease in SF-36 pain score; p=.0005) were independently associated with higher odds of inability to complete the LDCW.
For those who completed the 400 meter LDCW (n=1610), the median completion time was six minutes (min), 13 seconds (s) (pace= 1.07 m/s). There was a 10 min range between the minimum and maximum times (three min 22 s to 13 min 22 s). 384 (24%) participants needed more than 7 minutes to walk 400 m. The best fit multivariable linear regression model predicting natural log of walk time is shown in table 3; a 10 point increase in BMI was independently associated with a 10% slower time and a 10 year increase in age was independently associated with a 4% slower time. More pain, a smaller change in heart rate, female sex, Hispanic ethnicity, lower household income, sleep apnea, asthma, diabetes and a history of stroke were also independently associated with slower time.
Table 3.
Factors Associated with Natural Log of LDCW Time (N=1452a).
| Beta (SE) | Model R2 | p value | % increase in timeb | |
|---|---|---|---|---|
| Intercept | 5.964 (0.021) | <.0001 | ||
| BMI (per 10 kg/m2) | 0.094 (0.006) | .09 | <.0001 | 10% |
| Age (10 years) | 0.038 (0.004) | .17 | <.0001 | 4% |
| Pain (per 10 points SF-36 score) | -0.023 (0.004) | .20 | <.0001 | 2% |
| Change in heart rate (per 10 bpm) | -0.023 (0.003) | .23 | <.0001 | 2% |
| Female | 0.048 (0.009) | .24 | <.0001 | 5% |
| Household income (ref ≥$50,000) | ||||
| <$25,000 | 0.048 (0.011) | .25 | <.0001 | 5% |
| $25,000-<$50,000 | 0.029 (0.009) | .25 | <.01 | 3% |
| Sleep apnea | 0.028 (0.008) | .26 | <.0001 | 3% |
| Asthma | 0.023 (0.009) | .26 | <.01 | 2% |
| Hispanic ethnicity | 0.043 (0.017) | .27 | .01 | 4% |
| Diabetes | 0.020 (0.008) | .27 | .02 | 2% |
| History of stroke | 0.093 (0.045) | .27 | .04 | 10% |
| Model R2=27 |
158 of 1610 participants who completed the LDCW were excluded from this analysis due to missing data points.
The percentage increase in completion time associated with each factor is calculated by taking the anti-log of Beta. Results for continuous variables are based on a change in the unit indicated next to each factor, e.g., 10 points for BMI, 10 years for age. To calculate the percentage increase in completion time associated with a multiple of that unit, multiply Beta before taking the anti-log. For example, a change in 30 BMI points is calculated as exp(0.094*3) = 1.33, or 33% increase.
kg=kilograms, m=meters, bpm=beats per minute, LDCW=Long Distance Corridor Walk, SF-36=Short Form-36.
Walking Limitations by Different Measures of Adiposity
Multivariable logistic regression models for walking aid use, physical discomfort and inability to complete the LDCW for which BMI was replaced as an independent variable by either percent body fat, fat mass, fat-free-to-fat ratio, or WC, were very similar; Hosmer-Lemeshow tests showed no evidence of lack of fit and predictive accuracy was the same for all models predicting physical discomfort (C-statistics=.77), and similar for all models predicting walking aid use (C-statistics=.87-.88) and inability to complete the LDCW(C-statistics=.86-.88). However, in multivariable linear regression, BMI explained 6-9% more of the variance in walk time than did other measures of adiposity. In all models, subsets of individual medical comorbidities explained a larger percentage of variance than did the index of comorbidities (data not shown).
Walking Limitations and Physical Activity
As previously reported, those with physical activity data were for the most part similar to those without.(12) However, fewer of those with physical activity data had severe walking limitations (e.g., inability to walk 200 feet, wheel chair use) per physical activity assessment exclusion criteria. Still, walking limitations were independently associated with physical activity parameters. Specifically, walking aid use was independently associated with 17% fewer steps/day (p<.0001) and 29% fewer high cadence minutes/day controlling for significant covariates. When other walking limitation measures replaced walking aid use in multivariable models, results were very similar (e.g., health limits ability to walk a mile was independently associated with 15% fewer steps/day (p<.0001) and 36% fewer high cadence minutes (p<.0001); objectively-defined mobility deficit was independently associated with 13% fewer steps/day (p<.0001) and 36% fewer high cadence minutes (p<.0001); data not shown).
Discussion
Walking Limitations
This study presents a grave profile of the walking capacity of bariatric surgery candidates, with four out of five participants reporting that their health limits their ability to walk more than a mile and the majority of participants who attempted to walk 400 meters reporting physical discomfort from walking at their usual pace. A major strength of this study is that it included both self-reported and objective measures of walking capacity. An advantage to objective assessment is it allows for a comparison among participants free from individual biases. In addition, because many adults do not walk regularly, they may be unaware of walking limitations, especially for distances of 400 m or longer.(26) However, self-reported walking limitations may reflect pain or difficulty with the challenges of walking in the community (e.g., uneven surfaces, inclines, obstacles, poor lighting, need to change directions) which are not always reflected in clinical tests. This may explain why close to two-thirds (64%) of participants self-reported limitations walking several blocks, while roughly half of participants (48%) exhibited evidence of mobility deficits as determined with the LDCW.
Given the conservative exclusion criteria, it was not surprising that 13% of participants were unable to participate in the LDCW. However, it was not anticipated that an even greater percentage of participants (15%) would elect not to attempt the LDCW. While several of the reasons participants reported were quite reasonable (e.g., afraid of falling), it is possible that the majority of these participants were capable of completing the LDCW safely but did not want to expend the effort or time, or experience anticipated physical discomfort. Nonetheless, it is noteworthy that almost a third (32%) of participants did not start or were unable to walk 400 meters at their usual walking pace on a straight, level, uncluttered, and well-lit walking course, and that an additional 16% of participants (n=384) could not complete the walk in 7 minutes or less, a risk factor for future “newly recognized” walking limitations in older adults.(20)
The median walking speed for LABS-2 participants who completed the walk was 1.07 m/s (or 2.4 mph), which is probably well over the walking pace at which moderate-intensity physical activity is achieved in this population(27) as walking elicits a higher physiologic response in obese and severely obese adults than in non-obese adults.(28) However, this median walking pace is considerably slower than reference values for age and sex group-specific “comfortable” walking speeds, which range from 1.27 m/s for women in their seventies to 1.46 m/s for men in their forties.(29) LABS-2 participants who completed the walk were slower, on average, than two other pre-surgical samples who completed the 6MWT; 25 RYGB patients had a mean walking pace of 1.15 m/s,(30) and 15 adjustable gastric band patients without musculoskeletal disorders had a mean walking pace of 1.32 m/s.(31) In contrast, a study of 17 adults undergoing RYGB who were recruited as consecutive patients, reported a similar mean walking pace (1.09 m/s)(32) during the 6MWT, as did a sample of 51 adults undergoing RYGB (pace=1.06 m/s).(33) However, comparisons across samples should be interpreted with caution given the differences between the walk tests (i.e., fixed distance at “usual” pace (LDCW) vs. fixed time “at your own pace to cover as much ground as possible” (6MWT)).
BMI and Other Measures of Adiposity
Within this obese sample, severity of obesity (whether measured by BMI, percent body fat, fat mass, fat-free-to-fat ratio or WC) was independently associated with self-report and objectively-defined walking limitations. While some studies have found that BMI and WC or other adiposity measures corresponded similarly to mobility disability,(34-36) several studies of older adults have found that WC out-performs BMI.(37-39) In this study, all measures performed similarly in models predicting walking aid use, discomfort during the LDCW, and inability to complete the LDCW, while BMI explained more of the variance in walk time compared to other measures of adiposity, and in fact was the most important predictor of walking time. However, it should be noted that to improve accuracy and comparability of measurements over time, in LABS-2 WC was measured at the midpoint between the highest point of the iliac crest and lowest part of the costal margin in the mid-axillary line, which is not the standard reference point in the field. In addition, percent body fat was measured via bioelectrical impedance which is not as precise as assessment of body density. Given the limited number of studies aimed at determining whether one body composition assessment is superior to others in explaining the relationship between excess adiposity and walking capacity, future work should continue to compare the utility of multiple measures.(40)
Age
This study sample, ranging in age from 18 to 78 years, enabled examination of walking limitations from young adulthood to older age. As expected, age was positively associated with walking limitations. However, many young bariatric candidates experience walking limitations generally associated with older age. For instance, almost three-fourths of 18-34 year olds reported limitations walking a mile, more than a third demonstrated an objectively-defined mobility deficit and 4% reported walking aid use.
Sex
Sex was not significantly associated with higher odds of walking aid use or reporting physical discomfort during the LDCW. However, women had a greater odds of inability to complete the LDCW (OR=3.61), and on average, took 5% longer to complete the LDCW than men, which is consistent with several studies of older adults showing a higher prevalence of walking limitations and slower gait speed in women than men.(29;37;41)
Race and Ethnicity
Although several studies have found a significant relationship between race and walking capacity, this study did not. However, Hispanic ethnicity was independently related to higher odds of physical discomfort during the LDCW and slower walk time. Further work should be done to determine if cultural differences between Hispanics and non-Hispanics might be responsible for a reporting bias with regards to reporting discomfort, or influencing how directions to walk at “usual pace” are interpreted, or whether there are other explanations for these findings.
Comorbidities
The index of comorbidities was significantly related to discomfort during the LDCW and all measures of walking capacity. However, models including specific comorbidities (history of stroke, ischemic heart disease, diabetes, asthma, sleep apnea, venous edema with ulcerations) performed slightly better than the index. These findings support the concept that various comorbidities may play a role in both feelings towards, and ability for, walking.
Pain
It is notable that over half (56%) of participants who started the LDCW reported physical discomfort from walking 400 meters or less when instructed to walk at their usual pace, given that they reported less baseline bodily pain compared to those who were ineligible or unwilling to attempt it. However, this finding is in line with a study using similar exclusion criteria for the 6MWT, which found that 58% of women (n= 133 women; 18-65 years) with severe obesity (mean BMI=40.7 kg/m2) reported physical complaints or discomforts from walking.(15) In both studies participants were asked to walk at their “usual” or at a “comfortable” walking pace. In addition, in this study, researchers asked participants to slow down if they reported working “hard” or if their heart rate reached 135 bpm. However, it is possible that some participants exerted themselves beyond their usual walking pace, leading to greater reporting of symptoms and discomfort.
Not surprisingly, higher bodily pain was significantly associated with higher odds of reporting discomfort during the LDCW. Higher bodily pain was also independently associated with increased odds of walking aid use, inability to complete the LDCW, and slower walking time. These findings are consistent with other studies relating pain to walking limitations in middle-age and older adults,(42-44) and underscore the importance of addressing pain when counseling patients to start a walking program or increase their physical activity level.
Walking limitations and physical activity
Walking limitations, whether characterized by walking aid use, self-reported inability to walk 200 feet, limitations walking a few blocks, or limitations walking a mile, or objectively-defined mobility deficit, were associated with fewer steps/day (i.e., total ambulatory physical activity), and fewer high-cadence minutes/week (i.e., moderate or vigorous intensity ambulatory physical activity. Walking limitations explained more variance in high-cadence minutes compared to steps, possibly reflecting the greater effect of walking limitations on ability to ambulate at a faster, compared to a slower, walking pace.
Implications for clinical care
Using pre-operative activity monitor data from LABS-2, we previously reported that 20% of participants (n=757; mean BMI=47.8 kg/m2) were sedentary (i.e., <5000 steps/day) and an additional 34% were low-active (i.e., 5000-7499 steps/day).(12) In addition, in a comparison of pre-op to post-op PA (n=310)(45) we found that 61 % of participants did not accumulate any 10-minute bouts of high-cadence minutes pre-operatively; in other words, during their physical activity assessment period they did not ambulate at a moderate or high intensity for at least 10 continuous minutes. Likewise, a recent study with accelerometer data from 38 bariatric surgery candidates found that most participants were inactive or insufficiently active (e.g., over two-thirds did not engage in any bouts of (moderate or vigorous physical activity (MVPA) and only 5% accumulated at least 150 minutes per week of MVPA).(11) Thus, there is a need for pre-operative physical activity counseling. Performing an assessment of walking capacity will provide the clinician with a starting point for physical activity recommendations(46) and provide the clinician with a better sense of the patients' risk-profile prior to surgery(9;10)
While this study found a significant association between self-reported walking limitations and objectively-determined mobility deficit, it should be noted that if only one of the two assessment methods were utilized, over a quarter of participants would not be recognized. Thus, when possible, using both subjective and objective assessment is worthwhile. Patients experiencing some level of limitations should be referred to physical therapy to help ensure that they are successful in their attempts to improve their walking capacity and increase their physical activity level.(30) Patients may need to work up to a walking routine by starting with alternative activities, such as chair-based or water-based exercises that are more tolerable.(46)
Limitations
A limitation of this study is that it is cross sectional precluding examination of whether excess adiposity was the cause or the effect of onset or worsening of walking limitations. In addition, we did not determine length of time that participants had been obese or severely obese, which might impact walking capacity(41) via increased number of years with greater wear and tear on the joints and weight-related comorbidities. As discussed above, anthropometric measurement methods (i.e. body fat via bioelectrical impedance) may have affected study findings. In addition, the time of day of the LDCW was not recorded so we were unable to test whether reporting of discomfort from walking differed by time of day. Finally, the generalizability of these results is limited to obese and severely obese adults seeking surgical treatment. However, it is likely that many of the factors associated with walking limitations in bariatric surgery candidates are also associated with walking limitations in other obese populations.
Conclusions
This study provides evidence that, as a group, bariatric surgery candidates experience compromised walking capacity, and highlights that within this population severity of obesity is associated with greater walking limitations. In addition, it is one of the first studies to show this relationship holds true among younger obese adults. The degree of impairment in younger adults and the most obese adults is particularly discouraging for a society that is experiencing both earlier onset of obesity and greater degrees of obesity than ever before.(14) Given the benefits of physical activity medical care providers should encourage all obese and severely obese patients to increase their physical activity level, including those proceeding to surgery. However, recommendations must be individualized to patients' abilities, especially when walking capacity is limited. Thus, routine assessment of walking capacity is indicated. Our findings suggest if walking capacity cannot be directly assessed, in addition to patient's age and BMI, exercise recommendations should be reflective of patients' bodily pain and comorbidities (in particular, history of stroke, ischemic heart disease, diabetes, asthma, sleep apnea, and venous edema with ulcerations) that may affect their walking capacity.
Acknowledgments
LABS personnel contributing to the study include:
Columbia University Medical Center, New York, NY: Paul D. Berk, MD, Marc Bessler, MD, Amna Daud, Harrison Lobdell IV, Jemela Mwelu, Beth Schrope, MD, PhD, Akuezunkpa Ude, MD Cornell University Medical Center, New York, NY: Michelle Capasso, BA, Ricardo Costa, BS, Greg Dakin, MD, Faith Ebel RD, MPH, Michel Gagner, MD, Jane Hsieh BS, Alfons Pomp, MD, Gladys Strain, PhD Mt. Sinai Medical Center, New York, NY: W. Barry Inabnet, MD East Carolina Medical Center, Greenville, NC: Rita Bowden, RN, William Chapman, MD, FACS, Lynis Dohm, PhD, John Pender MD, Walter Pories, MD, FACS Neuropsychiatric Research Institute, Fargo, ND: Jennifer Barker, MBA, Michael Howell, MD, Luis Garcia, MD, FACS, MBA, Kathy Lancaster, BA, Erika Lovaas, BS, James E. Mitchell, MD, Tim Monson, MD, Oregon Health & Science University: Chelsea Cassady, BS, Clifford Deveney, MD, Katherine Elder, PhD, Andrew Fredette, BA, Stefanie Greene, Jonathan Purnell, MD, Robert O'Rourke, Lynette Rogers, MD, Chad Sorenson, Bruce M. Wolfe, MD, Legacy Good Samaritan Hospital, Portland, OR: Emma Patterson, MD, Mark Smith, MD, William Raum, MD, Lisa VanDerWerff, PAC, Jason Kwiatkowski, PAC, Jamie Laut Med Sacramento Bariatric Medical Associates, Sacramento, CA: Iselin Austrheim-Smith, CCRP, Laura Machado, MD University of Pittsburgh Medical Center, Pittsburgh, PA: Chris Costa, BA Anita P. Courcoulas, MD, MPH, FACS, Jessie Eagleton, BS, George Eid, MD, William Gourash, MSN, CRNP, Lewis H. Kuller, MD, DrPH, Carol A. McCloskey, MD, Ramesh Ramanathan, MD, Rebecca Search, MPH, Eleanor Shirley, MA University of Washington, Seattle, WA: David E. Cummings, MD, E. Patchen Dellinger, MD, Hallie Ericson, BA, David R. Flum, MD, MPH, Katrina Golub, MPH, CCRC, Brant Oelschlager, MD, Skye Steptoe, MS, CCRC, Tomio Tran, Andrew Wright, MD Virginia Mason Medical Center, Seattle, WA: Lily Chang, MD, Stephen Geary, RN, Jeffrey Hunter, MD, Anne MacDougall, BA Ravi Moonka, MD, Olivia A. Seibenick, CCRC, Richard Thirlby, MD Data Coordinating Center, Graduate School of Public Health at the University of Pittsburgh, Pittsburgh, PA: Abi Adenijii, MS, Steven H. Belle, PhD, MScHyg, Lily (Jia-Yuh) Chen, MS, Michelle Fouse, BS, Jesse Hsu, MS, Wendy C. King, PhD, Kevin Kip, PhD, Kira Leishear, BS, Laurie Iacono, MFA, Debbie Martin, BA, Rocco Mercurio, MBA, Faith Selzer, PhD, Abdus Wahed, PhD National Institute of Diabetes and Digestive and Kidney Diseases: Mary Evans, Ph.D, Mary Horlick, MD, Carolyn W. Miles, PhD, Myrlene A. Staten, MD, Susan Z. Yanovski, MD National Cancer Institute: David E. Kleiner, MD, PhD
Source of support: This clinical study was a cooperative agreement funded by the National Institute of Diabetes and Digestive and Kidney Diseases (NIDDK). Grant numbers: DCC -U01 DK066557; Columbia - U01-DK66667 (in collaboration with Cornell University Medical Center CTSC, Grant UL1-RR024996); University of Washington - U01-DK66568 (in collaboration with CTRC, Grant M01RR-00037); Neuropsychiatric Research Institute - U01-DK66471; East Carolina University – U01-DK66526; University of Pittsburgh Medical Center – U01-DK66585 (in collaboration with CTRC, Grant UL1-RR024153); Oregon Health & Science University – U01-DK66555.
Footnotes
Publisher's Disclaimer: This is a PDF file of an unedited manuscript that has been accepted for publication. As a service to our customers we are providing this early version of the manuscript. The manuscript will undergo copyediting, typesetting, and review of the resulting proof before it is published in its final citable form. Please note that during the production process errors may be discovered which could affect the content, and all legal disclaimers that apply to the journal pertain.
Contributor Information
WC King, University of Pittsburgh, Graduate School of Public Health, Pittsburgh.
SG Engel, Neuropsychiatric Institute, Fargo.
KA Elder, Pacific University & Oregon Health and Science University, Portland.
WH Chapman, East Carolina Medical Center, Greenville.
GM Eid, University of Pittsburgh Medical Center, Pittsburgh.
BM Wolfe, Oregon Health and Science University, Portland.
SH Belle, University of Pittsburgh, Graduate School of Public Health, Pittsburgh.
References
- 1.Hirvensalo M, Rantanen T, Heikkinen E. Mobility difficulties and physical activity as predictors of mortality and loss of independence in the community-living older population. J Am Geriatr Soc. 2000;48:493–8. doi: 10.1111/j.1532-5415.2000.tb04994.x. [DOI] [PubMed] [Google Scholar]
- 2.Pisters MF, Veenhof C, van Meeteren NL, et al. Long-term effectiveness of exercise therapy in patients with osteoarthritis of the hip or knee: a systematic review. Arthritis Rheum. 2007;57:1245–53. doi: 10.1002/art.23009. [DOI] [PubMed] [Google Scholar]
- 3.CDC. U.S. department of health and human services. 2008 physical activity guidelines for americans. Atlanta, GA: Centers for Disease Control and Prevention (CDC), National Center for Chronic Disease Prevention and Health Promotion; 2008. pp. 6–17.pp. 2010 [Google Scholar]
- 4.Leboeuf-Yde C, Kyvik KO, Bruun NH. Low back pain and lifestyle. Part II--Obesity. Information from a population-based sample of 29,424 twin subjects. Spine (Phila Pa 1976) 1999;24:779–83. doi: 10.1097/00007632-199904150-00009. [DOI] [PubMed] [Google Scholar]
- 5.Felson DT, Lawrence RC, Dieppe PA, et al. Osteoarthritis: new insights. Part 1: the disease and its risk factors. Ann Intern Med. 2000;133:635–46. doi: 10.7326/0003-4819-133-8-200010170-00016. [DOI] [PubMed] [Google Scholar]
- 6.Sowers MR, Karvonen-Gutierrez CA. The evolving role of obesity in knee osteoarthritis. Curr Opin Rheumatol. 2010;22:533–7. doi: 10.1097/BOR.0b013e32833b4682. [DOI] [PMC free article] [PubMed] [Google Scholar]
- 7.Poirier P, Cornier MA, Mazzone T, et al. Bariatric surgery and cardiovascular risk factors: a scientific statement from the American Heart Association. Circulation. 2011;123:1683–1701. doi: 10.1161/CIR.0b013e3182149099. [DOI] [PubMed] [Google Scholar]
- 8.de Souza SA, Faintuch J, Valezi AC, et al. Gait cinematic analysis in morbidly obese patients. Obes Surg. 2005;15:1238–42. doi: 10.1381/096089205774512627. [DOI] [PubMed] [Google Scholar]
- 9.Flum DR, Belle SH, King WC, et al. Perioperative safety in the longitudinal assessment of bariatric surgery. N Engl J Med. 2009;361:445–54. doi: 10.1056/NEJMoa0901836. [DOI] [PMC free article] [PubMed] [Google Scholar]
- 10.McCullough PA, Gallagher MJ, Dejong AT, et al. Cardiorespiratory fitness and short-term complications after bariatric surgery. Chest. 2006;130:517–25. doi: 10.1378/chest.130.2.517. [DOI] [PubMed] [Google Scholar]
- 11.Bond DS, Jakicic JM, Vithiananthan S, et al. Objective quantification of physical activity in bariatric surgery candidates and normal-weight controls. Surg Obes Relat Dis. 2010;6:72–8. doi: 10.1016/j.soard.2009.08.012. [DOI] [PMC free article] [PubMed] [Google Scholar]
- 12.King WC, Belle SH, Eid GM, et al. Physical activity levels of patients undergoing bariatric surgery in the Longitudinal Assessment of Bariatric Surgery study. Surg Obes Relat Dis. 2008;4:721–8. doi: 10.1016/j.soard.2008.08.022. [DOI] [PMC free article] [PubMed] [Google Scholar]
- 13.Alley DE, Chang VW. The changing relationship of obesity and disability, 1988-2004. JAMA. 2007;298:2020–7. doi: 10.1001/jama.298.17.2020. [DOI] [PubMed] [Google Scholar]
- 14.Sturm R. Increases in morbid obesity in the USA: 2000-2005. Public Health. 2007;121:492–6. doi: 10.1016/j.puhe.2007.01.006. [DOI] [PMC free article] [PubMed] [Google Scholar]
- 15.Hulens M, Vansant G, Claessens AL, Lysens R, Muls E. Predictors of 6-minute walk test results in lean, obese and morbidly obese women. Scand J Med Sci Sports. 2003;13:98–105. doi: 10.1034/j.1600-0838.2003.10273.x. [DOI] [PubMed] [Google Scholar]
- 16.Jensen GL, Friedmann JM. Obesity is associated with functional decline in community-dwelling rural older persons. J Am Geriatr Soc. 2002;50:918–23. doi: 10.1046/j.1532-5415.2002.50220.x. [DOI] [PubMed] [Google Scholar]
- 17.Belle SH, Berk PD, Courcoulas AP, et al. Safety and efficacy of bariatric surgery: longitudinal assessment of bariatric surgery. Surg Obes Relat Dis. 2007;3:116–26. doi: 10.1016/j.soard.2007.01.006. [DOI] [PMC free article] [PubMed] [Google Scholar]
- 18.Ware JE, Jr, Sherbourne CD. The MOS 36-item short-form health survey (SF-36). I. Conceptual framework and item selection. Med Care. 1992;30:473–83. [PubMed] [Google Scholar]
- 19.Simonsick EM, Montgomery PS, Newman AB, Bauer DC, Harris T. Measuring fitness in healthy older adults: the Health ABC Long Distance Corridor Walk. J Am Geriatr Soc. 2001;49:1544–8. doi: 10.1046/j.1532-5415.2001.4911247.x. [DOI] [PubMed] [Google Scholar]
- 20.Simonsick EM, Newman AB, Visser M, et al. Mobility limitation in self-described well-functioning older adults: importance of endurance walk testing. J Gerontol A Biol Sci Med Sci. 2008;63:841–7. doi: 10.1093/gerona/63.8.841. [DOI] [PMC free article] [PubMed] [Google Scholar]
- 21.Boone DA, Coleman KL. Use of a step activity monitor in determining outcomes. J Prosthet Orthot. 2006;18:86–92. [Google Scholar]
- 22.Strain GW, Wang J, Gagner M, Pomp A, Inabnet WB, Heymsfield SB. Bioimpedance for severe obesity: comparing research methods for totoal body water and resting energy expenditure. Obesity (Silver Spring) 2008;16:1953–6. doi: 10.1038/oby.2008.321. [DOI] [PubMed] [Google Scholar]
- 23.American Heart Association. AHA Office of Group Practice Liaison. Dallas: American Heart Association, Inc; Internet. c2010 [updated 2011; cited Jun 10] [1 screen]. Available from: http://www.americanheart.org/presenter.jhtml?identifier=4701. [Google Scholar]
- 24.Beck AT, Ward CH, Mendelson M, Mock J, Erbaugh J. An inventory for measuring depression. Arch Gen Psychiatry. 1961;4:561–71. doi: 10.1001/archpsyc.1961.01710120031004. [DOI] [PubMed] [Google Scholar]
- 25.Ware JE, Jr, Kosinski M, Keller SK. SF-36® physical and mental health summary scales: a user's manual. Boston, MA: The Health Institute; 1994. [Google Scholar]
- 26.Brach JS, VanSwearingen JM, Newman AB, Kriska AM. Identifying early decline of physical function in community-dwelling older women: performance-based and self-report measures. Phys Ther. 2002;82:320–8. [PubMed] [Google Scholar]
- 27.King WC, Hames K, Goodpaster BH. BMI predicts walking speed at which moderate-intensity physical activity is achieved. MMSE. 2010;42:S514. [Google Scholar]
- 28.Mattsson E, Larsson UE, Rossner S. Is walking for exercise too exhausting for obese women? Int J Obes Relat Metab Disord. 1997;21:380–6. doi: 10.1038/sj.ijo.0800417. [DOI] [PubMed] [Google Scholar]
- 29.Bohannon RW. Comfortable and maximum walking speed of adults aged 20-79 years: reference values and determinants. Age Ageing. 1997;26:15–19. doi: 10.1093/ageing/26.1.15. [DOI] [PubMed] [Google Scholar]
- 30.Tompkins J, Bosch PR, Chenowith R, Tiede JL, Swain JM. Changes in functional walking distance and health-related quality of life after gastric bypass surgery. Phys Ther. 2008;88:928–35. doi: 10.2522/ptj.20070296. [DOI] [PubMed] [Google Scholar]
- 31.Maniscalco M, Zedda A, Giardiello C, et al. Effect of bariatric surgery on the six-minute walk test in severe uncomplicated obesity. Obes Surg. 2006;16:836–41. doi: 10.1381/096089206777822331. [DOI] [PubMed] [Google Scholar]
- 32.Josbeno DA, Jakicic JM, Hergenroeder A, Eid GM. Physical activity and physical function changes in obese individuals after gastric bypass surgery. Surg Obes Relat Dis. 2008;6:361–6. doi: 10.1016/j.soard.2008.08.003. [DOI] [PubMed] [Google Scholar]
- 33.de Souza SA, Faintuch J, Fabris SM, et al. Six-minute walk test: functional capacity of severely obese before and after bariatric surgery. Surg Obes Relat Dis. 2009;5:540–3. doi: 10.1016/j.soard.2009.05.003. [DOI] [PubMed] [Google Scholar]
- 34.Bannerman E, Miller MD, Daniels LA, et al. Anthropometric indices predict physical function and mobility in older Australians: the Australian Longitudinal Study of Ageing. Public Health Nutr. 2002;5:655–2. doi: 10.1079/PHN2002336. [DOI] [PubMed] [Google Scholar]
- 35.Koster A, Patel KV, Visser M, et al. Joint effects of adiposity and physical activity on incident mobility limitation in older adults. J Am Geriatr Soc. 2008;56:636–43. doi: 10.1111/j.1532-5415.2007.01632.x. [DOI] [PubMed] [Google Scholar]
- 36.Ramsay SE, Whincup PH, Shaper AG, Wannamethee SG. The relations of body composition and adiposity measures to ill health and physical disability in elderly men. Am J Epidemiol. 2006;164:459–69. doi: 10.1093/aje/kwj217. [DOI] [PubMed] [Google Scholar]
- 37.Angleman SB, Harris TB, Melze D. The role of waist circumference in predicting disability in periretirement age adults. Int J Obes (Lond) 2006;30:364–73. doi: 10.1038/sj.ijo.0803130. [DOI] [PubMed] [Google Scholar]
- 38.Chen H, Guo X. Obesity and functional disability in elderly Americans. J Am Geriatr Soc. 2008;56:689–94. doi: 10.1111/j.1532-5415.2007.01624.x. [DOI] [PMC free article] [PubMed] [Google Scholar]
- 39.Guallar-Castillon P, Sagardui-Villamor J, Banegas JR, et al. Waist circumference as a predictor of disability among older adults. Obesity (Silver Spring) 2007;15:233–44. doi: 10.1038/oby.2007.532. [DOI] [PubMed] [Google Scholar]
- 40.Vincent HK, Vincent KR, Lamb KM. Obesity and mobility disability in the older adult. Obes Rev. 2010;11:568–79. doi: 10.1111/j.1467-789X.2009.00703.x. [DOI] [PubMed] [Google Scholar]
- 41.Stenholm S, Rantanen T, Alanen E, Reunanen A, Sainio P, Koskinen S. Obesity history as a predictor of walking limitation at old age. Obesity (Silver Spring) 2007;15:929–38. doi: 10.1038/oby.2007.583. [DOI] [PubMed] [Google Scholar]
- 42.Newman AB, Haggerty CL, Kritchevsky SB, Nevitt MC, Simonsick EM. Walking performance and cardiovascular response: associations with age and morbidity--the Health, Aging and Body Composition Study. J Gerontol A Biol Sci Med Sci. 2003;58:715–20. doi: 10.1093/gerona/58.8.m715. [DOI] [PubMed] [Google Scholar]
- 43.Tsuritani I, Honda R, Noborisaka Y, Ishida M, Ishizaki M, Yamada Y. Impact of obesity on musculoskeletal pain and difficulty of daily movements in Japanese middle-aged women. Maturitas. 2002;42:23–30. doi: 10.1016/s0378-5122(02)00025-7. [DOI] [PubMed] [Google Scholar]
- 44.van der LM, Dahmen R, Ursum J, et al. Prediction of walking disability by disease-related factors in patients with rheumatoid arthritis. J Rehabil Med. 2010;42:506–10. doi: 10.2340/16501977-0551. [DOI] [PubMed] [Google Scholar]
- 45.King WC, Hsu JY, Belle SH, Courcoulas AP, Eid GM, Flum DR, et al. Pre- to Post-operative Changes in Physical Activity. doi: 10.1016/j.soard.2011.07.018. Report from the Longitudinal Assessment of Bariatric Surgery-2. Submitted to SOARD 2011. [DOI] [PMC free article] [PubMed] [Google Scholar]
- 46.Zunker C, King WC. Physical Activity Pre- and Post Bariatric Surgery. Psychosocial Assessment and Treatment of Bariatric Surgery Patients. London: Psychology Press and Routledge, part of the Taylor and Francis Group; 2011. [Google Scholar]