Abstract
Measures that quantify the relationship between two or more brain signals are drawing attention as neuroscientists explore the mechanisms of large-scale integration that enable coherent behavior and cognition. Traditional Fourier-based measures of coherence have been used to quantify frequency-dependent relationships between two signals. More recently, several off-line studies examined Phase-Locking Value (PLV) as a possible feature for use in brain-computer interface (BCI) systems. However, only a few individuals have been studied and full statistical comparisons among the different classes of features and their combinations have not been conducted. The present study examines the relative BCI performance of spectral power, coherence, and PLV, alone and in combination. The results indicate that spectral power produced classification at least as good as PLV, coherence, or any possible combination of these measures. This may be due to the fact that all three measures reflect mainly the activity of a single signal source (i.e., an area of sensorimotor cortex). This possibility is supported by the finding that EEG signals from different channels generally had near-zero phase differences. Coherence, PLV, and other measures of inter-channel relationships may be more valuable for BCIs that use signals from more than one distinct cortical source.
Keywords: Brain-Computer Interface, Sensorimotor Rhythms, Coherence, Phase-Locking Value
I. Introduction
Numerous studies over the past two decades show that scalp-recorded EEG activity can be the basis for non-muscular communication and control systems, commonly called brain-computer interfaces (BCIs) (Wolpaw et al., 2002). EEG-based communication systems measure specific features of EEG activity and use the results as control signals. Certain BCI systems use features in the frequency domain that are spontaneous in the sense that they are not dependent on specific sensory events (Wolpaw and McFarland, 2004). Appropriate feature extraction, which quantifies characteristics of brain signals that convey the user’s intentions, is extremely important for effective BCI operation.
Neuroscientists have recently become interested in mechanisms of large-scale integration that enable coherent behavior and cognition (e.g., (Varela et al., 2001). For this reason, measures that quantify the relationship between two or more brain signals are of interest. Traditionally Fourier-based measures of coherence have been used to quantify frequency-dependent relationships between two signals. More recently, it has been suggested that a measure of Phase Locking Value (PLV) might be better for this purpose as it is computationally faster and requires fewer data for a given time resolution (Gysels and Celka, 2004; Gysels et al., 2005).
Several studies have examined PLV as a possible feature for use in BCI systems. Brunner et al. (2005) documented changes in both spectral power and PLV in response to movement in the electrocorticographic (ECoG) activity of three individuals. Brunner et al. (2006) showed that three individuals could learn to control scalp recorded PLV by motor imagery to select one of three targets online. Subsequent offline analysis suggested that the combination of PLV and spectral power produced better classification than either class of features alone. (Wei et al., 2007) studied spectral power, PLV, and a non-linear amplitude locking measure (NLR). In three people, combinations of spectral amplitude and PLV or NLR produced better classification than any of the three feature classes alone. Gysels et al. (2004, 2005, 2007) compared PLV and power as EEG features for classifying imagery conditions in five individuals. Gysels and Celka (2004) found that a combination of PLV and spectral power classified better than either alone. Results across days and subjects were not always consistent. Gysels et al. (2005) report that narrow-band features classify better with spectral power, while broad-band features classify better with PLV. Gysels et al. (2007) also compared spectral power and PLV values with narrow- and broad-band features in a statistical analysis that apparently mixed days and subjects as sources of error variance. As in (Gysels et al., 2005), it is reported that narrow band features classify better with spectral power and broad band features classify better with PLV.
These promising initial studies suggest that features such as PLV may be useful for BCI systems. Thus, they provide the impetus for larger studies that gather data from more subjects and over multiple days, and apply full statistical analyses to compare the different feature classes and their combinations. Accordingly, the present study compares the utility of spectral power, coherence, and PLV in seven BCI users, each studied over 4 days. Furthermore, it compares the model performances on data sets acquired on days different from those used for model training.
II. Results
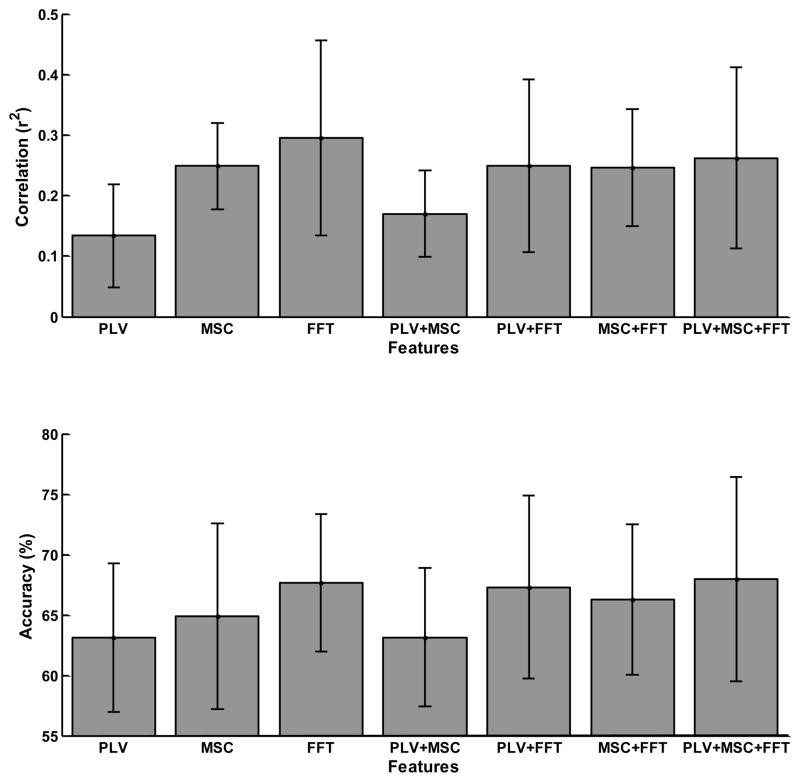
The results of the offline analysis comparing the seven models, representing each possible combination of spectral features (i.e., PLV, Fast Fourier Transform (FFT), and Magnitude-Squared Coherence (MSC)) are summarized in Figure 1. Each bar in the upper plot indicates r2 (i.e., the proportion of the variance of the feature for top and bottom targets accounted for by target position) for each of the seven models averaged over all users and each bar in the lower plot indicates the classification accuracy for each of the seven models averaged over all users.
Fig. 1.
Results of the offline analysis comparing the seven models, representing each possible combination of features. Each bar indicates the trial-averaged r2 (i.e. the proportion of the variance of the feature for top and bottom targets accounted for by target position) and classification accuracy, averaged across the seven users. The error bars indicate standard deviation. For reference, the online classification accuracy averaged across the users was 79.05±10.8%. This discrepancy with the offline results is largely due the online classifier adaptation, in addition to the different feature extraction approach and parameters used online.
Separate repeated measures analysis of variance (ANOVA) were performed on the r2 and accuracy using the factors: METHOD, and SESSION as factors and their interaction with USERS as error. Only the effect of SESSION for r2 was significant (p< 0.0004). A posthoc Tukey-Kramer test on METHOD indicated that the only significant differences (p<0.05) were that PLV performed significantly worse than all other methods except PLV+MSC, and that PLV+MSC performed significantly worse than FFT, PLV+FFT, and PLV+MSC+FFT. For accuracy, neither METHOD nor SESSION revealed a significant effect.
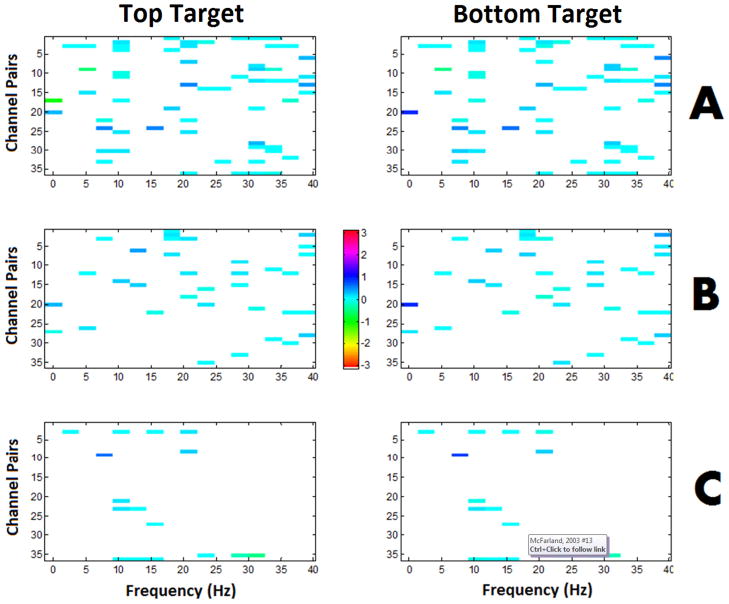
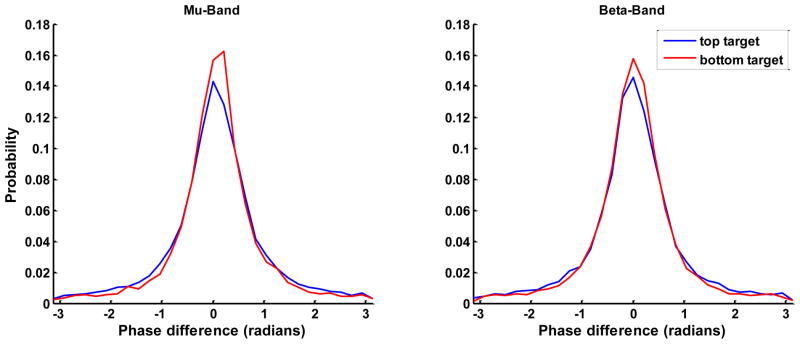
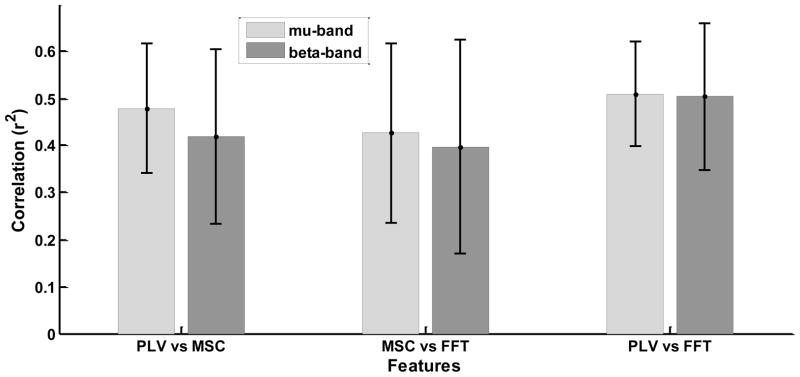
Figure 2 illustrates the average phase difference between channels for SWLDA selected features from a representative user for each method and target condition. Note that in the vast majority of cases the phase difference is near zero and is consistent across conditions. Although the average phase difference is consistent and near zero across conditions, the subtle difference in the phase distributions between conditions, as illustrated in Figure 3, is sufficient to produce discriminable PLV features. For each user, the mu- and beta- band feature that had the maximum r2 correlation with the target position were selected as the most prominent feature for each band. Figure 4 shows the r2 correlation between the most prominent features from each pair of feature extraction methods for the mu and beta bands, respectively. The channel pair and frequency defining these prominent features tended to be common across feature extraction methods, thus the same features were compared across methods.
Fig. 2.
The average phase difference between pairs of channels for SWLDA selected features from a representative user. The colorbar indicates the value of the phase difference. The left column represents the top target and the right column represents the bottom target. A. PLV features. B. MSC features. C. FFT-based spectral features. Note that in most cases the phase difference is near zero and is consistent across the top and bottom target conditions.
Fig. 3.
The phase difference distributions from a representative user. Each distribution was generated based on the most prominent mu- and beta-band feature from the SWLDA regression, respectively.
Fig. 4.
The r2 correlation between the most prominent features derived from each pair of feature extraction methods for the mu and beta bands, respectively. For each user, the mu- and beta- band feature that had the maximum r2 correlation with the target position were selected as the most prominent feature for each band. The channel pair and frequency defining these prominent features tended to be common across feature extraction methods, thus the same features were compared across methods. The results were averaged across users and the error bars indicate standard deviation.
III. Discussion
The results show that for both r2 and accuracy, the FFT-based magnitude difference was at least as effective in predicting target location as PLV and coherence features. Furthermore, inclusion of PLV and/or coherence in models with the FFT-based magnitude difference did not improve prediction above that for the FFT-based difference alone. This result suggests that, for the task and EEG channels used in this study, PLV and coherence-based features do not contain information that is different from that contained in the FFT-based magnitude features. This is also supported by the high correlations between the features produced by each method shown in Figure 4.
The present results lead us to a conclusion different from (Gysels and Celka, 2004) and (Brunner et al., 2006), which both report that the combination of PLV and spectral power features leads to better classification than either of these classes of features alone. This could be due to several factors. These previous studies (Gysels and Celka, 2004; Gysels et al., 2005; Gysels et al., 2007) had fewer subjects, each of whom appears to have provided the data for a number of analyses. Combining many analyses with few subjects increases the probability of findings that do not generalize well to other subjects. Methodological differences could also be involved. For example, the data used in the present study were collected in BCI users performing a cursor movement task with on-line feedback while the data used in (Gysels and Celka, 2004) involved imagination unspoken word generation. Feedback was not provided. The ECoG data presented in (Brunner et al., 2005) may have reflected multiple different cortical sources, while our data were probably dominated by a single source. However it is difficult to speculate why there results are different from the present results because they don’t describe the phase differences they found.
Our observation that signals recorded over motor areas generally have zero phase difference is consistent with the observations of others (Pockett et al., 2009; Uhlhaas et al., 2009). This could be due to volume conduction and/or to the fact that large (i.e., topographically extensive) sources are likely to dominate scalp-recorded activity. To the extent that near-zero phase synchronized activity is present across multiple recording sites, it would be expected to produce high phase-locking values. At the same time, it would appear that in this case simple spectral amplitude measures work at least as well for BCI purposes. This is probably due to the nature of sensorimotor rhythm de/synchronization. During synchronization, signal amplitude increases and, together with the observed zero-phase synchrony across channels, leads to increased phase-locking values, coherence, and spectral amplitudes. Conversely, during desynchronization, signal amplitude and signal-to-noise ratio decrease, and this also reduces phase-locking and coherence values (though only slightly). In sum, in the present BCI application, PLV, coherence, and simple spectral amplitude features are essentially capturing the same phenomenon. This is indicated by the regression model performance in Figure 1 and the high feature correlations in Figure 4.
Phase-locking and coherence features are likely to be of greater benefit when the recorded signals have non-zero phase synchrony. This would be the case if there were waves that travel across the surface of the scalp (e.g., (Alexander et al., 2006)) or perhaps when there is a relationship between activities in two distant sites (Varela et al., 2001). Neither of these conditions appears to be present in the present study, which focused entirely on data from sensorimotor cortex. Coherence and PLV may be of greater value when BCIs use activity from multiple different sources. While the present results suggest it is unlikely that useable phase or coherence features can be produced by a single source from the sensorimotor cortex, online feedback of these features was not provided. Online experiments are necessary to confirm whether users can learn to accurately modulate phase or coherence features from multiple sources within or in conjunction with the sensorimotor cortex.
IV. Methods and Materials
In one- and two-dimensional cursor control studies (McFarland et al., 2003; Wolpaw and McFarland, 2004), trained users are able to effectively modulate 8–12 Hz (μ band) and/or 18–26 Hz (β band) spectral components over sensorimotor cortex to move a cursor toward a randomly positioned target on a monitor. In the present study, data were collected from 7 able-bodied users (4 women and 3 men ranging in age from 28–56). Each user was trained on a simple one-dimensional two-target cursor control task, and EEG data were collected during task performance. The data were analyzed offline to examine the relationship and utility of amplitude, phase, and coherence features for the task. The study was approved by the New York State Department of Health Institutional Review Board, and each user gave informed consent.
A. One-Dimensional Cursor Control Task
For one-dimensional sensorimotor rhythm cursor control task, the users were presented with a target randomly positioned at the top or bottom of the right edge of the monitor as illustrated in Figure 5 (McFarland et al., 2003). The trial began with the cursor at the center of the left edge of the monitor. It moved at a constant rate toward the right, reaching the right side of the monitor in 2 sec. The user’s goal was to move the cursor vertically to hit the target using hand-motor imagery. A single 3-min run consisted of 32 trials, and 8 runs constituted a single session.
Fig. 5.
One-dimensional task trial structure. (1) The target and cursor are present on the screen for 1 s. (2) The cursor moves steadily across the screen for 2 s with its vertical movement controlled by the user. (3) If the user hits the target, the target flashes for 1.5 s. If the cursor misses the target, the screen is blank for 1.5 s. (4) The screen goes blank for a 1-s interval. (5) The next trial begins.
B. Data Collection and Feature Extraction
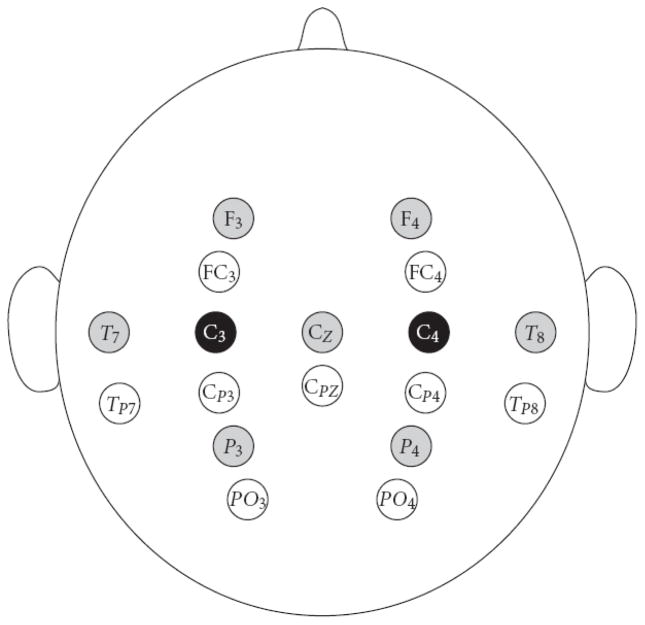
The details of the data collection and analysis are as follows. Using the BCI2000 general-purpose BCI software platform (Schalk et al., 2004), EEG activity was collected from 64 channels at standard locations distributed over the scalp (1991). All 64 channels were referenced to the right ear, bandpass filtered (0.1–60 Hz), and digitized at 160 Hz. A large Laplacian spatial filter was applied to the electrode over the right and/or left hand area of the sensorimotor cortex that was predetermined as optimal for each user based on analysis of prior sessions (see Figure 6 and Table I). The spectrum of the spatial-filtered signal was computed every 50 ms from the past 400 ms of data using a 16th-order AR model. A linear combination of 3-Hz bins at the predetermined μ-band and/or β-band center frequency was used as the online control feature. This linear combination of bins was adapted from trial to trial using the least-mean squares (LMS) algorithm (McFarland et al., 2006).
Fig 6.
The large Laplacian spatial filter configuration for the C3/C4 users. For an electrode over the hand area of the sensorimotor cortex (indicated in black), the signals from the four equidistant surrounding electrodes (indicated in gray) are averaged and subtracted from this central (black) electrode to produce the control signal. For offline analyses, the nine black or gray electrodes from both hemispheres were used for processing. For CP3/CP4 users, the nine white electrodes were used.
TABLE I.
Online Features
| User | Location | Freq. (Hz) |
|---|---|---|
| A | C3/C4 | 12 |
| B | C3/C4 | 22 |
| C | C3/C4 | 12 |
| D | C3/C4 | 12 |
| E | CP3/CP4 | 12 |
| F | C3/C4 | 12 |
| G | CP3/CP4 | 11 |
Table I lists, for each of the seven users, the predetermined central electrodes of the Laplacian spatial filter (International 10–20 System) and the frequencies used for the online experiments.
C. Offline Feature Extraction
The offline features were extracted using the raw signals from nine electrodes comprising the online large Laplacian spatial filter of the right and left hemisphere hand areas of the motor cortex, as predetermined to be optimal for each user based on analysis of prior sessions (see Figure 6 and Table I); however, note that a Laplacian filter was not applied to these raw signals for the offline analysis. The features were computed every 20 ms using the past 500 ms of data. This window size and overlap were selected to provide sufficient data for achieving an adequate coherence resolution, while allowing for the frequent cursor movements that are best for online BCI control. The data segments were zero-padded to length 256 and the Fast Fourier Transform (FFT) and Magnitude-Squared Coherence (MSC) between each pair of channels (36 combinations total) were computed for each segment, with the MSC defined as:
| (1) |
where Pxx(f) is the power spectral density for each of the two channels x = u and v, and Puv(f) is the cross power spectral density between the two channels. The MSC was computed using Welch’s averaged modified periodogram method (Hayes, 1996) with each data segment divided into eight equal sections having 50% overlap. The resulting MSC features were averaged over each trial. The FFT magnitude difference for each pair of channels was computed and averaged over each trial. The phase of the FFT was used to compute the PLV (Lachaux et al., 1999) for each trial as follows:
| (2) |
where θuv(f, t) is the phase difference between channels u and v for a given data segment and N is the number of phase observations over a trial. Thus, three types of spectral features were computed for each trial and pair of channels: the FFT representing the magnitude relationship; the PLV representing the phase relationship; and MSC representing the coherence between channels.
D. Feature Classification
The aforementioned features were extracted from four consecutive sessions (sessions 4–7) for each subject. To further reduce the feature space for analysis, adjacent frequency bins were averaged to produce 2.5-Hz frequency bins from 0–40 Hz, resulting in 576 features (36 channel pairs × 16 frequency bins) for each of the three feature extraction methods. Using the first session for each subject (i.e., session 4), combinations of features from each feature extraction method were used to construct seven linear regression models to predict the vertical target position: PLV, MSC, FFT, PLV+MSC, PLV+FFT, MSC+FFT, and PLV+MSC+FFT (i.e., the three different feature classes alone and their four different possible combinations). The model weights were determined using a stepwise linear discriminant analysis (SWLDA) (Draper and Smith, 1998) with entrance and exit tolerances of 0.1 and 0.15, respectively, and the size of the model limited to 60 features.
The models were tested using the three subsequent sessions (i.e., sessions 5–7) for each user and the predicted model outputs were correlated with the actual vertical target positions. Additionally, the classification accuracy of the model for predicting the target position was determined.
Highlights.
This study examines the performance of spectral power, coherence, and phase-locking value for controlling a brain-computer interface.
Results indicate that spectral power produced classification at least as good as PLV, coherence, or any possible combination of these measures.
This suggests that measures of inter-channel relationships may be more valuable for BCIs that use signals from more than one cortical source.
Acknowledgments
This work was supported in part by grants from NIH (HD30146 (NCMRR, NICHD) and EB00856 (NIBIB & NINDS)), NSF 1064912/0905468, and the James S. McDonnell Foundation.
Footnotes
Publisher's Disclaimer: This is a PDF file of an unedited manuscript that has been accepted for publication. As a service to our customers we are providing this early version of the manuscript. The manuscript will undergo copyediting, typesetting, and review of the resulting proof before it is published in its final citable form. Please note that during the production process errors may be discovered which could affect the content, and all legal disclaimers that apply to the journal pertain.
References
- 1.American Electroencephalographic Society guidelines for standard electrode position nomenclature. J Clin Neurophysiol. 1991;8:200–2. [PubMed] [Google Scholar]
- 2.Alexander DM, Trengove C, Wright JJ, Boord PR, Gordon E. Measurement of phase gradients in the EEG. J Neurosci Methods. 2006;156:111–28. doi: 10.1016/j.jneumeth.2006.02.016. [DOI] [PubMed] [Google Scholar]
- 3.Brunner C, Graimann B, Huggins JE, Levine SP, Pfurtscheller G. Phase relationships between different subdural electrode recordings in man. Neuroscience Letters. 2005;375:69–74. doi: 10.1016/j.neulet.2004.11.052. [DOI] [PubMed] [Google Scholar]
- 4.Brunner C, Scherer R, Graimann B, Supp G, Pfurtscheller G. Online control of a brain-computer interface using phase synchronization. Ieee Transactions on Biomedical Engineering. 2006;53:2501–2506. doi: 10.1109/TBME.2006.881775. [DOI] [PubMed] [Google Scholar]
- 5.Draper NR, Smith H. Applied regression analysis, Vol. Wiley; New York: 1998. [Google Scholar]
- 6.Gysels E, Celka P. Phase synchronization for the recognition of mental tasks in a brain-computer interface. IEEE Trans Neural Syst Rehabil Eng. 2004;12:406–15. doi: 10.1109/TNSRE.2004.838443. [DOI] [PubMed] [Google Scholar]
- 7.Gysels E, Renevey P, Celka P. SVM-based recursive feature elimination to compare phase synchronization computed from broadband and narrowband EEG signals in Brain-Computer Interfaces. Signal Processing. 2005;85:2178–2189. [Google Scholar]
- 8.Gysels E, Renevey P, Celka P. Fast feature selection to compare broadband with narrowband phase synchronization in brain-computer interfaces. Methods Inf Med. 2007;46:160–3. [PubMed] [Google Scholar]
- 9.Hayes MH. Statistical digital signal processing and modeling, Vol. John Wiley & Sons; New York: 1996. [Google Scholar]
- 10.Lachaux JP, Rodriguez E, Martinerie J, Varela FJ. Measuring phase synchrony in brain signals. Hum Brain Mapp. 1999;8:194–208. doi: 10.1002/(SICI)1097-0193(1999)8:4<194::AID-HBM4>3.0.CO;2-C. [DOI] [PMC free article] [PubMed] [Google Scholar]
- 11.McFarland DJ, Sarnacki WA, Wolpaw JR. Brain-computer interface (BCI) operation: optimizing information transfer rates. Biol Psychol. 2003;63:237–51. doi: 10.1016/s0301-0511(03)00073-5. [DOI] [PubMed] [Google Scholar]
- 12.McFarland DJ, Krusienski DJ, Wolpaw JR. Brain-computer interface signal processing at the Wadsworth Center: mu and sensorimotor beta rhythms. Progress in brain research. 2006;159:411–9. doi: 10.1016/S0079-6123(06)59026-0. [DOI] [PubMed] [Google Scholar]
- 13.Pockett S, Bold GE, Freeman WJ. EEG synchrony during a perceptual-cognitive task: widespread phase synchrony at all frequencies. Clin Neurophysiol. 2009;120:695–708. doi: 10.1016/j.clinph.2008.12.044. [DOI] [PubMed] [Google Scholar]
- 14.Schalk G, McFarland DJ, Hinterberger T, Birbaumer N, Wolpaw JR. BCI2000: a general-purpose brain-computer interface (BCI) system. IEEE Trans Biomed Eng. 2004;51:1034–43. doi: 10.1109/TBME.2004.827072. [DOI] [PubMed] [Google Scholar]
- 15.Uhlhaas PJ, Roux F, Singer W, Haenschel C, Sireteanu R, Rodriguez E. The development of neural synchrony reflects late maturation and restructuring of functional networks in humans. Proc Natl Acad Sci U S A. 2009;106:9866–71. doi: 10.1073/pnas.0900390106. [DOI] [PMC free article] [PubMed] [Google Scholar]
- 16.Varela F, Lachaux JP, Rodriguez E, Martinerie J. The brainweb: phase synchronization and large-scale integration. Nat Rev Neurosci. 2001;2:229–39. doi: 10.1038/35067550. [DOI] [PubMed] [Google Scholar]
- 17.Wei QG, Wang YJ, Gao XR, Gao SK. Amplitude and phase coupling measures for feature extraction in an EEG-based brain-computer interface. Journal of Neural Engineering. 2007;4:120–129. doi: 10.1088/1741-2560/4/2/012. [DOI] [PubMed] [Google Scholar]
- 18.Wolpaw JR, Birbaumer N, McFarland DJ, Pfurtscheller G, Vaughan TM. Brain-computer interfaces for communication and control. Clin Neurophysiol. 2002;113:767–91. doi: 10.1016/s1388-2457(02)00057-3. [DOI] [PubMed] [Google Scholar]
- 19.Wolpaw JR, McFarland DJ. Control of a two-dimensional movement signal by a noninvasive brain-computer interface in humans. Proc Natl Acad Sci U S A. 2004;101:17849–54. doi: 10.1073/pnas.0403504101. [DOI] [PMC free article] [PubMed] [Google Scholar]


