Abstract
Background
Strong electrical shocks can cause focal arrhythmias, the mechanism of which is not well known. As shown previously, strong shocks produce diastolic Cai2+ increase, which may initiate focal arrhythmias via spontaneous Cai2+ rise (SCR), activation of inward Na+-Ca2+ exchange current (INCX), and rise in membrane potential (Vm). It can be hypothesized that this mechanism is responsible for generation of shock-induced arrhythmias.
Objective
To examine the roles of SCRs and INCX in shock-induced arrhythmias.
Methods and Results
The occurrence of SCRs during shock-induced arrhythmias was assessed in neonatal rat myocyte cultures. Simultaneous Vm-Cai2+ optical mapping at arrhythmia source demonstrated that Vm upstrokes always preceded Cai2+ transients, and Vm-Cai2+ delays were not different between arrhythmic and paced beats (5.5±0.9 and 5.7±0.4 ms, respectively, p=0.5). Shocks caused gradual rise of diastolic Cai2+ consistent with membrane electroporation but no significant Cai2+ rises immediately before Vm upstrokes. Application of Cai2+ chelator BAPTA-AM (10 µmol/L) decreased the duration of shock-induced arrhythmias whereas application of INCX inhibitor KB-R7943 (2 µmol/L) increased it indicating that, despite the absence of SCRs, changes in Cai2+ affected arrhythmias. It is hypothesized that this effect is mediated by Cai2+ inhibition of outward IK1 current and destabilization of resting Vm. Possible IK1 role was supported by application of IK1 inhibitor BaCl2 (0.2 mmol/L), which increased the arrhythmia duration.
Conclusions
Shock-induced arrhythmias in neonatal rat myocyte monolayers are not caused by spontaneous Cai2+ rises and inward INCX. However, these arrhythmias depend on Cai2+ changes, possibly via Cai2+–dependent modulation of outward IK1 current.
Keywords: defibrillation, membrane potential, intracellular calcium, optical mapping
INTRODUCTION
Defibrillation is currently the only reliable method to halt life-threatening ventricular fibrillation (VF),1 but electrical shocks may cause adverse effects including pain, tissue damage, decreased cardiac output, and arrhythmias.2,3 This last effect is important because arrhythmias may cause VF re-initiation4,5 or induction of atrial fibrillation.6 The ionic mechanism of shock-induced arrhythmias is not well known. It has been shown that strong shocks may cause membrane electroporation,7,8 which can potentially lead to arrhythmias via two different ionic mechanisms. In one mechanism, arrhythmias are caused by increase in membrane conductance9 and inward flow of a non-specific leakage current. This current may elevate diastolic Vm,10–12 bringing it toward activation threshold and causing premature action potentials and arrhythmias.
In the other mechanism, arrhythmias may be caused by shock-induced increase of diastolic intracellular calcium concentration (Cai2+ overload).11,13 It is well established that Cai2+ overload can be arrhythmogenic, and it is considered one of the main causes of focal arrhythmias. A common scenario for development of such arrhythmias involves Vm-independent rise of Cai2+ due to spontaneous calcium release from the sarcoplasmic reticulum, followed by activation of a transient inward current, which causes Vm elevation, abnormal action potentials, and arrhythmias.14 The most likely candidate for the role of the transient inward current is the Na+-Cai2+ exchange (NCX) current.15,16 The singular feature of this arrhythmic mechanism is the spontaneous Cai2+ rise (SCR) which precedes or coincides with the rise in Vm. Such SCRs were observed in several animal models of arrhythmias,17–20 but the role of this mechanism in shock-induced arrhythmias remains unknown.
The main purpose of this study was to use simultaneous optical mapping of Vm and Cai2+ to examine the role of spontaneous Cai2+ rises in a cell culture model of shock-induced arrhythmias,7,10 which allows localization of the arrhythmia source. In addition, channel inhibitors were used to assess the roles of ion currents in these arrhythmias.
METHODS
Cell cultures
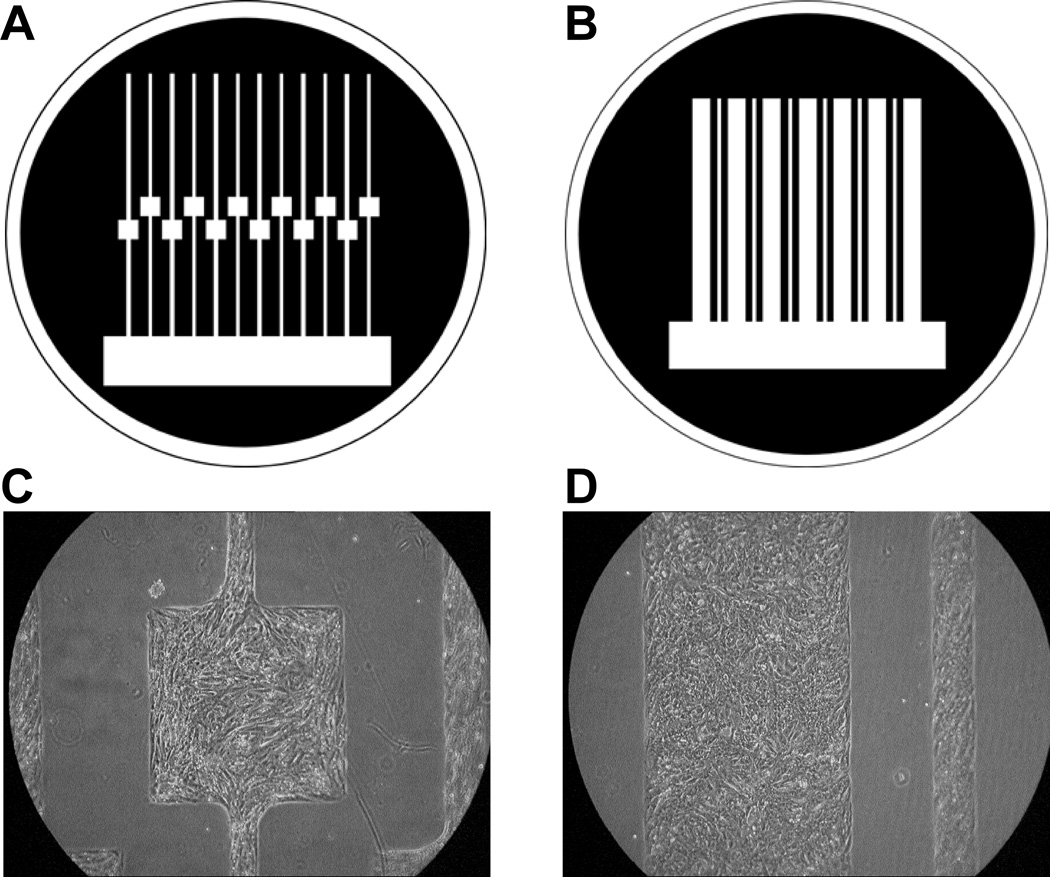
The research protocol was approved by the Institutional Animal Care and Use Committee. Patterned growth substrates for cell strands with defined geometries were fabricated using previously published procedures.21 Two types of growth patterns were used: 0.15-mm wide strands containing square 0.8-mm wide expansions (Figure 1A), and linear 0.8-mm wide strands (Figure 1B). Primary cardiomyocytes were obtained from 1- to 2-day old Sprague-Dawley rats (Harlan) according to previously published procedures.22 Cells were grown in Ultraculture serum-free medium (BioWhittaker) supplemented with antibiotics, 2 µg/ml vitamin B12, 0.5 µmol/L epinephrine, and 0.1 mol/L bromodeoxyuridine, and incubated at 37°C in a humidified atmosphere containing 4.5% CO2. Medium was exchanged the day after culture preparation and every second day thereafter. Experiments were performed between 3 and 10 days in culture.
Figure 1.
Preparation of patterned growth cell cultures. A–B, Photolithographic masks used for patterned growth. The first (A), consisted of narrow strands (width=0.15 mm) containing an area of local expansion (width=0.8 mm); the second (B), consisted of linear cell strands with widths of 0.2 and 0.8 mm. Areas of cell growth are shown in white. C–D, Examples of patterned cultures of neonatal rat ventricular myocytes.
Optical mapping of Vm and Cai2+ at the arrhythmia source
These experiments were performed in narrow strands with square expansions (Figure 1C), which allowed mapping and localization of the arrhythmia source.10 Vm and Cai2+ changes were measured using an optical mapping technique described previously23 with some modifications. Cells were double-stained with Vm-sensitive dye RH-237 and Cai2+-sensitive dye Rhod-2 or Fluo-3. First, cells were stained with either 2.5 µmol/L of Rhod-2 for 40 minutes or 5 µmol/L of Fluo-3 for one hour in the incubator. To enhance Fluo-3 retention, 1 mmol/L probenecid was added to the Hanks solution.23 Then, monolayers were transferred to an experimental chamber, superfused with Hanks solution (Sigma) with pH of 7.4 and temperature of 35–36°C, and stained with 4 µmol/L of RH-237 for 6 minutes. Rhod-2 and Fluo-3 are high-affinity dyes that overestimate the duration of Cai2+ transients in cell cultures.13 They were used instead of their low-affinity analogs because simultaneous Vm-Cai2+ measurements with low-affinity dyes resulted in low signal-to-noise ratio. The main focus in the present study was on the relationship between Vm and Cai2+ upstrokes. As shown previously,13 the timing of Cai2+ upstroke is unaffected by dye affinity.
Fluorescence was measured using two 16×16-element photodiode arrays (Hamamatsu) and a microscopic mapping system22 with spatial resolution of 110 µm/diode. For the Rhod-2/RH-237 dye combination, fluorescence was excited using a 200-W Hg/Xe lamp at 530/40 nm and measured at 580/40 nm (Rhod-2) and >710 nm (RH-237). For the Fluo-3/RH-237 dye combination, fluorescence was excited at 530/40 nm and measured at 580/40 nm (Fluo-3) and >680 nm (RH-237). Initial measurements were performed with the Rhod-2/RH-237 dye combination. Such recordings had excellent Cai2+ signal quality but rather low Vm signal-to-noise ratio. Therefore, subsequent measurements were performed using the Fluo-3/RH-237 combination, for which signal quality was similar for Vm and Cai2+ signals.
To reduce dye bleaching and phototoxicity, Vm-Cai2+ recordings were limited to 1-sec duration. Cells were paced at a cycle length of 500 ms. A control optical recording was taken without shock application to check for absence of spontaneous activity. In such quiescent strands, rectangular uniform-field shocks with 10-ms duration were delivered via two platinum plate electrodes. The field strength (E) was measured using a bipolar electrode. Shock delivery was synchronized with stimulation pulses. Because shocks occur during different phases of action potentials in different parts of cell strands, the effect of shock timing on arrhythmia induction was examined by applying shocks with strength of ~38 V/cm with coupling intervals of 30, 80, 130, 230, and 430 ms in 6 linear cell strands from 3 monolayers. Results showed that arrhythmia duration for longer coupling intervals did not differ from that for the 30-ms interval (data not shown). Therefore, the 30-ms coupling interval was used in all experiments, which resulted in the AP-shock delay of 15–25 ms. Shocks were applied with a strength just above the arrhythmia induction threshold (E~20–35 V/cm) because such shocks produced arrhythmias with a relatively long cycle length, which reduced interference from motion artifact in analysis of Vm-Cai2+ relationships during arrhythmic beats. Only those arrhythmic episodes were analyzed in which the earliest activation site was inside the expansion area. AP and Cai2+ transient rise times were measured at 50% of respective signal amplitudes. These measurements were used to calculate Vm-Cai2+ delays.
Effects of drugs on shock-induced arrhythmias
These experiments were performed in 0.8-mm wide strands (Figure 1D), in which shock-induced arrhythmias were previously extensively characterized7,10,13 and which have more reproducible width than the local expansions. To examine the role of Cai2+ in shock-induced arrhythmias, arrhythmia duration was measured in control monolayers and monolayers treated with Cai2+ chelator BAPTA-AM applied at 10-µmol/L concentration for 40 minutes. To monitor arrhythmias, cells were stained with 2.5 µmol/L of RH-237 for 5 minutes. To minimize dye photobleaching and phototoxicity, fluorescent recordings were performed at 10% of the normal excitation light intensity and recording duration was limited to 5 sec. Extensive temporal signal filtration and spatial averaging were used to improve signal-to-noise ratio. Shocks with strengths of 0, 10, 20, and 30 V/cm were used to induce arrhythmias.
To examine the roles of ionic currents in shock-induced arrhythmias, two inhibitors were applied: the INCX blocker KB-R7943 at 2-µmol/L concentration and the IK1 inhibitor BaCl2 at 0.2-mmol/L concentration. Arrhythmias were recorded using 5-sec recordings of cell contractions in transmitted light during application of shocks with strength of 0, 10, 20, 30 and 40 V/cm. Each series of measurements was performed at the same location three times: before drug application (control), after 10-min drug application, and after 20-min drug washout.
Data were reported as mean±SD. Differences between means of two groups of data were compared using the 2-tailed paired or unpaired Student’s t-test. Differences between three groups of data were compared using ANOVA test followed by post-hoc t-test with Bonferroni correction. Results were considered statistically significant if p<0.05.
RESULTS
Optical mapping of Vm and Cai2+ at the arrhythmia source
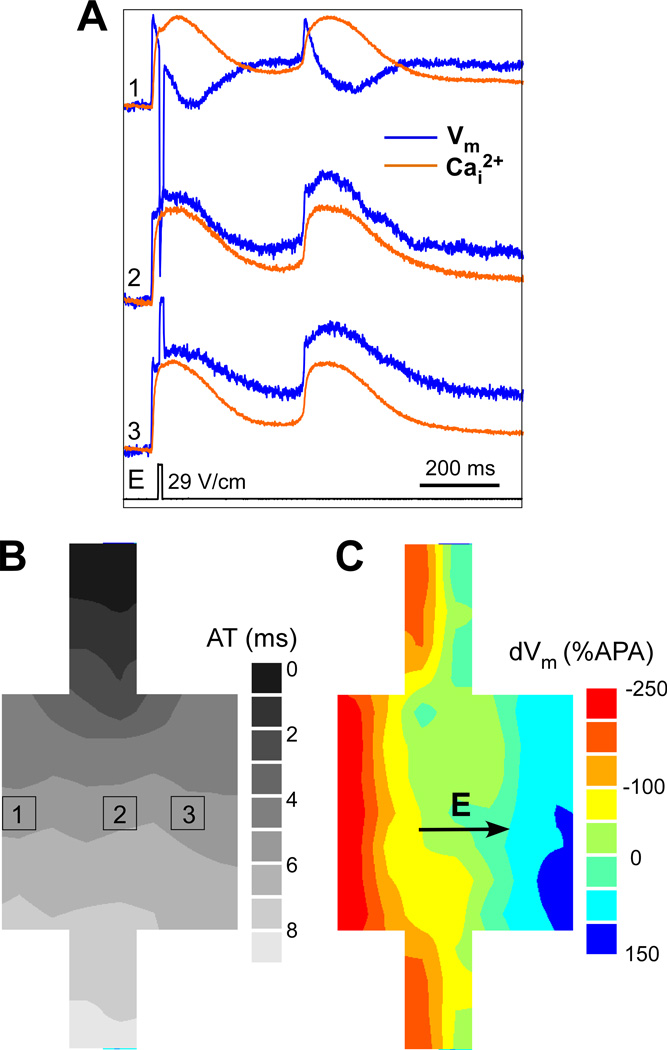
Arrhythmic beats with a localized source were mapped in 14 strands with local expansions from 9 monolayers. Figure 2A illustrates the effects of a shock with strength of 29 V/cm on Vm and Cai2+ in one cell strand. The shock induced one arrhythmic beat with cycle length of ~380 ms. Also shown are the activation pattern of the paced beat (Figure 2B), and the spatial distribution of shock-induced polarization (ΔVm) across the expansion (Figure 2C), with maximal hyperpolarization on the left and maximal depolarization on the right.
Figure 2.
Effects of shock application on Vm and Cai2+. A, Simultaneous recordings of Vm and Cai2+ during application of 29-V/cm shock, which induced one arrhythmic beat. B, Isochronal map of activation spread during the paced beat. C, Isopotential map of maximal shock-induced ΔVm distribution.
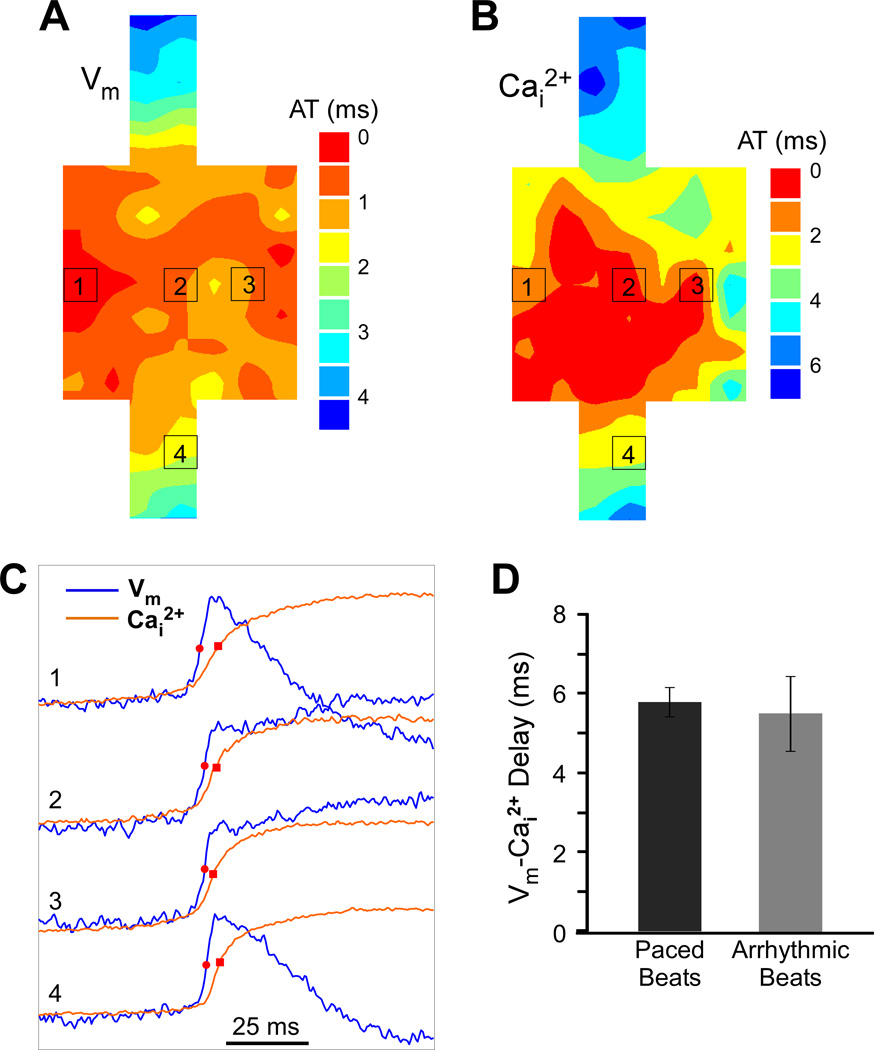
Figure 3 illustrates activation maps of the arrhythmic beat and the correspondence between Vm and Cai2+ upstrokes at the arrhythmia source. The region of the earliest activation defined within the first 0.5 ms of activation times was not highly localized, but it was inside the expansion region (Figure 3A), indicating that the source of the arrhythmic beat was within this area. The spatial pattern of Cai2+ rise (Figure 3B) shows that the earliest Cai2+ rise was also within the square expansion. At all recording sites inside the expansion, Cai2+ rise followed the Vm rise (Figure 3C). Previously it was shown that spontaneous Cai2+ transients at the arrhythmia source may precede or follow Vm upstrokes with a much shorter delay than during paced beats.17,19 Here, in contrast, the temporal relationship between Vm and Cai2+ rises in the area of earliest activation during the arrhythmic beat was not different from the paced beat. The average Vm-Cai2+ delay for the arrhythmic and the paced beats in this case was 5.8±1.4 ms and 6.0±0.4 ms, respectively.
Figure 3.
Relationship between Vm and Cai2+ rises during an arrhythmic beat. A, Isochronal map of activation spread during the arrhythmic beat. AT, activation time. B, Isochronal map of Cai2+ spread during the arrhythmic beat. C, Vm and Cai2+ recordings from selected sites within the expansion region (sites 1–3) and the narrow strand (site 4). D, Comparison of average Vm-Cai2+ delay between arrhythmic and paced beats.
Similar results were obtained for all arrhythmic episodes produced in strands with identifiable arrhythmia source by shocks with average strength of 30.2±6.1 V/cm (n=14), which produced 1–2 arrhythmic beats within 1-sec recording interval. In every arrhythmic beat, Vm upstrokes preceded Cai2+ transients at all recording sites. The average Vm-Cai2+ delay in the area of earliest activation during arrhythmic beats was 5.5±0.9 ms (Figure 3D), which was similar to that measured at the same sites during paced beats, which was 5.7±0.4 ms (n=14, NS).
Diastolic Cai2+ and Vm changes
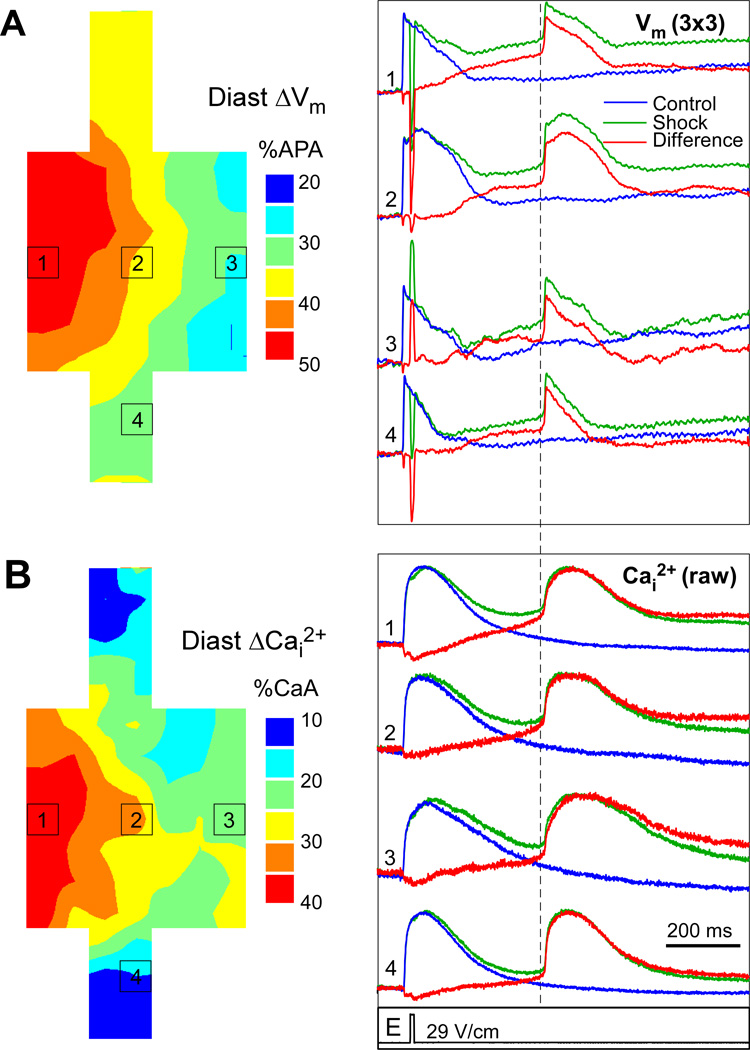
It has been previously shown that relatively slow spontaneous Cai2+ rises during diastole may precede AP upstrokes and the following Cai2+ transients.18 To analyze the effects of shocks on diastolic Cai2+ and Vm, optical recordings taken during shock application were compared to control recordings in 8 strands (in other six cases sufficiently long control recordings were not taken). Such comparison allowed elimination of signal changes caused by dye photobleaching and cell motion. Figure 4A illustrates an isochronal map of shock-induced diastolic Vm changes during application of a 29-V/cm shock as well as selected traces from control recordings (blue), shock recordings (green), and the difference between them (red). Because of relatively low Vm signal quality in these measurements, signals from nine diodes (3×3) were spatially averaged. At all sites, Vm was elevated following shock application as compared to control recordings. The magnitude of depolarization measured 10 ms prior to the earliest activation time of the arrhythmic AP (dashed line) was larger in the hyperpolarized area (49 %APA at site 1) than in the depolarized area (34 %APA at site 3) and the narrow strand (27 %APA at site 4). Analysis of diastolic depolarization in other strands showed similar results. Average diastolic Vm rise was higher in hyperpolarized areas than in depolarized areas (41.6±10 %APA versus 31.5±7 %APA, p<0.05) and narrows strands (28.6±13 %APA, p<0.05).
Figure 4.
Post-shock elevation of Vm and Cai2+. A, Isochronal map of diastolic ΔVm and spatially averaged Vm traces from control (blue) and shock (green) recordings, as well as the difference between shock and control (red). B, Isochronal map of diastolic Cai2+ rises and selected raw signals showing control, shock, and difference recordings. The dashed line indicates the measurement point of diastolic levels.
Figure 4B shows a map of diastolic Cai2+ increases, which was qualitatively similar to the Vm pattern inside the expansion. Also shown are raw Cai2+ traces from control and shock recordings, and the difference between them. It can be seen from the difference traces that the shock caused gradual diastolic Cai2+ elevation, which started right after shock application. The slope of diastolic Cai2+ elevation was relatively constant without additional rise preceding the arrhythmic AP. Such gradual Cai2+ elevation can be attributed to Ca2+ influx through shock-induced pores. Similar to Vm changes, the magnitude of diastolic Cai2+ elevation was larger in the area of shock-induced hyperpolarization (37 %CaA, site 1) than in the area of depolarization (25 %CaA, site 3) and in the narrow strand (21 %CaA, site 4), which is consistent with previous measurements of shock-induced Cai2+ changes in cell strands using low-affinity Cai2+ dye.13 Similar differences were observed in other measurements. On average, diastolic Cai2+ elevation was 27.6±8, 14.3±7 and 8.1±9 %CaA in areas of maximal hyperpolarization, depolarization, and in narrow strands, respectively (p<0.05 for all comparisons). These values likely overestimate diastolic Cai2+ changes, however, due to non-linear response of high-affinity Cai2+ dyes used here.13
Effect of Cai2+ buffering on shock-induced arrhythmias
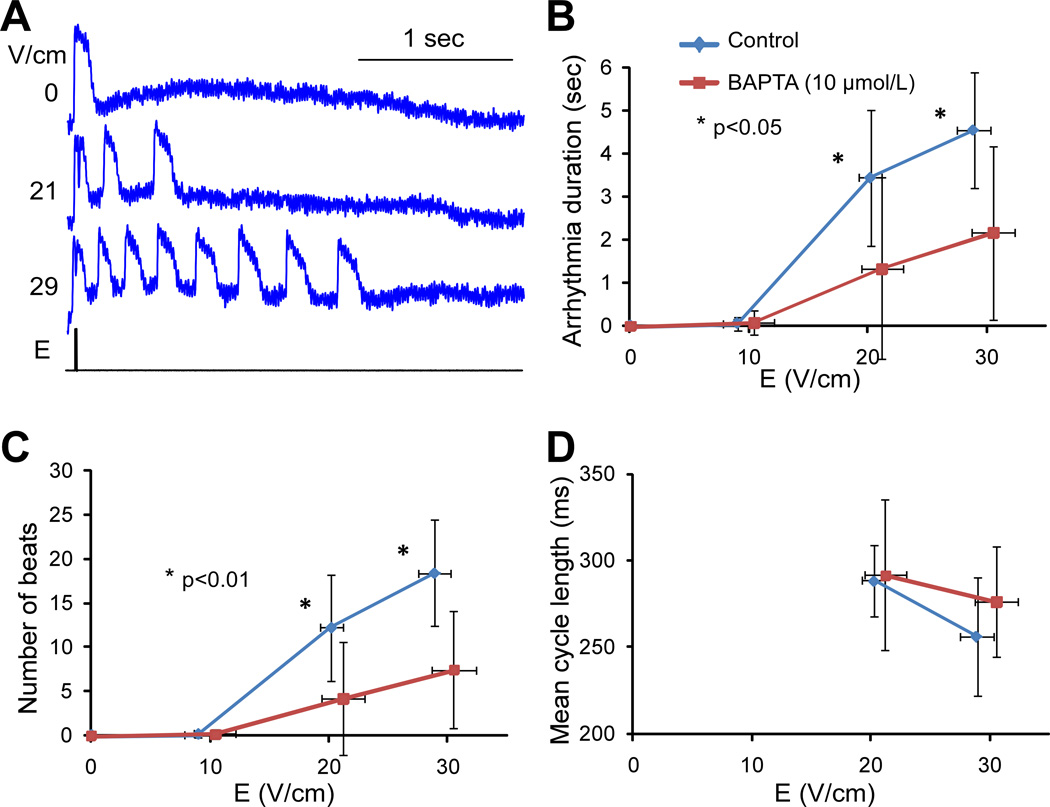
These experiments were performed in 17 strands from 5 monolayers treated with BAPTA-AM and 9 strands from 3 control monolayers. Figure 5A illustrates spatially and temporally filtered Vm recordings from a BAPTA-treated monolayer during application of shocks of variable strength. In all BAPTA-treated cell strands, shocks with strength of ~20 and ~30 V/cm induced arrhythmias that had fewer beats (Figure 5B, p<0.01) and lasted shorter time (Figure 5C, p<0.05) than in control monolayers. The value of arrhythmia duration caused by 30-V/cm shocks in BAPTA presence is underestimated because these arrhythmias could last longer than the 5-sec recording interval. Average cycle length, measured as arrhythmia duration divided by number of extra beats, was not significantly affected by BAPTA (Figure 5D, NS).
Figure 5.
Effect of BAPTA on arrhythmias. A, Vm traces recorded during shock application of different strengths in a BAPTA-treated monolayer. B, Arrhythmia duration measured during 5-sec interval in control strands (n=9) and BAPTA-treated strands (n=17). C, Number of arrhythmic beats. D, Average cycle length of arrhythmic beats measured as the ratio between arrhythmia duration and number of beats.
Effects of INCX and IK1 inhibition on arrhythmia duration
To examine the role of INCX current in shock-induced arrhythmias, the effect of an NCX inhibitor, KB-R7943, on arrhythmia duration was measured using recordings of cell contractions in transmitted light. A series of shocks with strength of approximately 0, 10, 20, 30 and 40 V/cm was applied in control conditions, during KB-R7943 application, and after drug washout. Different cultures exhibited substantial variability in threshold of arrhythmogenic shock strength and arrhythmia duration in control conditions. To limit this variability, analysis of KB-R7943 effects was limited to strands with ~30-V/cm arrhythmia thresholds in control conditions. This group included 12 strands from 6 cell monolayers.
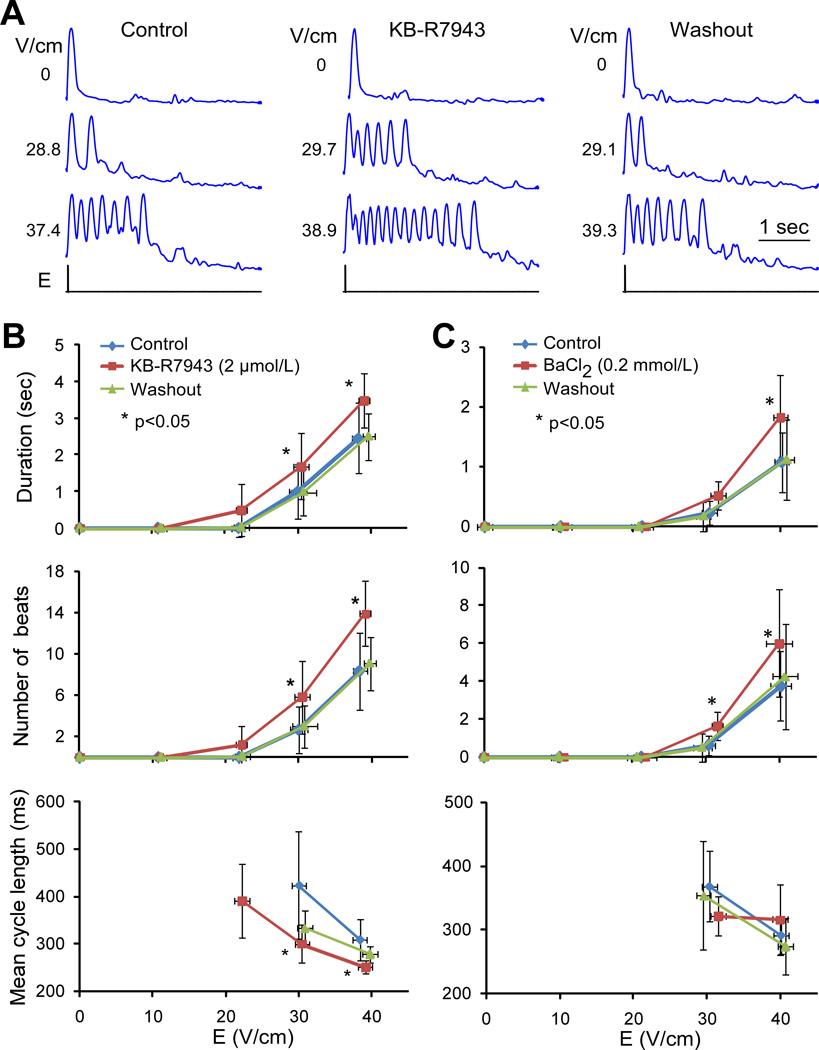
Figure 6A shows optical recordings of cell contractions from a typical cell strand exposed to shocks in control, during KB-R7943 application, and after drug washout. The minor deflections visible after the contractions were caused by vibrations of the solution surface in the perfusion bath. It can be seen that KB-R7943 increased the number of shock-induced arrhythmic beats in comparison to control and that this effect was reversible upon drug washout. Similar results were obtained in other cell strands. For shock strengths of ~30 V/cm and above, KB-R7943 significantly increased the arrhythmia duration and the number of shock-induced arrhythmic beats in comparison to control (Figure 6B). The effect on arrhythmia duration was reversible; after drug washout, it was similar to control for all shock strengths. Application of KB-R7943 also decreased the mean cycle length, although this effect was not completely reversible after washout.
Figure 6.
Effect of KB-R7943 and BaCl2 on arrhythmias. A, Recordings of cell contractions in response to different shock strengths and experimental treatment. B and C, Arrhythmia duration, number of beats, and their average cycle length measured during 5-sec interval in 12 cell strands in control, during KB-R7943 application, and after drug washout. C, Respective parameters measured in 8 cell strands in control, during BaCl2 application, and after drug washout.
The KB-R7943 data indicate that Cai2+-activated inward NCX current was not the driving force for shock-induced arrhythmias. Moreover, INCX inhibition unexpectedly prolonged arrhythmias. It can be hypothesized that this effect could be explained by increase of Cai2+ caused by NCX inhibition and Cai2+-dependent reduction of the outward component of the inward rectifier current, IK1, which may destabilize resting membrane potential and promote arrhythmias, as reported previously.24 The same Cai2+-dependent mechanism may also explain arrhythmia duration reduction by BAPTA-AM. To examine the role of IK1 in shock-induced arrhythmias, the effect of IK1 inhibitor BaCl2 (0.2-mmol/L) on arrhythmia duration was measured in 8 strands from 4 monolayers, which had arrhythmia thresholds ~30 V/cm in control conditions. In each strand, arrhythmia duration was measured using recordings of cell contractions in control, during BaCl2 application, and after drug washout. As shown in Figure 6C, BaCl2 application significantly increased the number of arrhythmic beats compared to control for 30- and 40-V/cm shocks and the arrhythmia duration for 40-V/cm shocks. This effect was reversible; upon BaCl2 washout, both parameters returned to control values. Effect of BaCl2 on average cycle length was less consistent; differences between control and drug-treated measurements were not statistically significant.
DISCUSSION
This study investigated the roles of spontaneous Cai2+ rises and inward INCX in shock-induced arrhythmias occurring in neonatal rat myocyte monolayers. The principal findings are: (1) Vm upstrokes preceded Cai2+ rises at the arrhythmia source, and the Vm-Cai2+ delay did not differ between arrhythmic and paced beats. Shocks caused gradual Cai2+ elevation without detectable SCRs preceding arrhythmic action potentials; (2) application of Cai2+ chelator BAPTA-AM decreased shock-induced arrhythmia duration; (3) NCX inhibition by KB-R7943 increased arrhythmia duration. Effects of both BAPTA-AM and KB-R7943 could be due to Cai2+-dependent inhibition of outward IK1. IK1 inhibition by BaCl2 increased the arrhythmia duration, providing support for part of this hypothesis.
Mechanism of shock-induced arrhythmias
A common mechanism of focal arrhythmias involves spontaneous Ca2+ rise due to ion release from the sarcoplasmic reticulum precipitated by Cai2+ overload and followed by activation of INCX and membrane depolarization.14 Although strong shocks cause diastolic Cai2+ increase, as reported in previous studies11,13 and here, two findings of this study indicate that this mechanism was not responsible for shock-induced arrhythmias. First, arrhythmias were not suppressed by NCX inhibition as would be expected if they were caused by activation of inward INCX. Second, no SCRs were observed. Such SCRs could be detected by measuring negative or very small delays between Cai2+ transients and APs at the arrhythmia source17,19 but Vm-Cai2+ delays were not different between arrhythmic and paced beats in this work. SCRs could also be revealed by slow Cai2+ rises preceding Cai2+ transients18,20,25 but no significant Cai2+ rises immediately before arrhythmic APs were observed either. Analysis of Cai2+ signals recorded with and without shocks demonstrated a gradual rise in Cai2+. This rise began immediately after shock application indicating that its cause was ion influx via shock-induced membrane pores without additional calcium influxes right before arrhythmic APs.
One can argue that SCRs were not detected because they occurred in individual cells and were averaged out in optical recordings from diodes which imaged an area with dimensions of 110 µm and collected light from several cells. However, Cai2+ rise in a single cell is unlikely to cause a propagated Vm response in cell monolayers because of the “critical size” limitation on excitation source.26 Although critical size of excitation in cell cultures is unknown, the value of electrotonic space constant of ~360 µm27 suggests that multiple cells must generate SCRs to produce an arrhythmic beat. If present, such SCRs would be detectable here.
Besides spontaneous Cai2+ rise and INCX activation, the other probable inward current which could raise Vm and induce arrhythmias is a non-specific leakage current, which flows through membrane pores produced by shocks. Voltage-clamp measurements in isolated cells have shown that large Vm displacements transiently increase membrane conductivity producing non-specific inward leakage current.9 In non-clamped cells, this current will depolarize the membrane, which may raise Vm to activation threshold causing arrhythmias. Post-shock diastolic depolarization was reported previously in cell cultures,10,11 tissue preparations,12,28 and whole hearts.29 Shock-induced changes in membrane conductivity and diastolic Vm are transient, with both parameters gradually returning to normal values, likely due to gradual pore re-sealing at a rate which is dependent on shock strength. Transient diastolic Vm rise and gradual increase in arrhythmia cycle length observed in the present study are consistent with such membrane changes supporting the role of non-specific leakage current in shock-induced arrhythmias observed in cell cultures.
The role of Cai2+ in shock-induced arrhythmias
Although the Cai2+-dependent mechanism was not the immediate cause of shock-induced arrhythmias, results suggest that Cai2+ did play a role in arrhythmia maintenance, as indicated by the effect of Ca2+ chelator BAPTA, which decreased the arrhythmia duration. This finding suggests that reducing cytoplasmic Ca2+ concentration may have an antiarrhythmic effect. The effect of the INCX inhibitor KB-R7943, which increased the arrhythmia duration, can be explained by the same mechanism, since NCX is responsible for approximately half of Ca2+ removal from cytosol in neonatal rat myocytes,30 and NCX inhibition is likely to increase diastolic Cai2+ levels.
The mechanism of dependence of shock-induced arrhythmias on Cai2+ is not clear at this time. A possible explanation is that this mechanism involves the inward rectifier current IK1, which is the primary current responsible for maintaining resting Vm.31 It is known that IK1 loss results in membrane depolarization and may, therefore, facilitate focal arrhythmias. It is also known that Cai2+ increase reduces outward IK1.24 Therefore, it can be hypothesized that BAPTA and KB-R7943 affected shock-induced arrhythmias via modulation of Cai2+ and thus IK1. The possible role of IK1 in shock-induced arrhythmias is supported by results of experiments with IK1 inhibitor BaCl2, which increased the arrhythmia duration. The link between Cai2+ changes and IK1 under experimental conditions employed in this study remains to be elucidated.
Limitations
Analysis of the Vm-Cai2+ relationship was limited to first arrhythmic beats with relatively long coupling intervals produced by weak shocks in order to avoid interference from cell contractions. It is possible that this relationship might be different for faster and longer arrhythmias produced by stronger shocks. Channel blockers used here are not entirely specific to their intended targets, which require caution in interpretation of drug experiments. Finally, application of findings obtained in cell cultures to whole adult hearts may be limited by differences in ionic properties, tissue structure, electrophysiological heterogeneities, presence of disease, etc. For example, sarcoplasmic reticulum is less developed,32,33 NCX expression is larger,34 and IK1 current density is smaller35 in neonatal myocytes than in adult cells. Therefore, contributions of these channels and SCRs to shock-induced arrhythmias in whole hearts and in neonatal myocyte cultures may differ.
ACKNOWLEDGMENTS
The authors thank Shannon Salter for help with growth substrate preparation.
This work was supported by NIH grant HL067748
List of Abbreviations
- AP
action potential
- APA
AP amplitude
- Cai2+
intracellular calcium concentration
- CaA
amplitude of Cai2+ transient
- E
shock field strength
- IK1
inward rectifier current
- INCX
sodium-calcium exchange current
- NCX
sodium-calcium exchanger
- SCR
spontaneous calcium rise
- Vm
membrane potential
- ΔVm
shock-induced Vm change
Footnotes
Publisher's Disclaimer: This is a PDF file of an unedited manuscript that has been accepted for publication. As a service to our customers we are providing this early version of the manuscript. The manuscript will undergo copyediting, typesetting, and review of the resulting proof before it is published in its final citable form. Please note that during the production process errors may be discovered which could affect the content, and all legal disclaimers that apply to the journal pertain.
REFERENCES
- 1.Dosdall DJ, Fast VG, Ideker RE. Mechanisms of defibrillation. Annu Rev Biomed Eng. 2010;12:233–258. doi: 10.1146/annurev-bioeng-070909-105305. [DOI] [PMC free article] [PubMed] [Google Scholar]
- 2.Tung L. Detrimental effects of electrical fields on cardiac muscle. Proceed IEEE. 1996;84:366–378. [Google Scholar]
- 3.Cates AW, Wolf PD, Hillsley RE, Souza JJ, Smith WM, Ideker RE. The probability of defibrillation success and the incidence of postshock arrhythmia as a function of shock strength. PACE. 1994;17:1208–1217. doi: 10.1111/j.1540-8159.1994.tb01487.x. [DOI] [PubMed] [Google Scholar]
- 4.Jones JL, Jones RE. Postshock arrhythmias--a possible cause of unsuccessful defibrillation. Crit Care Med. 1980;8:167–171. doi: 10.1097/00003246-198003000-00016. [DOI] [PubMed] [Google Scholar]
- 5.Chattipakorn N, Banville I, Gray RA, Ideker RE. Effects of shock strengths on ventricular defibrillation failure. Cardiovasc Res. 2004;61:39–44. doi: 10.1016/j.cardiores.2003.10.009. [DOI] [PubMed] [Google Scholar]
- 6.Fedorov VV, Kostecki G, Hemphill M, Efimov IR. Atria are more susceptible to electroporation than ventricles: implications for atrial stunning, shock-induced arrhythmia and defibrillation failure. Heart Rhythm. 2008;5:593–604. doi: 10.1016/j.hrthm.2008.01.026. [DOI] [PMC free article] [PubMed] [Google Scholar]
- 7.Cheek ER, Fast VG. Nonlinear changes of transmembrane potential during electrical shocks: role of membrane electroporation. Circ Res. 2004;94:208–214. doi: 10.1161/01.RES.0000111526.69133.DE. [DOI] [PubMed] [Google Scholar]
- 8.Fedorov VV, Nikolski VP, Efimov IR. Effect of electroporation on cardiac electrophysiology. Methods Mol Biol. 2008;423:433–448. doi: 10.1007/978-1-59745-194-9_34. [DOI] [PubMed] [Google Scholar]
- 9.O'Neill RJ, Tung L. Cell-attached patch clamp study of the electropermeabilization of amphibian cardiac cells. Biophys J. 1991;59:1028–1039. doi: 10.1016/S0006-3495(91)82318-9. [DOI] [PMC free article] [PubMed] [Google Scholar]
- 10.Fast VG, Cheek ER. Optical mapping of arrhythmias induced by strong electrical shocks in myocyte cultures. Circ Res. 2002;90:664–670. doi: 10.1161/01.res.0000013403.24495.cc. [DOI] [PubMed] [Google Scholar]
- 11.Krauthamer V, Jones JL. Calcium dynamics in cultured heart cells exposed to defibrillator-type electric shocks. Life Sciences. 1997;60:1977–1985. doi: 10.1016/s0024-3205(97)00162-8. [DOI] [PubMed] [Google Scholar]
- 12.Neunlist M, Tung L. Dose-dependent reduction of cardiac transmembrane potential by high-intensity electrical shocks. Am J Physiol. 1997;273:H2817–H2825. doi: 10.1152/ajpheart.1997.273.6.H2817. [DOI] [PubMed] [Google Scholar]
- 13.Fast VG, Cheek ER, Pollard AE, Ideker RE. Effects of electrical shocks on Cai2+ and Vm in myocyte cultures. Circ Res. 2004;94:1589–1597. doi: 10.1161/01.RES.0000132746.94360.8b. [DOI] [PubMed] [Google Scholar]
- 14.Schlotthauer K, Bers DM. Sarcoplasmic reticulum Ca(2+) release causes myocyte depolarization. Underlying mechanism and threshold for triggered action potentials. Circ Res. 2000;87:774–780. doi: 10.1161/01.res.87.9.774. [DOI] [PubMed] [Google Scholar]
- 15.Kass RS, Tsien RW, Weingart R. Ionic basis of transient inward current induced by strophanthidin in cardiac Purkinje fibres. J Physiol. 1978;281:209–226. doi: 10.1113/jphysiol.1978.sp012417. [DOI] [PMC free article] [PubMed] [Google Scholar]
- 16.Mechmann S, Pott L. Identification of Na-Ca exchange current in single cardiac myocytes. Nature. 1986;319:597–599. doi: 10.1038/319597a0. [DOI] [PubMed] [Google Scholar]
- 17.Choi BR, Burton F, Salama G. Cytosolic Ca2+ triggers early afterdepolarizations and Torsade de Pointes in rabbit hearts with type 2 long QT syndrome. J Physiol. 2002;543:615–631. doi: 10.1113/jphysiol.2002.024570. [DOI] [PMC free article] [PubMed] [Google Scholar]
- 18.Hoeker GS, Katra RP, Wilson LD, Plummer BN, Laurita KR. Spontaneous calcium release in tissue from the failing canine heart. Am J Physiol. 2009;297:H1235–H1242. doi: 10.1152/ajpheart.01320.2008. [DOI] [PMC free article] [PubMed] [Google Scholar]
- 19.Nemec J, Kim JJ, Gabris B, Salama G. Calcium oscillations and T-wave lability precede ventricular arrhythmias in acquired long QT type 2. Heart Rhythm. 2010;7:1686–1694. doi: 10.1016/j.hrthm.2010.06.032. [DOI] [PMC free article] [PubMed] [Google Scholar]
- 20.Maruyama M, Joung B, Tang L, et al. Diastolic intracellular calcium-membrane voltage coupling gain and postshock arrhythmias: role of purkinje fibers and triggered activity. Circ Res. 2010;106:399–408. doi: 10.1161/CIRCRESAHA.109.211292. [DOI] [PMC free article] [PubMed] [Google Scholar]
- 21.Rohr S, Fluckiger-Labrada R, Kucera JP. Photolithographically defined deposition of attachment factors as a versatile method for patterning the growth of different cell types in culture. Pflugers Arch. 2003;446:125–132. doi: 10.1007/s00424-002-1000-0. [DOI] [PubMed] [Google Scholar]
- 22.Fast VG, Rohr S, Ideker RE. Non-linear changes of transmembrane potential caused by defibrillation shocks in strands of cultured myocytes. Am J Physiol. 2000;278:H688–H697. doi: 10.1152/ajpheart.2000.278.3.H688. [DOI] [PubMed] [Google Scholar]
- 23.Fast VG, Ideker RE. Simultaneous optical mapping of transmembrane potential and intracellular calcium in myocyte cultures. J Cardiovasc Electrophysiol. 2000;11:547–556. doi: 10.1111/j.1540-8167.2000.tb00008.x. [DOI] [PubMed] [Google Scholar]
- 24.Delmar M, Ibarra J, Davidenko J, Lorente P, Jalife J. Dynamics of the background outward current of single guinea pig ventricular myocytes. Ionic mechanisms of hysteresis in cardiac cells. Circ Res. 1991;69:1316–1326. doi: 10.1161/01.res.69.5.1316. [DOI] [PubMed] [Google Scholar]
- 25.Katra RP, Laurita KR. Cellular mechanism of calcium-mediated triggered activity in the heart. Circ Res. 2005;96:535–542. doi: 10.1161/01.RES.0000159387.00749.3c. [DOI] [PubMed] [Google Scholar]
- 26.Fast VG, Kleber AG. Role of wavefront curvature in propagation of cardiac impulse. Cardiovasc Res. 1997;33:258–271. doi: 10.1016/s0008-6363(96)00216-7. [DOI] [PubMed] [Google Scholar]
- 27.Jongsma HJ, van Rijn HE. Electrotonic spread of current in monolayer cultures of neonatal rat heart cells. J Membrane Biol. 1972;9:341–360. doi: 10.1007/BF01868061. [DOI] [PubMed] [Google Scholar]
- 28.Kodama I, Shibata N, Sakuma I, et al. Aftereffects of high-intensity DC stimulation on the electromechanical performance of ventricular muscle. Am J Physiol. 1994;267:H248–H258. doi: 10.1152/ajpheart.1994.267.1.H248. [DOI] [PubMed] [Google Scholar]
- 29.Nikolski VP, Sambelashvili AT, Krinsky VI, Efimov IR. Effects of electroporation on optically recorded transmembrane potential responses to high-intensity electrical shocks. Am J Physiol. 2004;286:H412–H418. doi: 10.1152/ajpheart.00689.2003. [DOI] [PubMed] [Google Scholar]
- 30.Bers DM. Excitation-Contruction Coupling and Cardiac Contractile Force. 2nd ed. Norwell, MA: Kluwer Academic Publishers; 2001. [Google Scholar]
- 31.Lopatin AN, Nichols CG. Inward rectifiers in the heart: an update on I(K1) J Mol Cell Cardiol. 2001;33:625–638. doi: 10.1006/jmcc.2001.1344. [DOI] [PubMed] [Google Scholar]
- 32.Cohen NM, Lederer WJ. Changes in the calcium current of rat heart ventricular myocytes during development. J Physiol. 1988;406:115–146. doi: 10.1113/jphysiol.1988.sp017372. [DOI] [PMC free article] [PubMed] [Google Scholar]
- 33.Wibo M, Bravo G, Godfraind T. Postnatal maturation of excitation-contraction coupling in rat ventricle in relation to the subcellular localization and surface density of 1,4-dihydropyridine and ryanodine receptors. Circ Res. 1991;68:662–673. doi: 10.1161/01.res.68.3.662. [DOI] [PubMed] [Google Scholar]
- 34.Boerth SR, Zimmer DB, Artman M. Steady-state mRNA levels of the sarcolemmal Na(+)-Ca2+ exchanger peak near birth in developing rabbit and rat hearts. Circ Res. 1994;74:354–359. doi: 10.1161/01.res.74.2.354. [DOI] [PubMed] [Google Scholar]
- 35.Wahler GM. Developmental increases in the inwardly rectifying potassium current of rat ventricular myocytes. Am J Physiol. 1992;262:C1266–C1272. doi: 10.1152/ajpcell.1992.262.5.C1266. [DOI] [PubMed] [Google Scholar]


