
Figure 1. Boxplot for ASE values in cases and controls.
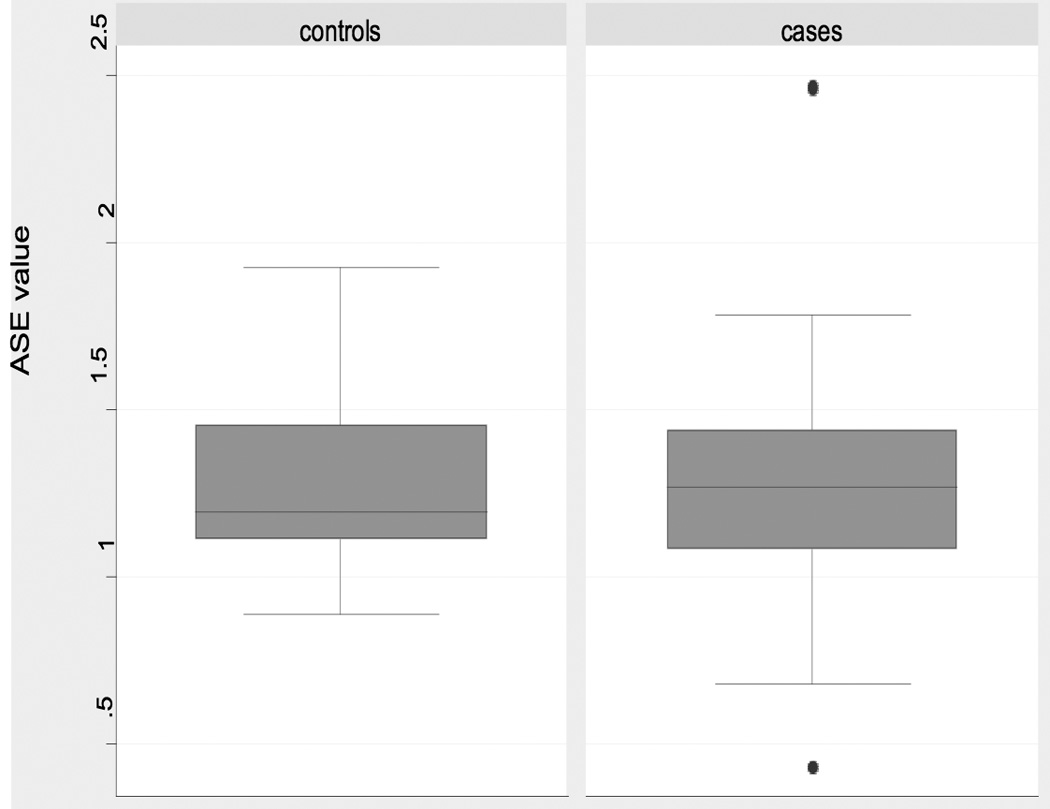
Boxplots of ASE distribution for individuals heterozygous at rs2229992. Note the outlying samples (cases) shown by filled circles.
Official websites use .gov
A
.gov website belongs to an official
government organization in the United States.
Secure .gov websites use HTTPS
A lock (
) or https:// means you've safely
connected to the .gov website. Share sensitive
information only on official, secure websites.
Boxplots of ASE distribution for individuals heterozygous at rs2229992. Note the outlying samples (cases) shown by filled circles.