Abstract
Microbial heterotrophic activity was investigated in oxic sub-seafloor sediments at North Pond, a sediment pond situated at 23°N on the western flank of the Mid-Atlantic Ridge. The North Pond sediments underlie the oligotrophic North Atlantic Gyre at 4580-m water depth and cover a 7–8 million-year-old basaltic crust aquifer through which seawater flows. Discrete samples for experimentation were obtained from up to ~9 m-long gravity cores taken at 14 stations in the North Pond area. Potential respiration rates were determined in sediment slurries incubated under aerobic conditions with 14C-acetate. Microbial heterotrophic activity, as defined by oxidation of acetate to CO2 (with O2 as electron acceptor), was detected in all 14 stations and all depths sampled. Potential respiration rates were generally low (<0.2 nmol of respired acetate cm−3 d−1) in the sediment, but indicate that microbial heterotrophic activity occurs in deep-sea, oxic, sub-seafloor sediments. Furthermore, discernable differences in activity existed between sites and within given depth profiles. At seven stations, activity was increased by several orders of magnitude at depth (up to ~12 nmol of acetate respired cm−3 d−1). We attempted to correlate the measures of activity with high-resolution color and element stratigraphy. Increased activities at certain depths may be correlated to variations in the sediment geology, i.e., to the presence of dark clay-rich layers, of sandy layers, or within clay-rich horizons presumably overlying basalts. This would suggest that the distribution of microbial heterotrophic activity in deeply buried sediments may be linked to specific lithologies. Nevertheless, high-resolution microbial examination at the level currently enjoyed by sedimentologists will be required to fully explore this link.
Keywords: microbial activity, heterotrophy, deep biosphere, oxic, marine sediment
Introduction
The mineralization of organic matter in marine sediments is governed by microbial metabolism. In the deep subsurface (>1.5 mbsf) of marine sediments, sulfate reduction, methanogenesis, and fermentation are considered to be the main metabolic activities responsible for the degradation of organic matter to small organic acids and CO2 (e.g., Parkes et al., 2000; D’hondt et al., 2002). However, since most sub-seafloor sediments considered in previous studies underlie productive coastal or upwelling areas, the microbial processes reflect the consequences of a high organic carbon flux to the seafloor, in which oxygen is rapidly depleted (D’hondt et al., 2009). Oligotrophic regions occur in the subtropical ocean gyres that represent a major part of the world’s ocean where the organic matter flux to the sediments is low, leading to deep oxygen penetration depths of tens of centimeters or more (Murray and Grundmanis, 1980). At the extreme, penetration depths of dissolved oxygen in the South Pacific Gyre sediments reached up to 9 m (D’hondt et al., 2009; Fischer et al., 2009).
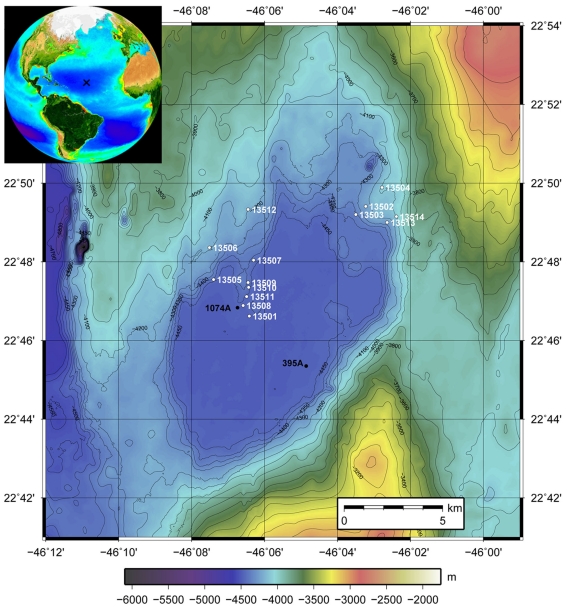
Deep penetration of oxygen in sediments of the Atlantic Ocean to ~9 meters have also been shown in sediments contained in ponded basins on the flanks of the North Mid-Atlantic Ridge (MAR), in the so-named North Pond (Cruise report MSM 11/1). North Pond is an isolated region of ponded sediment situated at ~100 km west of the rift valley of the MAR and~110 km south of the Kane fracture zone (22°46′N and 46°06′W; e.g., Hussong et al., 1979; Purdy et al., 1979). It is a large pond (~13 km N–S and ~7 km E–W) and lies below a low-productivity 4580-m water column. The sediment at North Pond can reach up to 300 m thickness and overlies a young basaltic active crust (7–8 Ma) through which vigorous lateral flow of cold seawater has been proposed to take place (Langseth et al., 1984).
We investigated microbial heterotrophic activity in sediment cores recovered at North Pond. Studies of microbial life in deep-oxic sediments are rare (D’hondt et al., 2009), and no measurements of experimentally determined, potential respiration rates have been reported yet in sub-seafloor sediment in which oxygen is penetrating several meters deep. We used 14C-acetate in the deep-oxic sediments from North Pond for this purpose as acetate has been proven to be well-suited to estimate potential respiration and uptake rates of organic molecules in subsurface environments (e.g., Wirsen and Jannasch, 1974; Phelps et al., 1989; Fredrickson et al., 1997). In the case of anoxic sediments the changes in pore water chemistry usually help to target the zones where specific types of microbial activity can be expected (i.e., sulfate–methane transition zones). At North Pond, the sampled sediments were oxic throughout, thus the sampling strategy was different. To gain an overview of the potential respiration rates, which were expected to be low and decreasing with depth at all stations, we sampled the oxic sediment with a regular spacing along the length of gravity cores obtained from North Pond. Occasionally, distinct layers, such as sandy, clay-rich, dark layers, were also sampled.
The goal of the microbial heterotrophic activity measurements was to compare potential respiration rates at different stations over a small area and investigate correlations between activity profiles and geological features. We present profiles of potential microbial heterotrophic activity in deep-sea, deep-oxic sub-seafloor sediments, and examine these rates in conjunction with respect to variations in sediment lithology.
Materials and Methods
Sediment collection
The North Pond area was visited during cruise MSM 11/1 on R/V Maria S. Merian in February–March 2009. Sediment cores were taken at 14 stations using a gravity corer (Table 1, Figure 1). Cores were split in two halves and labeled following the GeoB system of the University of Bremen. One half was kept intact for scanning analyses (archive half) while the other half was sampled for multiple purposes (work half). Sediment for activity measurements was sampled aerobically every meter. Additional samples were taken in specific cores when the sediment showed obvious lithological samples or color changes. Sediment was stored and transported at 4°C. Pore water samples for acetate measurements were taken within hours after core retrieval using Rhizone soil moisture samplers (Rhizosphere Research Products, Wageningen, The Netherlands). The Rhizone consists of an inert porous polymertube with a length of 10 cm and a pore size of 0.1 mm. Pore fluid is extracted by vacuum created with disposable 10 ml syringes connected to the Rhizone, frozen and kept at −20°C until analysis.
Table 1.
Stations of the MSM 11/1 cruise: sampling positions, water depth, sediment depth recovered, depths of samples for activity experiments.
| Station (GeoB) | Latitude (N) | Longitude (W) | Water depth (m) | Total sediment depth (cm) | Number of samples for activity |
|---|---|---|---|---|---|
| 13501 | 22°46,62′ | 46°6,42′ | 4480 | 844 | 9 |
| 13502 | 22°49,41′ | 46°3,23′ | 4250 | 847 | 10 |
| 13503 | 22°49,20′ | 46°3,50′ | 4365 | 689 | 5 |
| 13504 | 22°49,89′ | 46°2,78′ | 4096 | 72 | 4 |
| 13505 | 22°47,55′ | 46°7,40′ | 4402 | 76 | 2 |
| 13506 | 22°48,36′ | 46°7,51′ | 4143 | 574 | 6 |
| 13507 | 22°48,04′ | 46°6,30′ | 4395 | 865 | 11 |
| 13508 | 22°46,89′ | 46°6,59′ | 4475 | 344 | 4 |
| 13509 | 22°47,47′ | 46°6,45′ | 4438 | 267 | 3 |
| 13510 | 22°47,35′ | 46°6,44′ | 4448 | 515 | 6 |
| 13511 | 22°47,12′ | 46°6,49′ | 4445 | 468 | 5 |
| 13512 | 22°49,33′ | 46°6,45′ | 4200 | 516 | 5 |
| 13513 | 22°49,00′ | 46°2,64′ | 4262 | 504 | 5 |
| 13514 | 22°49,15′ | 46°2,39′ | 4040 | 237 | 3 |
Figure 1.
Bathymetric map of North Pond. Stations are indicated with the white numbers (GeoB 13501–GeoB 13514). GeoB 13501 is the reference station situated near the center of the pond in the flat, deep center of the sediment pond. All others cores have been taken at shallower depths on the edges of the pond where sediment thicknesses are reduced. The inset shows the situation of North Pond in the Atlantic Ocean (generated on oceancolor.gsfc.nasa.gov/SeaWiFS).
Prokaryotic activity measurements
Sediment slurries were prepared with 1 volume of sediment for 4 volumes of oxic artificial seawater (ASW; Süß et al., 2004) and distributed into Eppendorf tubes for incubation (1 ml slurry per tube). The potential respiration rates were estimated by measuring the production of 14CO2 from the oxidation of 14C-acetate (sodium 14C-acetate, 5.8 μl, 43 kBq, 20 nmol, GE Healthcare Life Sciences, UK or sodium 14C-acetate, 1.16 μl, 43 kBq, 20 nmol, American RadioChemicals, Saint-Louis, MO, USA). Two living samples and one formaldehyde-treated sample (2% v/v final concentration, dead control) were prepared for each of three incubation periods (3, 8, and 15 days) and amended with the radiotracer. Samples were incubated at 4°C (close to the in situ temperature of 2.5°C). Incubation was terminated by pouring the 1 ml slurry into 9 ml of 2.5% NaOH. Measurement of 14CO2 (diffusion method) was performed as described in Treude et al. (2003) with slight modifications. Samples in NaOH (5 ml) were transferred to 100-ml glass vials with 5 ml of 2.5% NaOH. A 6-ml scintillation vial containing 1 ml of beta-phenylethylamine and 1 ml of NaOH 0.5 M was fixed to the rubber stopper that closed the glass vial, hanging well above the sample to trap the 14CO2 in the headspace. Samples were then acidified with 6 ml of HCl 6 N to release the CO2 in the headspace and gently shaken (88 rpm) for at least 4 h at room temperature. A scintillation cocktail (ScintiGold, Perkin Elmer, USA) was added to the samples. Activity (in DPM) of the trapped 14CO2 was measured using a liquid scintillation counter (Tri-Carb 2500TR or 2900TR, Packard, now Perkin Elmer, USA). Rates of acetate respiration were calculated using the following equation:
| (1) |
where R is the rate of acetate respiration in the sediment (in nanomole cm−3 d−1), 14CO2 is the activity of the produced carbon dioxide in the living samples (in DPM) corrected by the activity (in DPM) in the dead samples, [14C-acetate] is the concentration of acetate added as a tracer (in nmol), 14C-acetate is the activity of the tracer added (in DPM), v is the volume of sediment (in cm3), and t is the time of incubation (in d).
Monitoring of oxygen concentration during slurry incubation
Oxygen concentration was monitored in one sediment sample to evaluate if the conditions remained oxic throughout the experiment. The sample was selected from core GeoB 13506 (131.5 cm below the seafloor) and slurry was prepared as described above and transferred to a borosilicate glass vial without headspace. Incubation was performed at 4°C. Non-labeled acetate was added at the same concentration than in the experiment with labeled acetate. Oxygen was measured during the incubation with a needle-type optical oxygen microsensor (PreSens Precision Sensing GmBH, Germany). It consisted of a fiber optic cable mounted in a needle at the end of a 1-ml syringe. The needle was inserted into the borosilicate vial through a silicon septum. The sensor was extended for measurement into the sediment phase of the slurry. The microsensor readout was made using a Microx TX3 (PreSens Precision Sensing GmBH) micro-fiber optic oxygen transmitter. A two-point calibration using anoxic and air-saturated ASW at 4°C was used.
Acetate measurements
Concentrations of acetate (and other volatile fatty acids) were determined in pore water samples by high-performance liquid chromatography (HPLC) using the method of Albert and Martens (1997), as adapted by Finke and Jorgensen (2008). Pore water samples (1 ml) were transferred into borosilicate glass vials (previously combusted at 480°C for 4 h). Acids were derivatized with p-nitrophenyl hydrazine, eluted with ion-pairing solvents and separated by HPLC using a LiChrosphere 80/100 column (Knauer, Berlin, Germany) at 25°C. The presence of acids was determined by UV absorption at 400 nm with a UV/VIS detector (Linear). The chromatograms were analyzed using the commercially available software Chromstar (Bechenheim, Germany). Standard solutions containing known concentrations of lactate, acetate, formate, propionate, isobutyrate, and butyrate were used. The detection limit for acetate was at 3 μM.
Core analyses
Undisturbed, archive halves of the gravity core sections were stored at 4°C at the core repository of the University of Bremen (Germany) until analyzed in 2011. Nine sediment cores chosen for detailed core analysis were prepared for non-destructive high-resolution digital, light, and x-ray fluorescence scanning using stainless steel or glass blades to provide a smooth and regular surface.
Digital imaging
High-resolution digital images of the split cores were taken using the GEOTEK Geoscan-III color line scan camera (3 CCD device using 3 × 1024 pixel CCD arrays, RGB detectors) mounted on the rack of the GEOTEK Multi-Sensor Core Logger (MSCL) at the University of Bremen.
Light reflectance
The light reflectance (L*) was measured at the surface of the split cores (covered with a thin film) using a Konica Minolta portable color spectrophotometer CM-2600d with diffuse illumination and 8° viewing angle (University of Bremen). Measurements were done every 2 cm on an 8-mm diameter area. The wavelength range of the instrument was 360–740 nm. The instrument was calibrated using a white-calibration plate and a zero-calibration box.
X-ray fluorescence scanning
X-ray fluorescence (XRF) core scanner data were collected every 2 cm down-core (except for core 13504, every 1 cm down-core) over a 120 mm2 area and with a sampling time of 20 s directly at the split core surface of the archive half with the Avaatech XRF Core Scanner II at MARUM-University of Bremen. The split core surface was covered with a 4 μm thin SPEX CertiPrepUltralene® foil to avoid contamination of the XRF measurement and desiccation of the sediment. The X-ray generator was an Oxford Instruments XTF5011 Rhodium X-ray tube 93057 set at an energy of 10 keV and at a current of 0.2 mA. The XRF data were acquired by a Canberra X-PIPS Silicon Drift Detector (SDD, model SXD 15C-150-500) with 150 eV X-ray resolution with a Canberra digital spectrum analyzer DAS 1000 as interface. Raw XRF spectra were processed using the WIN AXIL (Analysis of X-ray spectra by Iterative Least square) package from Canberra Eurisys.
Results
Site description and sediment characteristics
Fourteen gravity cores were taken during MSM 11/1 in water depths between 4040 and 4480 m (Table 1; Figure 1). Station 13501 is near the center of the pond at a water depth of 4480 m and served as a reference since it is in the deep, flat part of the pond with the greatest sediment thickness. Other stations were sampled where sediment thicknesses are reduced, at the N–E edge of the pond (GeoB13502, 13503, 13504, 13513, and 13514), at the N–W edge of the pond (GeoB13505, 13506, 13507, and 13512), and on a crest directed toward the center of the pond (GeoB13508, 13509, 13510, and 13511). Slumps of sediments occur on the slopes, thus the sedimentary pile is reduced. We targeted the sediment–basalt interface at these stations.
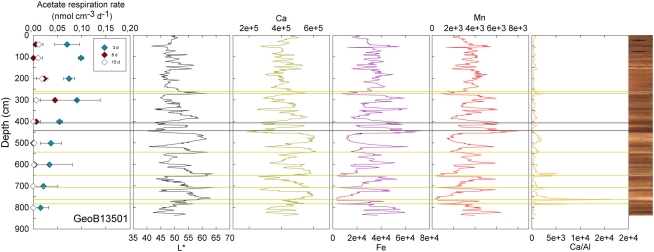
The principal lithology at North Pond is yellowish-brown to brownish-yellow pelagic sediment, ranging from nannofossil ooze with variable amounts of clay and foraminifers to foraminifer rich sand to clay (Timofeev et al., 1979; Cruise report MSM 11/1). The presence of sharp, irregular bottom contacts, and normal graded bedding indicates that the sandy coarse-grained intervals are the result of gravity flows supplied from the surrounding slopes (e.g., in GeoB 13501, Figure 2). Sand layers are found only in cores retrieved from depths >4300 m below sea level. At two sites, GeoB13504 (Figure 3) and GeoB13505, dense yellow to ochre clay was recovered. This clay ostensibly overlies basalt (Timofeev et al., 1979). The lower clay layer at GeoB13504 contained micrometer-sized fragments of basalt and glass. Mn micronodules within the nannofossil ooze, ranging from <1 to 3 mm in diameter, were identified in many cores.
Figure 2.
GeoB 13501 activity rates (at 42.5, 105.5, 201.5, 301.5, 401.5, 501.5, 601.5, 701.5, 801.5 cm) and detailed lithological features (L*, Ca, Fe, Mn, and Ca/Al). GeoB 13501 presents several sand layers (yellow lines) and two clay-rich layers (gray lines). Mn micronodules occur at the Mn peaks.
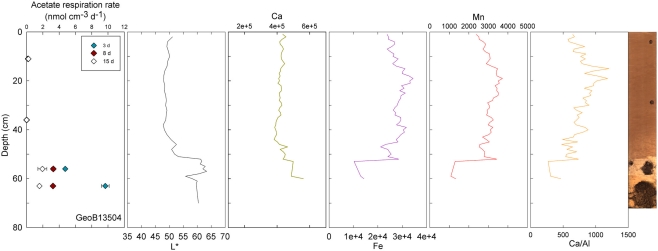
Figure 3.
GeoB 13504 activity rates (at 11, 36, 56, and 63 cm) and detailed lithological features (L*, Ca, Fe, Mn, and Ca/Al). GeoB 13504 is characteristic of the sediment–basalt transition beginning at ~52 cm. Micro-fragments of basalt are present in the lower clay-rich layer.
Visible-light reflectance was measured at the surface of the archive core halves of nine selected stations and correlates well with the carbonate content of the sediment as established previously (Giosan et al., 2002; Rogerson et al., 2006). XRF provided semi-quantitative measurements of light elements (Al, Si, K, Ca, Ti, Mn, and Fe) that can be used to evaluate their relative abundance along the cores. Ca is used to record carbonate content; Ca/Al is used as an indicator of fine-grained sediments vs. coarse-grained sediments, thus the higher the ratio the coarser the grain size (Richter et al., 2006). GeoB13501 (Figure 2) and 13504 (Figure 3) contain the principal lithological features observed at North Pond during MSM 11/1 cruise and are therefore described here in details. Values of L* ranged from 40.27 to 64.25 in Core GeoB13501 (Figure 2); foraminifer sand layers at 257–261, 264–271, 538–546, 644–653, 702–713, 742–764, and 777–781 cm (yellow lines in Figure 2) correspond to L* maxima and are further highlighted by peaks in the Ca/Al ratio. The high L* values are generally correlated with high Ca counts, which, in turn, correspond to a high carbonate content. The lowest L* values at 444 and 518 cm in GeoB13501 occur at dark layers richer in clay than the surrounding nannofossil ooze and correspond to low Ca/Al ratios (gray lines in Figure 2). The presence of Mn micronodules at ~440, ~580, ~675, and ~800 cm is confirmed by Mn and Fe maxima. In GeoB13504, L* ranged from 47.86 to 63.41 (Figure 3). L* increased abruptly at the transition (~55 cm) between the nannofossil ooze and the putative dense clay layer. Ca and thus carbonate content increased while Fe and Mn decreased. However the Ca/Al ratio decreased significantly at the transition, confirming the presence of very fine-grained sediment which may overlie basalt.
Potential respiration rates in deep-oxic sub-seafloor sediments
Acetate concentrations were below the detection limit (3 μM). However, potential microbial heterotrophic activity (as measured by the oxidation of 14C-acetate to 14CO2) was detected in sediment samples recovered from all 14 stations. In all of the samples, the highest rate was measured after the shortest incubation time (3 days) except in samples from GeoB13502 and 13510. A sample from core GeoB 13506 was selected to monitor the oxygen concentration in the slurry as a function of time. In this sample, in which the maximal rate was at 0.41 nmol cm−3 d−1, oxygen was completely depleted only after 20 days. We therefore assumed that most of the slurries remained oxic throughout the experiment. Thus, a switchover to anaerobic respiration after 3 days can be excluded. Overall, most of the experiments yielded low rates of potential activity (<0.2 nmol cm−3 d−1), consistent with the expected low fluxes of organic matter to the sediments at North Pond.
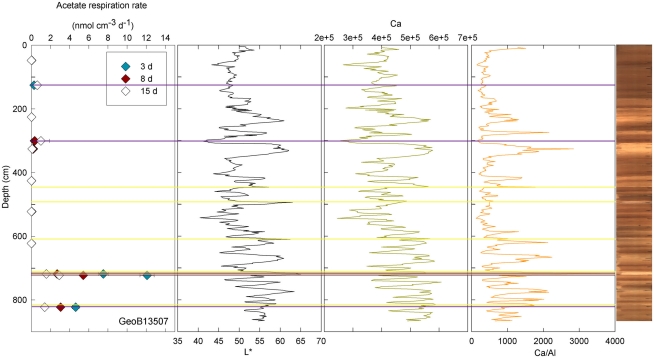
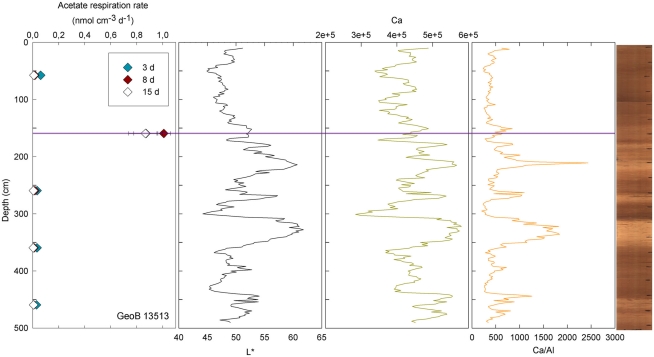
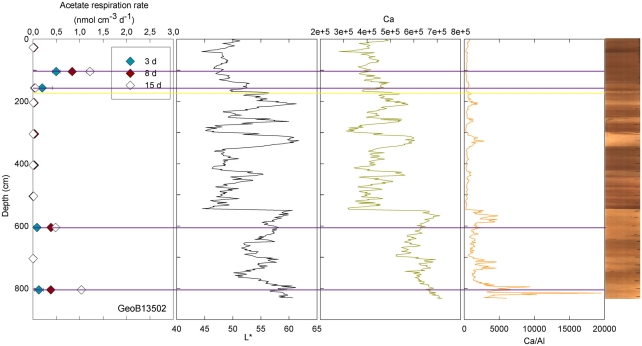
At three stations, rates of activity were greatest in the samples taken in the upper 80 cm: 0.21 nmol cm−3 d−1 at 57.5 cm in GeoB13511, up to 1.46 nmol cm−3 d−1 at 6 cm in GeoB13510, and 10.62 nmol cm−3 d−1 at 75.5 cm in GeoB 13512. In contrast, enhanced rates of potential acetate turnover were not restricted to just near the surface at the other seven stations. At GeoB13506 (131.5 cm), rates reached 0.41 nmol cm−3 d−1 in a layer that presented subtle color mottling (presumably associated with preserved bioturbation structures). At GeoB13508, peaks in activity were present at depth with rates of up to 0.17 (281.5 cm) and 0.21 nmol cm−3 d−1 (331.5 cm). Higher rates of potential acetate turnover were located just below and near sandy layers, which are present at 264–265 cm and 326–344 cm. Another example of increased activity in sandy layer is present in GeoB13507 (Figure 4), where in the sample taken at 718 cm in the middle of a sand layer (713–722 cm) activity was up to 7.52 nmol cm−3 d−1. The increase in activity is even more remarkable in the sample taken at 723.5 cm just below the sandy layer (up to 12.10 nmol cm−3 d−1). The deepest sample investigated in GeoB 13507 (822.5 cm), which is also situated below a sand layer at 812–814 cm, also showed high rates of potential activity (up to 4.63 nmol cm−3 d−1). At GeoB 13513, the highest rate (up to 1.01 nmol cm−3 d−1) occurred in the sample taken at 159.5 cm, which, as shown in Figure 5, correlated with a relatively distinct peaks in L*, Ca counts and Ca/Al. In GeoB 13502, the peaks in potential acetate turnover occurred at three layers at depth: 104.5, 604.5, and 804.5 cm (Figure 6).
Figure 4.
GeoB 13507 linked activities and lithological features. Yellow lines denote sandy layers; purple lines denote depths of greater potential acetate turnover. Samples were taken at 47.5, 125.5, 225.5, 300.5, 325.5, 425.5, 522.5, 622.5, 718, 722.5, and 822.5 cm.
Figure 5.
GeoB 13513 linked activities and lithological features. Purple line denotes depth of greater potential acetate turnover. Samples were taken at depths 57.5, 159.5, 259.5, 359.5, and 459.5 cm.
Figure 6.
GeoB 13502 linked activities (at 27.5, 104.5, 157, 204.5, 304.5, 404.5, 504.5, 604.5, 704.5, and 804.5 cm) and lithological features (L*, Ca, and Ca/Al). Yellow lines denote sandy layers; purple lines denote depths of greater potential acetate turnover.
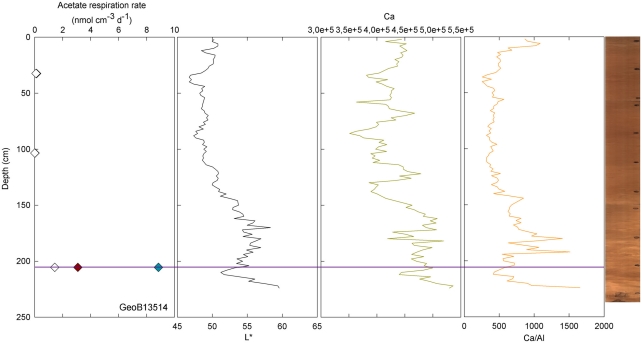
Conversely, enhanced rates of acetate turnover at 104.5 cm correspond to low L*, and low Ca/Al values. Likewise, a slight increase of activity in GeoB13507 (up to 0.99 nmol cm−3 d−1) at 300.5 cm, occurs in one of the darkest layers of the core (L* at 302 cm is at 41.31). This layer is also associated with the lowest intensity of Ca and a low Ca/Al ratio. This dark layer is also characterized by the presence of Mn micronodules, as confirmed by high Mn contents (data not shown). Finally, at GeoB 13504 (Figure 3) and GeoB13514 (Figure 7), activity peaks occurred in the deepest layers recovered, 56 and 63 cm and 205.5 cm, respectively. The presence of clay and basalt micro-fragments at the bottom of core 13504 suggests proximity to the basalt. The clay was very light in color and thus the L* value is the highest zone. The high L* matches a high Ca content up to 60 cm.
Figure 7.
GeoB 13514 linked activities (at 32.5, 103.5, and 205.5 cm) and lithological features (L*, Ca, and Ca/Al). Purple line denotes depths of greater potential acetate turnover.
Samples taken at 604.5 in GeoB 13514 and at 804.5 cm in GeoB 13502, high L* (as well as high Ca/Fe ratio) was coincident with enhanced rates of acetate turnover. In the lower parts of cores 13502 and 13514, the sediment became dense and light-colored. Cores 13504, 13514, and 13502 have in common their location at the top of the north–east edge of the pond, the two first being at a water depth of 4096 and 4040 m, respectively, while the latter is at 4250 m water depth.
Discussion
North Pond sediments are oligotrophic, nonetheless, our experiments indicate that microbial heterotrophic communities continue to be active in these deeply buried sediments. The communities react immediately to the supply of acetate as substrate, as no lag phase was observed before the oxidation of acetate to carbon dioxide. In our experiments, we added labeled acetate to concentrations of 20 μmol l−1. Growth of a specific aerobic acetotrophic (acetate-oxidizing) community can be excluded with a reasonable probability. More likely, heterotrophic communities are present and potentially active at all depths of the sediments sampled. Moreover, the range of potential activities is highly variable on both depth and lateral scales.
Such heterogeneity in potential activity rates over a small area is remarkable in such an oligotrophic environment, where one would expect low activity rates throughout the cores without much variation. Conversely, nitrate and oxygen fluxes at the surface sediment – water interface appear to be similar across all sites (Cruise report MSM 11/1). Some of this variability in potential activity may be linked to the location and water depth of the sites sampled. In three cores, the activity maxima occurred near the surface, where organic matter is younger and expectedly more accessible toward microbial degradation. The location in the pond might thus influence the magnitude of the increase in activity. For example, the three stations with greater near-surface acetate turnover rates follow a crest directed toward the center of the pond. GeoB13511 is at the bottom of the slope at 4445 m water depth; GeoB13510 is a bit further north on the slope at 4448 m water depth and GeoB13512 is northern at 4200 m water depth at the top of the edge. However, these three stations were the only ones where potential activity was greatest near the surface observed in the upper core; otherwise, peaks in potential acetate turnover could be observed at various depths.
While microbial cell counts and activities tend to decrease with increasing depth in the deep anaerobic sub-seafloor (Parkes et al., 1994, 2000), occurrences of enhanced activity in deep anoxic sub-seafloor layers have been attributed to geochemical reaction zones, e.g., at sulfate–methane transition zones; at fluid or gas-venting sites; or due to thermally driven alteration of organic matter to form acetate or methane (Cragg et al., 1992, 1995; Wellsbury et al., 1997; Parkes et al., 2005). Remarkable case of increases in sub-seafloor microbial population abundances and activities have also been observed in gas hydrate associated sediments (Cragg et al., 1995, 1996; Wellsbury et al., 2000).
On the other hand, down-core variability in microbial populations and enhanced microbial activities may be more closely related to changes in the lithology. At an open-ocean site of the Equatorial Pacific (site 1226, ODP Leg 201), prokaryotic activity was stimulated within Miocene age diatomaceous-rich layers (Parkes et al., 2005). At this same site, fluctuations in microbial populations have been related to depositional cycles of high organic carbon content linked to Milankovitch cycles (Aiello and Bekins, 2010). The stimulation of microbial activity at interfaces has also been studied in subsurface consolidated sedimentary structures. For example, increased microbial activity was observed in permeable sandstone layers adjacent to low-permeability organic-rich shales (Fredrickson et al., 1997; Krumholz et al., 1997) and was fueled by excess organic acids produced in the shales which diffused into the adjacent sandstone sediments (McMahon and Chapelle, 1991; McMahon et al., 1992; Fredrickson et al., 1997; Krumholz et al., 1997; Fry et al., 2009).
The North Pond sedimentary ecosystem is, at first glance, different from the systems described above. Specifically geochemical measurements indicate the presence of only one electron acceptor, i.e., oxygen (Cruise report MSM 11/1). In such an oligotrophic environment one would assume low rates of activity that decrease with increasing depth. Nevertheless, lithologic variability on a centimeter- to decimeter-scale can be seen throughout all of the examined cores (e.g., color scan figures in Figures 2–7). A link between sediment lithology and potential activity might therefore dictate the variability in the observed rates of potential activity.
We can associate the peaks in potential acetate turnover with three different types of lithology, but no one single lithological type appears to dominate. (1) In cores GeoB13507 and GeoB13508 increased microbial heterotrophic activity can be observed near sandy layers, which are characterized by a high L* value, a high Ca content and a high Ca/Al ratio. Due to a different permeability, sand layers may be a source of dissolved organic matter that diffuses into the adjacent clay layers, for example as described by Fredrickson et al. (1997) and Krumholz et al. (1997). (2) Other carbonate-rich layers also seem to influence microbial heterotrophic activity in several of the sites cores. In GeoB13506, 13513, 13502, 13514, and 13504, increases in activity are also related to relatively high L* value, Ca content and Ca/Al ratio. At GeoB 13504 the presence of clay indicates the proximity to the basaltic basement. Based on increases with depth of dissolved oxygen (Cruise report MSM 11/1), it is inferred that the basalt is in near proximity at GeoB13514, GeoB 13504, and GeoB13502. Even without the presence of clay at GeoB 13514 and GeoB 13502, it is probable that the basal part of the retrieved sediment section represents the transition to the clay overlying the basaltic basement. (3) Finally there are occurrences of increased activity in cores 13502 and 13507 at dark layers, presumably containing more clay than the surrounding nannofossil ooze.
The experiments show that heterotrophic microbial communities are active in deeply buried sediments, even in oligotrophic, low-organic carbon flux conditions. Most of the highest rates could be partially correlated with the presence of basalt nearby or directly associated with the presence of sandy layers. This suggests that microbial populations are stimulated near/at geological layers where lateral transport of fluids can occur and potential substrates can be provided to the microbes residing in the sediments. Nevertheless, we also detected potential rates of acetate turnover in other distinctly different lithological layers.
Thus, while we can not link increased microbial heterotrophic activity to a single, distinct lithological type, this study highlights the importance of a sampling strategy following the basic characteristics of the sediment, such as the color or the light reflectance, in the absence of strong pore water chemical gradients. A high-resolution study of the interfaces foraminifer sand/nannofossil ooze and basalt/clay would be of great interest. In the case of deep-oxic sediments, in which exposure to the atmosphere is not as critical, the sampling procedure could be dictated by non-destructive core analysis such as those employed in this study.
Conflict of Interest Statement
The authors declare that the research was conducted in the absence of any commercial or financial relationships that could be construed as a potential conflict of interest.
Acknowledgments
The authors would like to thank the captain Klaus Bergmann and the crew of the R/V Maria S. Merian; chief scientist HeinerVillinger, and all participants of the MSM 11/1 cruise. We are particularly thankful to Wolfgang Bach for providing the sediment description, as well as insightful comments; to Verena Heuer for providing the pore water samples for acetate measurements; to Friederike Schmidt-Horn for providing the bathymetry map; and to Wiebke Ziebis for discussion. We thank Gabi Schüß ler for the assistance in the lab with the 14CO2 diffusion method. This research used data acquired at the XRF Core Scanner Lab at MARUM – Center for Marine Environmental Sciences, University of Bremen, Germany. We are thankful to Vera Lukes for help with digital picture and XRF data acquisition. XRF and light reflectance data are available on www.pangaea.de. Aude Picard was funded through DFG-Research Center/Excellence Cluster “The Ocean in the Earth System” and the Max Planck Society. Cruise MSM 11/1 was funded by the German Science Foundation (DFG).
References
- Aiello I. W., Bekins B. A. (2010). Milankovitch-scale correlations between deeply buried microbial populations and biogenic ooze lithology. Geology 38, 79–82 10.1130/G30207.1 [DOI] [Google Scholar]
- Albert D. B., Martens C. S. (1997). Determination of low-molecular-weight organic acid concentrations in seawater and pore-water samples via HPLC. Mar. Chem. 56, 27–37 10.1016/S0304-4203(96)00083-7 [DOI] [Google Scholar]
- Cragg B. A., Harvey S. M., Fry J. C., Herbert R. A., Parkes R. J. (1992). Bacterial biomass and activity in the deep sediment layers of the JapanSea, hole 798B. Proc. Ocean Drill. Prog. Sci. Results 127/128, 761–776 [Google Scholar]
- Cragg B. A., Parkes R. J., Fry J. C., Weightman A. J., Rochelle P. A., Maxwell J. R. (1996). Bacterial populations and processes in sediments containing gas hydrates (ODP Leg 146: Cascadia Margin). Earth Planet. Sci. Lett. 139, 497–507 10.1016/0012-821X(95)00246-9 [DOI] [Google Scholar]
- Cragg B. A., Parkes R. J., Weightman A. J., Rochelle P. A., Maxwell J. R., Kastner M., Hovland M., Whiticar M. J., Sample J. C. (1995). The impact of fluid and gas venting on bacterial populations and processes in sediments from the Cascadia Margin accretionary system (sites 888–892) and the geochemical consequences. Proc. Ocean Drill. Prog. Sci. Results 146, 399–411 [Google Scholar]
- D’hondt S., Rutherford S., Spivack A. J. (2002). Metabolic activity of subsurface life in deep-sea sediments. Science 295, 2067–2070 10.1126/science.1064878 [DOI] [PubMed] [Google Scholar]
- D’hondt S., Spivack A. J., Pockalny R., Ferdelman T. G., Fischer J. P., Kallmeyer J., Abrams L. J., Smith D. C., Graham D., Hasiuk F., Schrum H., Stancin A. M. (2009). Subseafloor sedimentary life in the South Pacific Gyre. Proc. Natl. Acad. Sci. U.S.A. 106, 11651–11656 [DOI] [PMC free article] [PubMed] [Google Scholar]
- Finke N., Jorgensen B. B. (2008). Response of fermentation and sulfate reduction to experimental temperature changes in temperate and Arctic marine sediments. ISME J. 2, 815–829 10.1038/ismej.2008.20 [DOI] [PubMed] [Google Scholar]
- Fischer J. P., Ferdelman T. G., D’hondt S., Roy H., Wenzhofer F. (2009). Oxygen penetration deep into the sediment of the South Pacific gyre. Biogeosci. Discuss. 6, 3159–3186 10.5194/bgd-6-3159-2009 [DOI] [Google Scholar]
- Fredrickson J. K., Mckinley J. P., Bjornstad B. N., Long P. E., Ringelberg D. B., White D. C., Krumholz L. R., Suflita J. M., Colwell F. S., Lehman R. M., Phelps T. J. (1997). Pore-size constraints on the activity and survival of subsurface bacteria in a Late Cretaceous shale-sandstone sequence, northwestern New Mexico. Geomicrobiol. J. 14, 183–202 10.1080/01490459709378043 [DOI] [Google Scholar]
- Fry J. C., Horsfield B., Sykes R., Cragg B. A., Heywood C., Kim G. T., Mangelsdorf K., Mildenhall D. C., Rinna J., Vieth A., Zink K.-G., Sass H., Weightman A. J., Parkes R. J. (2009). Prokaryotic populations and activities in an interbedded coal deposit, including a previously deeply buried section (1.6–2.3 km) above (150 Ma basement rock. Geomicrobiol. J. 26, 163–178 10.1080/01490450902724832 [DOI] [Google Scholar]
- Giosan L., Flood R. D., Aller R. C. (2002). Paleoceanographic significance of sediment color on western North Atlantic drifts: I. Origin of color. Mar. Geol. 189, 25–41 10.1016/S0025-3227(02)00321-3 [DOI] [Google Scholar]
- Hussong D. M., Fryer P. B., Tuthill J. D., Wipperman L. K. (1979). The geological and geophysical setting near DSDP site 395, North Atlantic Ocean. Init. Repts. DSDP 45, 23–37 [Google Scholar]
- Krumholz L. R., Mckinley J. P., Ulrich G. A., Suflita J. M. (1997). Confined subsurface microbial communities in Cretaceous rock. Nature 386, 64–66 10.1038/386064a0 [DOI] [Google Scholar]
- Langseth M. G., Hyndman R. D., Becker K., Hickman S., Salisbury M. H. (1984). The hydrogeological regime of isolated sediment ponds in mid-ocean ridges. Init. Repts. DSDP 78B, 825–837 [Google Scholar]
- McMahon P. B., Chapelle F. H. (1991). Microbial production of organic acids in aquitard sediments and its role in aquifer geochemistry. Nature 349, 233–235 10.1038/349233a0 [DOI] [Google Scholar]
- McMahon P. B., Chapelle F. H., Falls W. F., Bradley P. M. (1992). Role of microbial processes in linking sandstone diagenesis with organic rich clays. J. Sediment. Petrol. 62, 1–10 [Google Scholar]
- Murray J. W., Grundmanis V. (1980). Oxygen consumption in pelagic marine sediments. Science 209, 1527–1530 10.1126/science.209.4464.1527 [DOI] [PubMed] [Google Scholar]
- Parkes R. J., Cragg B. A., Bale S. J., Getliff J. M., Goodman K., Rochelle P. A., Fry J. C., Weightman A. J., Harvey S. M. (1994). Deep bacterial biosphere in Pacific ocean sediments. Nature 371, 410–413 10.1038/371410a0 [DOI] [Google Scholar]
- Parkes R. J., Cragg B. A., Wellsbury P. (2000). Recent studies on bacterial populations and processes in subseafloor sediments: a review. Hydrogeol. J. 8, 11–28 10.1007/PL00010971 [DOI] [Google Scholar]
- Parkes R. J., Webster G., Cragg B. A., Weightman A. J., Newberry C. J., Ferdelman T. G., Kallmeyer J., Jorgensen B. B., Aiello I. W., Fry J. C. (2005). Deep sub-seafloor prokaryotes stimulated at interfaces over geological time. Nature 436, 390–394 10.1038/nature03796 [DOI] [PubMed] [Google Scholar]
- Phelps T. J., Hedrick D. B., Ringelberg D., Fliermans C. B., White D. C. (1989). Utility of radiotracer measurements for subsurface microbiology studies. J. Microbiol. Methods 9, 15–27 10.1016/0167-7012(89)90069-9 [DOI] [Google Scholar]
- Purdy G. M., Rabinowitz P. D., Schouten H. (1979). The mid-Atlantic ridge at 23°N. Bathymetry and magnetics. Init. Repts. DSDP 45, 119–128 [Google Scholar]
- Richter T. O., Van Der Gaast S., Koster B., Vaars A., Gieles R., De Stigter H. C., De Haas H., Van Weering T. C. E. (2006). “The Avaatech XRF core scanner: technical description and applications to NE Atlantic sediments,” in New Techniques in Sediment Core Analysis, ed. Rothwell R. G. (London: Geological Society; ), 39–50 [Google Scholar]
- Rogerson M., Weaver P. P. E., Rohling E. J., Lourens L. J., Murray J. W., Hayes A. (2006). “Colour logging as a tool in high-resolution palaeoceanography,” in New Techniques in Sediment Core Analysis, ed. Rothwell R. G. (London: Geological Society; ), 99–112 [Google Scholar]
- Süß J., Engelen B., Cypionka H., andSass H. (2004). Quantitative analysis of bacterial communities from Mediterranean sapropels based on cultivation-dependent methods. FEMS Microbiol. Ecol. 51, 109–121 10.1016/j.femsec.2004.07.010 [DOI] [PubMed] [Google Scholar]
- Timofeev P. P., Varentsov I. M., Rateev M. A., Renngarten N. V. (1979). Lithology, mineralogy, and geochemistry of upper cenozoic sediments at 23°N near the Mid-Atlantic Ridge, drilled on Leg 45. Init. Repts. DSDP 45, 323–347 [Google Scholar]
- Treude T., Boetius A., Knittel K., Wallmann K., Jorgensen B. B. (2003). Anaerobic oxidation of methane above gas hydrates at Hydrate Ridge, NE Pacific Ocean. Mar. Ecol. Prog. Ser. 264, 1–14 10.3354/meps264001 [DOI] [Google Scholar]
- Wellsbury P., Goodman K., Barth T., Cragg B. A., Barnes S. P., Parkes R. J. (1997). Deep marine biosphere fuelled by increasing organic matter availability during burial and heating. Nature 388, 573–576 10.1038/41544 [DOI] [Google Scholar]
- Wellsbury P., Goodman K., Cragg B. A., Parkes R. J. (2000). The geomicrobiology of deep marine sediments from BlakeRidge containing methane hydrate (sites 994, 995, and 997). Proc. Ocean Drill. Prog. Sci. Results 164, 379–391 [Google Scholar]
- Wirsen C. O., Jannasch H. W. (1974). Microbial transformations of some 14C-labeled substrates in coastal water and sediment. Microb. Ecol. 1, 25–37 10.1007/BF02512377 [DOI] [PubMed] [Google Scholar]


