

Abstract
Background
Substantial hospital-level variation in the risk of readmission after hospitalization for heart failure (HF) or acute myocardial infarction (AMI) has been reported. Prior studies have documented considerable state-level variation in rates of discharge to skilled nursing facilities (SNFs) but evaluation of hospital-level variation in SNF rates and its relationship to hospital-level readmission rates is limited.
Methods
Hospital-level 30-day all-cause risk-standardized readmission rates (RSRRs) were calculated using claims data for fee-for-service Medicare patients hospitalized with a principal diagnosis of HF or AMI from 2006-2008. Medicare claims were used to calculate rates of discharge to SNF following HF-specific or AMI-specific admissions in hospitals with ≥25 HF or AMI patients, respectively. Weighted regression was used to quantify the relationship between RSRRs and SNF rates for each condition.
Results
Mean RSRR following HF admission among 4,101 hospitals was 24.7%, and mean RSRR after AMI admission among 2,453 hospitals was 19.9%. Hospital-level SNF rates ranged from 0% to 83.8% for HF and from 0% to 77.8% for AMI. No significant relationship between RSRR after HF and SNF rate was found in adjusted regression models (p=0.15). RSRR after AMI increased by 0.03 percentage point for each 1 absolute percentage point increase in SNF rate in adjusted regression models (p=0.001). Overall, HF and AMI SNF rates explained <1% and 4% of the variation for their respective RSRRs.
Conclusion
SNF rates after HF or AMI hospitalization vary considerably across hospitals, but explain little of the variation in 30-day all-cause readmission rates for these conditions.
Keywords: heart failure, acute myocardial infarction, skilled nursing facilities, readmission, hospitals, health services research
Background
Referral to skilled nursing facilities (SNFs) for recuperative care after hospitalization has risen dramatically.[1] Patients are thought to benefit from more intensive monitoring and treatments that SNFs provide relative to other post-acute care options. Because inadequate medical follow-up after hospital discharge is hypothesized to be a major reason for avoidable readmissions,[2] optimizing the use of SNFs may serve as a potential strategy for reducing rehospitalizations.[3, 4] Evaluating the relationship between SNF referral and readmission risk at the hospital level will become increasingly important as the Center for Medicare and Medicaid Services (CMS) and other health insurers are considering reducing reimbursements to hospitals with high readmission rates.[5]
However, it is unclear whether hospitals with high rates of patients discharged to SNFs have lower readmission rates compared with hospitals with low SNF rates. Furthermore, while state-wide variation in SNF use has been observed,[1] our understanding of hospital-level variation is limited. Accordingly, we conducted a study using Medicare data to address two specific aims: 1) to examine hospital-level variation in rates of patients discharged to SNFs across the United States, and 2) to examine the relationship between hospital-level SNF rates and 30-day readmission rates (RSRRs). We evaluated SNF rates and risk-standardized readmission rates for two key illnesses—heart failure (HF) and acute myocardial infarction (AMI)— two diagnoses targeted as priority conditions for readmission reductions by the 2010 Patient Protection and Affordable Care Act.[5]
Methods
Data Sources
We obtained a 100% sample of the Standard Analytical Files of Medicare Part A fee-for-service inpatient claims from January 1, 2006 to December 31, 2008 from the Centers for Medicare and Medicaid Services (CMS), which included patient-level data on demographics, and diagnosis codes using the International Classification of Diseases, Ninth Revision, Clinical Modification (ICD-9-CM) for hospitalizations billed under fee-for-service Medicare. We also obtained a 100% sample of Medicare SNF administrative claims for the corresponding time period which included patient-level data on demographics, dates of service, and ICD-9-CM diagnosis codes for each SNF encounter billed under fee-for-service Medicare.
Study Sample
The study population included Medicare fee-for-service patients aged 65 years or older hospitalized with a principal discharge diagnosis of HF (ICD-9-CM codes 402.01, 402.11, 402.91, 404.01, 404.03, 404.11, 404.13, 404.91, 404.93, or 428.xx) or AMI (ICD-9-CM codes 410.xx, excluding codes with 410.x2 which indicate non-acute events). The study cohort consisted of patients with 1) complete Medicare fee-for-service claims history for 12 months prior to index HF or AMI hospitalization in order to fully ascertain comorbidities, and 2) at least 30 days of Medicare fee-for-service enrollment post HF or AMI discharge in order to fully ascertain readmission outcomes. Patients who were discharged alive within the first day of admission were excluded due to concerns about the accuracy of the diagnosis. To calculate stable estimates of hospital-level SNF rates, the study cohort was limited to patients admitted to hospitals with at least 25 HF or AMI patients, respectively, who were discharged alive from their index admission. Because we wanted to examine outcomes of typical HF patients, we excluded patients with a prior history of heart transplantation (ICD-9-CM procedure code 37.51) or mechanical circulatory support such as left ventricular assist devices (ICD-9-CM procedure codes 37.52-37.54, 37.62-37.68).
Risk-Standardization Readmission Rate (RSRR)
The primary outcomes were hospital-level risk-standardized readmission rates (RSRRs) representing readmissions for any reason within 30 days of discharge for HF or AMI. RSRRs were calculated using statistical models currently employed by CMS and endorsed by the National Quality Forum. The CMS models are publicly available and perform comparably to models based on clinical data abstracted medical record.[6, 7] Briefly, the RSRR model after HF contains 2 demographic, 12 cardiovascular, and 29 comorbidity variables; the RSRR measure after AMI contains 2 demographic, 13 cardiovascular, and 16 comorbidity variables. Concurrent cardiovascular and comorbid conditions were ascertained from Medicare Part A (i.e., inpatient and hospital outpatient data) and Medicare Part B (i.e., physician office outpatient data).
Skilled Nursing Facility (SNF) Rate
Patients discharged to SNF were identified by linking to Medicare SNF administrative claims through unique patient identifiers. Patients were considered as discharged to SNF if they entered a SNF on the same day or the subsequent day after discharge from hospitalization for HF or AMI. Hospital-level SNF rates were calculated by dividing the number of patients discharged to SNF in a given hospital by the overall denominator of HF or AMI admissions of patients who survived the hospitalization.
Hospital characteristics
Hospital characteristics were ascertained by linking the Medicare hospital provider number in the claims to the 2008 American Hospital Association Survey of Hospitals database. There were 153 and 83 hospitals not matched with AHA data which were excluded from the HF and AMI analyses, respectively; the relationship between RSRR and SNF rates in excluded hospitals were consistent with the primary analysis for both HF and AMI.
Statistical Analysis
Patient characteristics, hospital characteristics, and RSRRs were compared across quintiles of hospital SNF discharge rates using chi-squared tests for categorical variables and analysis of variance for continuous variables. We developed regression models of the relationship between hospital-level RSRRs (represented as percentage points, e.g. 15.0%) and SNF rates (represented as percentage points, e.g. 30%) weighted by hospital volume of HF or AMI patients. Linear and linear-log models were examined with comparable results; we present findings from the linear models. The explained variation between SNF rate and RSRR was represented by R2. Additional models were evaluated to assess whether the relationship the relationship between SNF rate and RSRR would change after adjusting for hospital characteristics described above. All analyses were conducted using SAS statistical software (version 9.1.3; SAS Institute Inc, Cary, North Carolina).
Results
Heart failure
1,347,425 patients were discharged alive after HF hospitalization in 4,101 hospitals with ≥25 patients over the study period. The cohort had mean age of 80.5 years, was 56.7% female, and 15.8% of non-white race. Common comorbidities included coronary artery disease (CAD), arrhythmias, diabetes, and valvular disease. (Table 1) 273,903 (20.3%) HF patients were discharged to SNF. HF patients entering SNFs were more likely to be readmitted within 30 days compared with patients not referred to SNF (28.2% v 23.7%, p<0.001)
Table 1.
Patient characteristics, according to quintiles of hospital-level SNF rates following HF hospitalization
| Characteristics | Overall | Lowest | 2 | 3 | 4 | Highest |
|---|---|---|---|---|---|---|
| SNF rates | 0-83.8 | 0-13.7 | 13.8-18.7 | 18.8-23.5 | 23.6-30.0 | 30.1-83.8 |
| No. of patients | 1347425 | 275960 | 337689 | 327166 | 261948 | 144662 |
| No. of hospitals | 4101 | 820 | 822 | 819 | 820 | 820 |
| Mean age (standard deviation) | 80.5 (7.9) | 79 (7.9) | 80 (7.9) | 80.7 (7.9) | 81.4 (7.9) | 82.3 (7.8) |
| Male sex | 43.3 | 45.1 | 44.1 | 43.0 | 41.8 | 40.5 |
| White race | 84.2 | 73.6 | 82.2 | 87.4 | 89.4 | 92.3 |
| Black race | 11.7 | 19.6 | 13.3 | 9.2 | 7.8 | 5.5 |
| Other race | 4.1 | 6.7 | 4.4 | 3.4 | 2.7 | 2.1 |
| Cardiovascular and Comorbidity Conditions | ||||||
| Congestive heart failure | 75.0 | 77.1 | 76.0 | 75.4 | 75.4 | 75.0 |
| Chronic atherosclerosis | 73.0 | 74.4 | 74.0 | 73.3 | 72.0 | 71.0 |
| Arrhythmias | 63.2 | 61.5 | 63.3 | 64.2 | 62.8 | 62.0 |
| Other gastrointestinal disorders | 53.1 | 52.0 | 53.2 | 52.8 | 53.2 | 53.9 |
| Iron deficiency and other anemias | 52.1 | 51.2 | 52.0 | 52.2 | 52.5 | 53.3 |
| Diabetes mellitus and complications | 50.9 | 53.1 | 51.4 | 50.4 | 49.6 | 48.8 |
| Valvular and rheumatic heart disease | 49.2 | 48.0 | 49.1 | 50.5 | 49.8 | 46.4 |
| Vascular or circulatory disease | 48.2 | 47.0 | 48.2 | 48.3 | 48.9 | 48.6 |
| Chronic obstructive pulmonary disease | 47.5 | 47.4 | 47.2 | 48.0 | 46.9 | 48.3 |
| Pneumonia | 42.1 | 40.7 | 41.0 | 41.7 | 43.0 | 44.4 |
| Disorders of fluid/electrolyte/acid-base | 41.7 | 41.9 | 41.9 | 41.5 | 41.4 | 41.9 |
| Renal failure | 38.0 | 39.5 | 38.8 | 38.1 | 36.9 | 35.5 |
| Other urinary tract disorders | 33.5 | 33.8 | 33.3 | 33.6 | 33.5 | 32.8 |
| Other and unspecified heart disease | 33.2 | 34.3 | 32.5 | 33.1 | 32.8 | 34.1 |
| Cardio-respiratory failure and shock | 20.7 | 21.0 | 21.3 | 20.6 | 20.5 | 18.6 |
| Dementia and senility | 20.5 | 18.7 | 19.6 | 20.2 | 21.8 | 23.9 |
| Cancer | 20.3 | 20.0 | 20.4 | 20.7 | 20.4 | 20.0 |
| Acute coronary syndrome | 18.7 | 19.8 | 19.4 | 18.4 | 17.9 | 17.2 |
| Peptic ulcer, gastrointestinal hemorrhage | 15.5 | 15.0 | 15.4 | 15.5 | 15.9 | 16.1 |
| Depression | 13.1 | 11.3 | 12.5 | 13.1 | 14.0 | 15.8 |
| Decubitus ulcer or chronic skin ulcer | 12.8 | 11.5 | 12.0 | 13.2 | 13.7 | 13.9 |
| Fibrosis of lung and other chronic lung disorders | 12.4 | 11.9 | 12.1 | 12.8 | 12.4 | 12.7 |
| History of CABG | 11.2 | 11.9 | 11.3 | 11.5 | 10.8 | 10.0 |
| Stroke | 10.4 | 10.1 | 10.5 | 10.3 | 10.0 | 10.3 |
| Other psychiatric disorders | 10.0 | 9.0 | 9.5 | 9.9 | 10.6 | 12.1 |
| Drug/alcohol abuse / dependence / psychosis | 9.1 | 10.4 | 9.6 | 8.8 | 8.3 | 7.3 |
| Asthma | 8.8 | 9.6 | 9.0 | 8.5 | 8.4 | 8.0 |
| Major psychiatric disorders | 8.7 | 7.5 | 8.5 | 8.6 | 9.4 | 10.5 |
| Liver and biliary disease | 8.4 | 8.9 | 8.0 | 8.3 | 8.0 | 7.7 |
| Paralysis | 6.8 | 6.9 | 7.0 | 6.9 | 6.8 | 6.8 |
| Protein-calorie malnutrition | 5.9 | 6.4 | 6.2 | 5.7 | 5.7 | 4.7 |
| End-stage renal disease or dialysis | 3.8 | 4.7 | 4.2 | 3.8 | 3.1 | 2.3 |
| Severe hematological disorders | 3.7 | 3.5 | 3.8 | 3.8 | 3.7 | 3.7 |
| Nephritis | 3.0 | 3.1 | 3.1 | 3.0 | 2.8 | 2.6 |
| Metastatic cancer and acute leukemia | 2.2 | 2.1 | 2.2 | 2.3 | 2.2 | 2.2 |
Abbreviations: CABG, coronary artery bypass graft surgery
p<0.0001 for all comparisons across quintiles using ANOVA for continuous variables and chi-square test for categorical variables
The HF cohort was predominately treated in non-profit non-teaching medical centers located in non-rural settings. (Table 2) The mean hospital SNF rate was 22.5% (SD 10.9) with variation in SNF rates ranging from 0 to 83.8%. (Table 3) Hospitals in the highest quintile of SNF rate after HF were most likely to be non-teaching facilities, without on-site facilities for cardiac procedures, with smaller bed size. (Table 2)
Table 2.
Hospital characteristics, according to quintiles of hospital-level SNF rates following HF hospitalization
| SNF rates | Overall | Lowest | 2 | 3 | 4 | Highest |
|---|---|---|---|---|---|---|
| 0-83.8 | 0-13.7 | 13.8-18.7 | 18.8-23.5 | 23.6-30.0 | 30.1-83.8 | |
| No. of hospitals | 4101 | 820 | 822 | 819 | 820 | 820 |
| Teaching | ||||||
| COTH | 270 (6.6) | 104 (12.6) | 76 (9.2) | 47 (5.7) | 34 (4.1) | 9 (1.1) |
| Teaching | 486 (11.8) | 112 (13.6) | 111 (13.5) | 121 (14.7) | 106 (12.9) | 36 (4.4) |
| Non-teaching | 3345 (81.5) | 604 (73.6) | 635 (77.2) | 651 (79.4) | 680 (82.9) | 775 (94.5) |
| Rural | 927 (22.6) | 125 (15.2) | 142 (17.2) | 121 (14.7) | 187 (22.8) | 352 (42.9) |
| Heart transplant hospital | 111 (2.7) | 51 (6.2) | 36 (4.4) | 15 (1.8) | 6 (0.7) | 3 (0.4) |
| PCI hospital | 1731 (42.2) | 403 (49.1) | 437 (53.1) | 435 (53.1) | 328(40.0) | 128 (15.6) |
| CABG hospital | 1714 (41.7) | 400 (48.7) | 435 (52.9) | 429 (52.3) | 322 (39.2) | 128 (15.6) |
| Bedsize, mean (SD) | 180.3 (192.0) | 221.8 (207.0) | 234.0 (239.0) | 201.3 (192.0) | 158.5 (153.0) | 85.4 (94.7) |
| Ownership | ||||||
| non-profit | 2536 (61.8) | 409 (49.0) | 506 (61.5) | 575 (70.2) | 536 (65.3) | 510 (62.1) |
| private, for-profit | 652 (15.8) | 204 (24.0) | 152 (18.4) | 114 (13.9) | 107 (13.0) | 75 (9.1) |
| public | 913 (22.2) | 207 (25.2) | 164 (19.0) | 130 (15.8) | 177 (21.5) | 235 (28.6) |
| Census division | ||||||
| New England | 174 (4.2) | 2 (0.2) | 12 (1.45) | 29 (3.5) | 51 (6.2) | 80 (9.7) |
| Middle Atlantic | 395 (9.6) | 42 (5.1) | 55 (6.7) | 105 (12.8) | 118 (14.3) | 75 (9.1) |
| South Atlantic | 382 (9.3) | 100 (12.1) | 103 (12.5) | 51 (6.2) | 69 (8.4) | 59 (7.2) |
| East North Central | 643 (15.6) | 165 (20.0) | 199 (24.2) | 144 (17.5) | 96 (11.7) | 39 (4.7) |
| East South Central | 536 (13.0) | 25 (3.0) | 61 (7.42) | 86 (10.5) | 117 (14.2) | 247 (30.0) |
| West North Central | 674 (16.0) | 73 (8.9) | 106 (12.8) | 154 (18.8) | 171 (20.8) | 170 (20.7) |
| West South Central | 562 (13.0) | 174 (21.2) | 114 (13.8) | 95 (11.0) | 84 (10.2) | 95 (11.5) |
| Mountain | 277 (6.8) | 82 (10.0) | 68 (8.3) | 49 (6.0) | 45 (5.4) | 33 (4.0) |
| Pacific | 423 (10.3) | 122 (14.0) | 104 (12.6) | 106 (12.9) | 69 (8.4) | 22 (2.7) |
Abbreviations: CABG, coronary artery bypass graft surgery; COTH, Council of Teaching Hospitals; HF, heart failure; PCI, percutaneous coronary intervention, SD, standard deviation
p<0.0001 for all comparisons across quintiles using ANOVA for continuous variables and chi-square test for categorical variables
Table 3.
30-day risk-standardized readmission rate following HF hospitalization, by quintile of SNF rate
| SNF rates | Overall | Lowest | 2 | 3 | 4 | Highest |
|---|---|---|---|---|---|---|
| 0-83.8 | 0-13.7 | 13.8-18.7 | 18.8-23.5 | 23.6-30.0 | 30.1-83.8 | |
| No. of hospitals | 4101 | 820 | 822 | 819 | 820 | 820 |
| Risk-standardized readmission rate | ||||||
| mean | 24.7 | 25.0 | 24.7 | 24.4 | 24.6 | 24.5 |
| standard deviation | 2.0 | 2.2 | 2.1 | 1.9 | 2.0 | 1.7 |
| median | 24.5 | 24.8 | 24.6 | 24.5 | 24.4 | 24.4 |
| minimum | 17.0 | 17.0 | 19.0 | 18.2 | 18.3 | 20.3 |
| maximum | 33.2 | 32.8 | 33.2 | 31.5 | 31.9 | 31.4 |
Patients admitted to hospitals in the highest quintile of SNF rates were likely to be older, female, and of white race compared with the lowest quintile (p<0.0001). (Table 1) There were significantly fewer patients of black or other race in the highest quintile of SNF rates compared with the lowest quintile (p<0.0001) Patients in hospitals in the highest quintile of SNF rates were more likely to suffer from certain non-cardiac comorbidities (e.g. depression, dementia, decubitus ulcers), but in general, differences across SNF quintiles was 5 percentage points or less. (Table 1)
The mean 30-day RSRR after discharge for HF was 24.7 (SD 2.0) and ranged from 17.0 to 33.2. (Table 3) The R2, representing explained variation between SNF rate and RSRR, was very low at 0.009. In a regression model adjusting for hospital characteristics, we observed no significant relationship between SNF rate and RSRR (p=0.15). (Figure 2)
Figure 2.
30-day acute myocardial infarction risk-standardized readmission rate by skilled nursing facility referral rate
Acute Myocardial Infarction
539,869 patients were discharged alive after AMI hospitalization in 2,453 hospitals with ≥25 patients over the study period. The cohort had mean age of 78.8 years, was 50.4% female and 11.1% of non-white race. Common comorbidities for these AMI patients included CAD, history of HF, prior AMI, and vascular disease. (Table 4) 103,961 (19.3%) AMI patients were discharged to SNF. AMI patients entering SNFs were more likely to be readmitted within 30 days compared with patients not referred to SNF (27.8% v 17.9%, p<0.001)
Table 4.
Patient characteristics, according to quintiles of hospital-level SNF rates following AMI hospitalization
| Characteristics | Overall | Lowest | 2 | 3 | 4 | Highest |
|---|---|---|---|---|---|---|
| SNF rates | 0-77.8 | 0-13.1 | 13.2-18.4 | 18.5-25.0 | 25.1-34.8 | 34.9-77.8 |
| No. of patients | 539869 | 143715 | 156232 | 130153 | 70910 | 38859 |
| No. of hospitals | 2453 | 490 | 491 | 498 | 484 | 490 |
| Mean age (standard deviation) | 78.8 (8.0) | 77.1 (7.6) | 78.1 (7.8) | 79.0 (7.9) | 80.0 (8.1) | 83.3 (7.9) |
| Male | 49.6 | 53.2 | 51.2 | 49.3 | 44.9 | 39.5 |
| White | 88.0 | 86.8 | 89.2 | 89.4 | 89.4 | 91.6 |
| Black | 7.2 | 8.5 | 6.5 | 7.1 | 7.1 | 5.6 |
| Other | 3.9 | 4.7 | 4.2 | 3.4 | 3.3 | 2.7 |
| Cardiovascular and Comorbidity Conditions | ||||||
| Coronary artery disease | 80.9 | 84.4 | 83.2 | 81.0 | 75.7 | 67.2 |
| Diabetes mellitus and complications | 42.0 | 41.3 | 41.4 | 42.4 | 42.7 | 44.0 |
| Iron deficiency and other anemias | 37.6 | 33.4 | 35.8 | 38.8 | 42.1 | 48.0 |
| Vascular or circulatory disease | 33.8 | 30.1 | 32.1 | 35.1 | 37.9 | 42.1 |
| Arrhythmias | 33.0 | 29.1 | 31.8 | 34.0 | 36.5 | 40.5 |
| Congestive heart failure | 32.9 | 28.8 | 31.0 | 33.2 | 38.0 | 45.5 |
| Valvular and rheumatic heart disease | 31.0 | 27.7 | 29.7 | 32.7 | 34.5 | 36.1 |
| Chronic obstructive pulmonary disease | 30.2 | 29.0 | 29.4 | 29.8 | 32.2 | 35.8 |
| History of infection | 25.0 | 19.2 | 22.9 | 26.9 | 30.9 | 37.0 |
| Disorders of fluid/electrolyte/acid-base | 24.1 | 21.5 | 22.9 | 24.6 | 26.9 | 31.8 |
| Angina pectoris / old myocardial infarction | 23.7 | 23.1 | 23.6 | 23.9 | 24.3 | 24.3 |
| Pneumonia | 23.1 | 19.5 | 21.5 | 23.0 | 27.3 | 35.1 |
| Acute coronary syndrome | 23.0 | 22.5 | 22.9 | 22.7 | 23.3 | 25.6 |
| Other urinary tract disorders | 21.8 | 20.2 | 21.2 | 22.3 | 23.6 | 25.7 |
| Renal failure | 19.4 | 17.1 | 18.6 | 20.2 | 21.6 | 25.0 |
| Cerebrovascular disease | 19.4 | 17.8 | 18.6 | 20.2 | 21.1 | 22.9 |
| Cancer | 18.7 | 17.7 | 18.6 | 19.8 | 19.2 | 18.9 |
| Dementia and senility | 16.5 | 12.7 | 14.3 | 16.5 | 21.6 | 30.0 |
| Myocardial infarction, other than anterior | 13.3 | 16.0 | 14.7 | 12.7 | 10.0 | 6.3 |
| Myocardial infarction, anterior | 9.6 | 10.9 | 10.2 | 9.3 | 7.9 | 6.2 |
| History of PCI | 8.8 | 9.9 | 9.3 | 8.9 | 7.1 | 4.7 |
| Stroke | 8.1 | 7.0 | 7.2 | 8.2 | 9.7 | 11.7 |
| Decubitus ulcer or chronic skin ulcer | 7.4 | 5.4 | 6.6 | 8.0 | 9.7 | 12.4 |
| History of CABG | 6.3 | 6.4 | 5.8 | 6.3 | 6.7 | 6.6 |
| Asthma | 5.8 | 5.9 | 6.1 | 6.0 | 5.9 | 5.6 |
| Hemiplegia, paraplegia, paralysis | 5.4 | 4.7 | 5.1 | 5.5 | 6.4 | 7.5 |
| Protein-calorie malnutrition | 3.9 | 3.4 | 3.7 | 3.6 | 4.7 | 5.5 |
| End-stage renal disease or dialysis | 2.2 | 2.1 | 2.3 | 2.4 | 2.1 | 2.0 |
| Metastatic cancer and acute leukemia | 2.1 | 1.7 | 2.0 | 2.2 | 2.4 | 2.8 |
Abbreviations: CABG, coronary artery bypass graft surgery; PCI, percutaneous coronary intervention
p<0.0001 for all comparisons across quintiles using ANOVA for continuous variables and chi-square test for categorical variables
Similar to HF, the AMI cohort was predominately treated in non-profit non-teaching medical centers located in non-rural settings. (Table 5) The mean hospital SNF rate was 24.1% (SD 13.0) with variation in SNF rates ranging from 0 to 77.8%. (Table 6) Hospitals in the highest quintile of SNF rate after AMI were most likely to be smaller bed-size non-teaching facilities, without on-site facilities for cardiac procedures. (Table 4)
Table 5.
Hospital characteristics, according to quintiles of hospital-level SNF rates following AMI hospitalization
| SNF rates | Overall | Lowest | 2 | 3 | 4 | Highest |
|---|---|---|---|---|---|---|
| 0-77.8 | 0-13.1 | 13.2-18.4 | 18.5-25.0 | 25.1-34.8 | 34.9-77.8 | |
| No. of hospitals | 2453 | 490 | 491 | 498 | 484 | 490 |
| Teaching | ||||||
| COTH | 258 (10.5) | 64 (13.0) | 82 (16.7) | 72 (14.4) | 33 (6.8) | 7 (1.4) |
| Teaching | 437 (17.8) | 113 (23.0) | 117 (23.0) | 87 (17.4) | 67 (13.8) | 53 (10.8) |
| Non-teaching | 1758 (71.6) | 313 (63.0) | 292 (59.4) | 339 (68.0) | 384 (79.3) | 430 (87.7) |
| Rural | 130 (5.3) | 10 (2.0) | 10 (2.0) | 18 (3.6) | 27 (5.6) | 65 (13.2) |
| Heart transplant hospital | 110 (4.5) | 39 (8.0) | 41 (8.3) | 21 (4.2) | 9 (1.9) | 0 (0.0) |
| Cath hospital | 1651 (67.0) | 392 (80.0) | 404 (82.2) | 382 (76.7) | 308 (63.6) | 165 (33.6) |
| PCI hospital | 1651 (67.0) | 392 (80.0) | 404 (82.2) | 382 (76.7) | 308 (63.6) | 165 (33.6) |
| CABG hospital | 1637 (66.7) | 391 (79.7) | 401 (81.0) | 378 (75.9) | 303 (62.6) | 164 (33.4) |
| Bedsize (mean, SD) | 259.5 (208) | 305.6 (212) | 335.7 (225) | 294.8 (242) | 211.1 (168) | 149.1 (107) |
| Ownership | ||||||
| non-profit | 1708 (69.6) | 271 (55.3) | 349 (71.0) | 356 (71.4) | 370 (76.4) | 362 (73.0) |
| private, for-profit | 429 (17.4) | 142 (28.9) | 80 (16.2) | 90 (18.0) | 58 (11.9) | 59 (12.0) |
| public | 316 (12.8) | 77 (15.7) | 62 (12.6) | 52 (10.4) | 56 (11.5) | 69 (14.0) |
| Census division | ||||||
| New England | 148 (6.0) | 2 (0.40) | 13 (2.6) | 20 (4.0) | 31 (6.4) | 82 (16.7) |
| Middle Atlantic | 345 (14.0) | 13 (2.7) | 35 (7.1) | 68 (13.6) | 96 (19.8) | 133 (27.1) |
| South Atlantic | 180 (7.3) | 53 (10.8) | 36 (7.3) | 33 (6.6) | 30 (6.2) | 28 (5.7) |
| East North Central | 456 (18.5) | 80 (16.3) | 91 (18.5) | 121 (24.2) | 106 (21.9) | 58 (11.8) |
| East South Central | 174 (7.1) | 19 (3.9) | 56 (11.4) | 35 (7.0) | 26 (5.4) | 38 (7.8) |
| West North Central | 422 (17.2) | 36 (7.3) | 74 (15.0) | 107 (21.4) | 104 (21.4) | 101 (20.6) |
| West South Central | 286 (11.6) | 134 (27.3) | 61 (12.4) | 31 (6.2) | 35 (7.2) | 25 (5.1) |
| Mountain | 132 (5.4) | 70 (14.2) | 36 (7.3) | 15 (3.0) | 10 (2.1) | 1 (0.20) |
| Pacific | 282 (11.4) | 55 (11.2) | 89 (18.1) | 68 (13.6) | 46 (9.5) | 24 (4.9) |
Abbreviations: AMI, acute myocardial infarction; CABG, coronary artery bypass graft surgery; COTH, Council of Teaching Hospitals; PCI, percutaneous coronary intervention, SD, standard deviation
p<0.0001 for all comparisons across quintiles using ANOVA for continuous variables and chi-square test for categorical variables
Table 6.
30-day risk-standardized readmission rate following AMI hospitalization, by quintile of SNF rate
| SNF rates | Overall | Lowest | 2 | 3 | 4 | Highest |
|---|---|---|---|---|---|---|
| 0-77.8 | 0-13.1 | 13.2-18.4 | 18.5-25.0 | 25.1-34.8 | 34.9-77.8 | |
| No. of hospitals | 2453 | 490 | 491 | 498 | 484 | 490 |
| Risk-standardized readmission rate | ||||||
| mean | 19.9 | 19.7 | 19.6 | 20.0 | 20.1 | 20.1 |
| standard deviation | 1.3 | 1.4 | 1.3 | 1.4 | 1.2 | 1.1 |
| median | 19.9 | 19.8 | 19.6 | 20.0 | 20.0 | 19.9 |
| minimum | 15.3 | 16.3 | 16.0 | 15.3 | 16.5 | 17.3 |
| maximum | 25.2 | 23.8 | 23.9 | 25.2 | 25.2 | 24.6 |
Patients admitted to hospitals in the highest quintile of SNF rates were likely to be older, female, and of white race compared with the lowest quintile (p<0.0001). (Table 4) There were significantly fewer patients of black or other race in the highest quintile of SNF rates compared with the lowest quintile (p<0.0001) Patients in hospitals in the highest quintile of SNF rates were significantly more likely to have comorbidities such as HF, anemia, history of infection, pneumonia, or dementia. (Table 4)
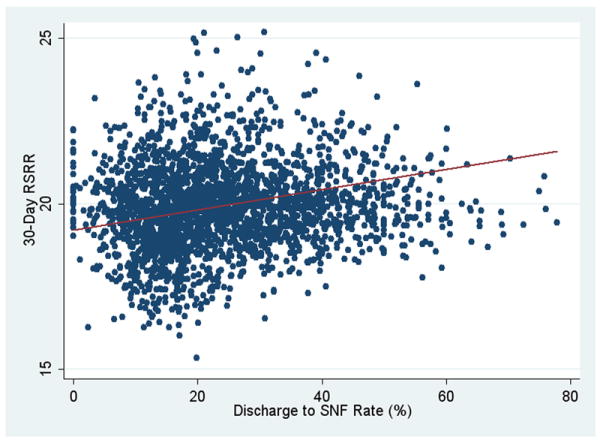
Overall, the mean 30-day RSRR after AMI was 19.9, (SD 1.3) and ranged from 15.3 to 25.2. The weighted correlation between SNF rate and RSRR after AMI was low, with an R2 of 0.04. In adjusted regression models, a very small relationship was observed with 0.03 percentage point higher RSRR after AMI with each percentage point increase in SNF rate (p <0.001), (e.g. a difference in SNF rate from 24.1% to 25.1% was associated with a difference in RSRR from 19.90% to 19.93%) (Figure 4).
Discussion
Our analysis demonstrated substantial hospital-level variation in rates of patients discharged to SNFs for Medicare patients hospitalized for AMI and HF. However, this variation was not, in turn, associated with clinically important differences in RSRRs.
Prior studies have demonstrated an unclear relationship between SNF care and readmission risk. Some patient-level studies[3, 4] reported that SNF care was associated with lower risk of readmission after HF, while a recent analysis of Medicare patients [8] found HF patients discharged to SNF had higher readmission rates. Our study found that higher hospital-level SNF rates were not correlated with lower RSRRs after HF admission, while for AMI hospitals with higher SNF rates were statistically associated with higher readmission rates; however, this relationship was small as SNF rates explained little (<4%) of the variation in RSRR after AMI.
Our use of hospital-level rather than patient-level analysis is unique in that it provides insight as whether a higher intensity of SNF referral can severe as a viable strategy for globally reducing readmission for HF and AMI. A hospital-level approach also answers the question of whether hospitals with limited access to SNF care are systematically disadvantaged in the CMS readmission measures for HF and AMI. The policy implication is that many hospitals appear to achieve low RSRRs regardless of high or low SNF rates, a finding of importance to hospitals, given that recent legislation will eventually reduce reimbursement to hospitals with excess readmission rates.[9] While we acknowledge that our study design is not able to prove causality (or lack of causality) between SNF rates and RSRR, our findings illustrate that low RSRRs after either HF or AMI can be attained by hospitals across a range of SNF rates, implying that the CMS readmission measures for HF and AMI are not systematically biased in favor of high or low SNF referring hospitals.
Several reasons may explain the lack of relationship between hospital SNF rates and RSRR for HF patients. First, SNFs likely vary in their readmission policies and on-site capabilities; some SNFs may prioritize for keeping patients out of the hospital while others have may favor readmitting patients with the slightest clinical complications. Second, SNF referral may not be closely related to RSRR if there were substantial variation in SNF quality. SNFs vary in quality in terms of mortality, development of pressure ulcers, and use of physical restraints.[10] If lower quality SNFs resulted in more post-hospitalization complications, this would mute the relationship between SNF rate and RSRR. Third, SNF referral may based on non-clinical factors such as hospital ownership of a SNF facility or distance to SNF, [11-14] obscuring the relationship between SNF care and readmission risk. Lastly, hospitals with low use of SNFs may employ other mechanisms to ensure that patients received adequate follow-up after discharge, such as home-health aides or visiting nurses, allowing these hospitals to achieve low RSRRs.
That higher SNF rates were associated with slightly higher RSRRs after AMI merits further discussion. AMI patients discharged from hospitals in the highest SNF quintile appeared to have more comorbidities, and may have been more medically complex, leading to a positive association between SNF rates and RSRR from residual confounding. Nevertheless, the relationship between increasing SNF rates and higher RSRR after AMI had limited explanatory power, implying that the impact of patient complexity was likely small. In contrast, for HF patients the differences in comorbidity between hospitals in the highest and lowest quintiles of SNF use was ≤5 percentage points; as such, one would not expect that higher SNF rates would be associated more medically complex patients that lead to higher RSRRs.
In our study, black and other non-white patients were more likely to be admitted to hospitals with lower SNF rates. This is consistent with a recent study examining racial differences in 30-day readmission after HF and AMI hospitalization in Medicare patients[15] where part of the higher risk of readmission for blacks was related to whether a hospital was predominately minority-serving, even after adjusting for discharge to SNF. These findings are consistent with our study suggesting that factors other than SNF use explain the differences in readmission rates between white and minority patients.
Our hospital-level analysis found almost no correlation between higher SNF rates and lower RSRR, suggesting there may be inefficiencies in the current use of SNF. However, one should not conclude from our findings that individual patients would not benefit from SNF care after HF or AMI hospitalization. Future studies using patient-level analysis of medical chart data would be better suited towards identifying particular patients would benefit from SNF care to reduce readmission risk. While we speculate that differences in quality of SNF care may explain the lack of relationship with readmission, additional work is needed to evaluate specific interventions for improving care surrounding the transition between hospitals and SNF.[16]
Our study was limited by its use of administrative data for case-mix adjustment. However, studies have shown that hospital-level estimates of risk-standardized readmission rates after HF or AMI hospitalization are similar whether derived from administrative claims or clinical data. [6, 7] Second, generalizing our findings to medical conditions other than HF and AMI may be limited. Third, we examined a cohort of elderly patients covered under fee-for-service Medicare; results from younger populations or different health insurances may differ. Lastly, data on the SNF characteristics regarding on-site facilities and staffing were not available.
A strength of our study is that we determined SNF use using Medicare SNF billing claims rather than hospital discharge disposition codes as in previous studies. [3, 4] The accuracy of discharge disposition recorded in hospital billing data has been estimated to be as low as 80%,[17] and as such SNF billing data provides a more accurate representation of a SNF episode given financial implications for reimbursement.
Conclusion
In conclusion, our study found considerable variation in hospital use of SNF referral for Medicare patients discharged for HF and AMI in contemporary medical practice. No significant relationship between hospital-level readmission rates and SNF rates was detected for HF patients after adjustment for hospital characteristics. There was a weak positive relationship between SNF rates and readmission rates for AMI patients; however, SNF rates explained less than 4% of the variation in readmission rates after AMI. Hospitals achieving low readmission rates for their HF and AMI patients had both high and low use of SNF.
Figure 1.
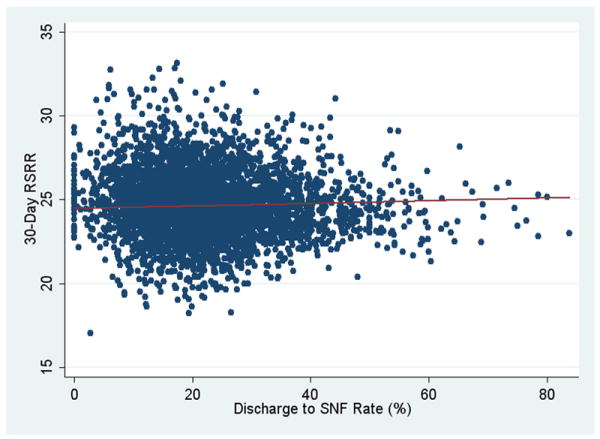
30-day heart failure risk-standardized readmission rate by skilled nursing facility rate
Acknowledgments
The analyses on which this publication is based were performed under Contract No. HHSM-500-2008-0025I (0001), entitled “Measure and Instrument Development and Support (MIDS)-Development and Re-evaluation of the CMS Hospital Outcomes and Efficiency Measures,” and HHSM-500-2008-00020I (0001), entitled “Production and Implementation of Hospital Outcome and Efficiency Measures” funded by the CMS, Department of Health and Human Services. The content of this publication does not necessarily reflect the views or policies of the Department of Health and Human Services. The authors assume full responsibility for the accuracy and completeness of the ideas presented.
Dr. Chen is supported by an Agency for Healthcare Research and Quality Career Development Award (1K08HS018781-01).Dr. Ross is supported by the National Institute on Aging (K08 AG032886) and by the American Federation of Aging Research through the Paul B. Beeson Career Development Award. Dr. Krumholz is supported by a National Heart Lung Blood Institute Cardiovascular Outcomes Center Award (1U01HL105270-01).
Footnotes
Conflict of Interest Statement: The analyses on which this publication is based were performed under contracts funded by the Centers for Medicare and Medicaid Services to the Yale Center for Outcomes Research and Evaluation which include Drs. Krumholz, Lin, Bernheim, and Drye. Drs. Ling, Han, and Rapp are employees of CMS. The remaining authors have no relevant financial conflicts of interest to report.
Author attestation: All authors had access to data and a role in writing the manuscript.
Publisher's Disclaimer: This is a PDF file of an unedited manuscript that has been accepted for publication. As a service to our customers we are providing this early version of the manuscript. The manuscript will undergo copyediting, typesetting, and review of the resulting proof before it is published in its final citable form. Please note that during the production process errors may be discovered which could affect the content, and all legal disclaimers that apply to the journal pertain.
References
- 1.Mor V, Intrator O, Feng Z, Grabowski DC. The revolving door of rehospitalization from skilled nursing facilities. Health Aff (Millwood) 2006;29(1):57–64. doi: 10.1377/hlthaff.2009.0629. [DOI] [PMC free article] [PubMed] [Google Scholar]
- 2.Hernandez AF, Greiner MA, Fonarow GC, et al. Relationship between early physician follow-up and 30-day readmission among Medicare beneficiaries hospitalized for heart failure. JAMA. 2010;303(17):1716–22. doi: 10.1001/jama.2010.533. [DOI] [PubMed] [Google Scholar]
- 3.Kane RL, Chen Q, Finch M, Blewett L, Burns R, Moskowitz M. The optimal outcomes of post-hospital care under medicare. Health Serv Res. 2000;35(3):615–61. [PMC free article] [PubMed] [Google Scholar]
- 4.Philbin EF, DiSalvo TG. Prediction of hospital readmission for heart failure: development of a simple risk score based on administrative data. J Am Coll Cardiol. 1999;33(6):1560–6. doi: 10.1016/s0735-1097(99)00059-5. [DOI] [PubMed] [Google Scholar]
- 5.Public Law 111 - 148 - Patient Protection and Affordable Care Act. (H.R. 3590) [July 18, 2010];2010 Available at http://www.gpo.gov/fdsys/pkg/PLAW-111publ148/content-detail.html.
- 6.Krumholz HM, Wang Y, Mattera JA, et al. An administrative claims model suitable for profiling hospital performance based on 30-day mortality rates among patients with an acute myocardial infarction. Circulation. 2006;113(13):1683–92. doi: 10.1161/CIRCULATIONAHA.105.611186. [DOI] [PubMed] [Google Scholar]
- 7.Krumholz HM, Wang Y, Mattera JA, et al. An administrative claims model suitable for profiling hospital performance based on 30-day mortality rates among patients with heart failure. Circulation. 2006;113(13):1693–701. doi: 10.1161/CIRCULATIONAHA.105.611194. [DOI] [PubMed] [Google Scholar]
- 8.Allen LA, Hernandez AF, Peterson ED, et al. Discharge to a Skilled Nursing Facility and Subsequent Clinical Outcomes Among Older Patients Hospitalized for Heart Failure. Circulation: Heart Failure. 2011 doi: 10.1161/CIRCHEARTFAILURE.110.959171. [DOI] [PMC free article] [PubMed] [Google Scholar]
- 9.U.S. Congress: Patient Protection and Affordable Care Act (H.R. 3590) Section 3025. Available at http://thomas.loc.gov/cgi-bin/query/z?c111:H.R.3590:
- 10.Zinn JS, Aaronson WE, Rosko MD. Variations in the Outcomes of Care Provided in Pennsylvania Nursing Homes: Facility and Environmental Correlates. Medical Care. 1993;31(6):475–487. doi: 10.1097/00005650-199306000-00001. [DOI] [PubMed] [Google Scholar]
- 11.Kane RL, Lin WC, Blewett LA. Geographic variation in the use of post-acute care. Health Serv Res. 2002;37(3):667–82. doi: 10.1111/1475-6773.00043. [DOI] [PMC free article] [PubMed] [Google Scholar]
- 12.Buntin MB, Garten AD, Paddock S, Saliba D, Totten M, Escarce JJ. How much is postacute care use affected by its availability? Health Serv Res. 2005;40(2):413–34. doi: 10.1111/j.1475-6773.2005.00365.x. [DOI] [PMC free article] [PubMed] [Google Scholar]
- 13.Blewett LA, Kane RL, Finch M. Hospital ownership of post-acute care: does it increase access to post-acute care services? Inquiry. 1995;32(4):457–67. [PubMed] [Google Scholar]
- 14.White C, Seagrave S. What happens when hospital-based skilled nursing facilities close? A propensity score analysis. Health Serv Res. 2005;40(6 Pt 1):1883–97. doi: 10.1111/j.1475-6773.2005.00434.x. [DOI] [PMC free article] [PubMed] [Google Scholar]
- 15.Joynt KE, Orav EJ, Jha AK. Thirty-Day Readmission Rates for Medicare Beneficiaries by Race and Site of Care. JAMA: The Journal of the American Medical Association. 305(7):675–681. doi: 10.1001/jama.2011.123. [DOI] [PMC free article] [PubMed] [Google Scholar]
- 16.Halasyamani L, Kripalani S, Coleman E, et al. Transition of care for hospitalized elderly patients--development of a discharge checklist for hospitalists. J Hosp Med. 2006;1(6):354–60. doi: 10.1002/jhm.129. [DOI] [PubMed] [Google Scholar]
- 17.OIG work plan puts spotlight on discharge and transfer patterns. Hospital Case Management. 2001 December 1; [PubMed] [Google Scholar]