

Abstract
OBJECTIVE
Studies have suggested that non-phase-locked event-related oscillations (ERO) in target stimulus processing might provide biomarkers of alcoholism. This study investigates the discriminatory power of non-phase-locked oscillations in a group of long-term abstinent alcoholics (LTAAs) and non-alcoholic controls (NACs).
METHODS
EEGs were recorded on 48 LTAAs and 48 age and gender comparable non-alcoholic controls (NACs) during rest with eyes open (EO) and during the performance of a 3-condition visual target detection task. The data were analyzed to extract resting power, ERP amplitude and non-phase-locked ERO power measures. Data were analyzed using MANCOVA to determine the discriminatory power of induced θ ERO vs. resting θ power vs. P300 ERP measures in differentiating the LTAA and NAC groups.
RESULTS
Both group showed significantly more θ power in the pre-stimulus reference period of the task vs. the resting EO condition. The resting θ power did not discriminate the groups, while the LTAAs showed significantly less pre-stimulus θ power vs. the NACs. The LTAAs showed a significantly larger θ event-related synchronization (ERS) to the target stimulus vs. the NACs, even after accounting for pre-stimulus θ power levels. ERS to non-target stimuli showed smaller induced oscillations vs. target stimuli with no group differences. Alcohol use variables, a family history of alcohol problems, and the duration of alcohol abstinence were not associated with any θ power measures.
CONCLUSION
While reference θ power in the task and induced θ oscillations to target stimuli both discriminate LTAAs and NACs, induced θ oscillations better discriminate the groups. Induced θ power measures are also more powerful and independent group discriminators than the P3b amplitude.
SIGNIFICANCE
Induced frontal θ oscillations promise to provide biomarkers of alcoholism that complement the well-established P300 ERP discriminators.
Keywords: EEG, Event-related oscillations, Event-related synchronization, Induced oscillations, Alcoholism, Biomarker
INTRODUCTION
Event-related oscillations (EROs) provide a complementary index of brain function to more traditional event-related potential (ERP) measures (Pfurtscheller and Lopes da Silva, 1999). EROs have been investigated as potential biomarkers of alcoholism or endophenotypic markers of the vulnerability to alcoholism. (Jones et al., 2006; Kamarajan et al., 2006; Kamarajan et al., 2004; Porjesz and Begleiter, 2003; Rangaswamy et al., 2007). EROs can be distinguished depending on whether they are or are not phase-locked to the stimulus (Pfurtscheller and Lopes da Silva, 1999). Quantified in the time/frequency domain, oscillatory activity that is phase-locked to the stimulus is referred to as evoked power, while changes of non-phase-locked activity can reflect decreases or increases in power (relative to the pre-stimulus period), referred to as event-related desynchronizations (ERD) or event-related synchronizations (ERS) respectively, the latter of which are also called induced oscillations.
Utilizing a similar methodology to Jones et al. (2006) and Rangaswamy et al. (2007), Andrew and Fein (In Press) analyzed evoked and total δ / θ event-related (ERO) power during a visual oddball task performed by long-term abstinent alcoholics (LTAAs) and non-alcoholic controls (NACs). Delta and theta frequency bands were selected for this analysis as the P3 ERP components were shown to be composed primarily of evoked power in these frequency bands (Jones et al., 2006; Rangaswamy et al., 2007). It was shown that, similarly to the P3b amplitude which is significantly reduced in the LTAA group (Fein and Chang, 2006), the δ evoked ERO power to target stimulus shows a significant reduction in the LTAA group compared to the NAC group. With appropriate statistical analyses, it was found that the evoked ERO power measures provided a different, but not independent representation of the differences than did the P300 ERP measures
In contrast to the evoked ERO power findings, Andrew and Fein (In Press) presented results that gave a weak indication that total θ ERO power provided additional discriminatory information beyond ERP measures for differentiating the LTAA and NAC groups. As total ERO power contains both evoked and non-phase-locked activity, the evoked θ power may dilute an effect of induced power in the total θ ERO power. While the evoked δ and θ ERO power were spatially localized over the parietal region, similar to the posterior localization of the P3b amplitude, the total θ ERO power had a more anterior localization.
The importance of analyzing event-related phase-locked and non-phase-locked θ oscillations separately has been raised by a number of researchers (Bastiaansen and Hagoort, 2003; Klimesch et al., 1998). Deiber et al. (2007) investigated phase-locked and non-phase-locked θ power separately during a visual oddball detection task, and reported evoked θ activity phase-locked to the stimulus and localized to the parieto-occipital region. In parallel, induced θ oscillations in the form of an ERS over the frontal region was found. The induced oscillations were modulated by task demand, where increased working memory load and / or attentional demand resulted in a larger frontal ERS. These results concur with the general finding in task-related studies that show increased levels of θ ERS with increasing task demands (Klimesch, 1996, 1999; Pfurtscheller, 1992). A number of studies have reported increasing levels of θ synchronization as a function of working memory load (Gevins et al., 1997; Jensen and Tesche, 2002; Krause et al., 2000; McEvoy et al., 2001). Missonnier et al. (2006) investigated the relative contribution of attentional demand and working memory on frontal θ ERS in a visual detection task and concluded that “phasic θ response over frontal regions primarily reflects the activation of neural networks involved in allocation of attention related to target stimuli rather than working memory processes”.
The findings of our previous study (Andrew and Fein, In Press) and reports in the literature on induced θ oscillations over frontal regions during target detection tasks (Deiber et al., 2007; Klimesch, 1996, 1999; Klimesch et al., 1998; Krause et al., 2000; Missonnier et al., 2006), led us to hypothesize that induced θ oscillations significantly discriminated the LTAA and NAC groups, and provide additional information beyond ERP measures for discriminating the groups. To investigate this hypothesis, we applied ERO analysis methods that directly measure non-phase-locked event-related EEG activity (Kalcher and Pfurtscheller, 1995) to the data from our previous study (Andrew and Fein, In Press).
METHODS
Only brief descriptions of the subject selection methodology, the experimental paradigm and the EEG acquisition methods are provided here. The reader is referred to Fein and Chang (2006) and Andrew and Fein (In Press) for a more detailed description of this methodology.
Subjects
The subjects in the study sample comprised LTAAs and age and gender comparable NACs (statistical comparison indicated no significant age difference between groups). Each experimental group consisted of 23 females and 25 males aged 35 to 58 (mean = 46.3, SD = 6.8). LTAA subjects were selected for the study only if they met DSM-IV (American Psychiatric Association, 2000) criteria for alcohol dependence and had been abstinent for at least six months. NACs participants were recruited if they did not meet lifetime criteria for alcohol abuse or dependence, had a lifetime drinking average of less than 30 drinks/mo and never drank more than 60 drinks/mo.
Alcohol use history was assessed using the timeline follow-back methodology of the Lifetime Drinking History questionnaire (Skinner and Allen, 1982; Sobell and Sobell, 1990). This provided alcohol use variables for lifetime use and the duration of abstinence. The density of a family history of alcohol problems was assessed using the family history drinking questionnaire (Mann et al., 2005). The family history density (FHD) measure was the proportion of first-degree relatives who had alcohol problems.
Visual Oddball Experimental Paradigm
A standard visual oddball experiment, implemented on the E-prime software system (Psychology Software Tools Inc., Pittsburgh, USA), was utilized for the EEG recordings. The task consisted of the presentation of three types of visual stimuli, these being standard non-target stimuli (N = 210), rare non-target stimuli (N = 35) and target stimuli (N = 35). The subjects were instructed not to respond to the standard and rare non-target stimuli, and to press a response box button as quickly as possible when presented with a target stimulus.
EEG Acquisition
EEG was acquired on either a 32-channel (N = 7 subjects), a 40-channel (N = 81 subjects) or a 64-channel system (N = 8 subjects). The 32 and 40-channel recordings utilized the NuAmps single-ended, 32/40-channel amplifier and Scan 4.2 Acquisition software (Compumedics Neuroscan Inc., El Paso, USA), while the 64-channel system used the SynAmps2 amplifier and Scan 4.3 acquisition software (Compumedics Neuroscan Inc., El Paso, USA). Checks were carried out to ensure that between-amplifier comparisons were valid, as reported in Fein and Chang (2006).
A right ear reference electrode was used for all recordings. The ground electrode was placed 4 cm above the nasion for the 32-channel and 40-channel caps, and 8 cm above the nasion for the 64-channel caps. Electrode site impedances were kept below 10 kΩ for all recordings. A vertical electro-oculogram (EOG) was recorded from a bipolar electrode site pair placed above and below the left eye for use in offline reduction of ocular artifacts. The EEG and EOG channels were sampled at 250 Hz and stored for offline analysis.
In addition to recording the EEG while the subject performed the visual oddball task, three minutes of resting, eyes open (EO) EEG was recorded at the start of the session as a baseline recording.
EEG Analysis
The Brain Vision Analyzer package (BVA, Brain Products, Munich, Germany) and the open-source, MATLAB-based EEGLAB Toolbox (Delorme and Makeig, 2004) was used for data analysis. BVA was utilized for pre-processing of the data, computation of ERP waveforms and extraction of the peak amplitudes of the ERP components, while EEGLAB was used for computation of event-related time-frequency representations (TFRs) and extraction of event-related power measures from these TFRs, with additional functionality added to the toolbox as required.
Artifacts were removed using the Gratton and Coles method implemented in BVA (Gratton et al., 1983). Data were highpass filtered with a cutoff frequency of 0.5 Hz using a zero-phase lag filter with a 48 dB/octave roll-off. Stimulus-locked trials were extracted for all instances where there was a correct behavioral response, for each of the three experimental conditions (target, rare non-target and standard non-target). Each trial comprised 450ms of data pre-stimulus and 1300ms post-stimulus. For ERP analysis, data were lowpass filtered with a cutoff frequency of 30 Hz using a zero-phase lag filter with a 48 dB/octave roll-off and baseline corrected using the 100ms pre-stimulus interval. Any trials containing out of range voltages (± 75 μV) were rejected as artifacts and excluded from further processing. Current source density (CSD) derivations were computed using a 4th order spherical spline and a maximum degree of the Legendre polynomial of 10 (Perrin et al., 1989). All further analysis were applied to both nose-referenced and CSD derivations.
ERP waveforms were extracted by synchronously averaging all trials having the correct behavioral responses for each of the three stimuli (target, rare non-target and standard non-target). For each subject, the P3b ERP peak at electrode site Pz for the target stimulus and the P3a ERP peak at electrode site FCz for the rare non-target stimulus were extracted using a semi-automated peak detection algorithm in BVA. Only the P3b and P3a peaks at electrode sites Pz and FCz respectively were extracted for use in this study, as previous studies on this data had found these ERP amplitudes significantly discriminated the LTAAs and NACs (Fein and Chang, 2006).
TFRs were computed from the trials having the correct behavioral responses for each of the stimuli types (target, rare non-target and standard non-target). TFRs were computed using two different methods, namely the Stockwell Transform (ST) and the Short-time Fourier Transform (STFT). The ST methodology is the same as utilized in Jones et al. (2006), Rangaswamy et al. (2007) and Andrew and Fein (In Press), and the reader is referred to these papers for a detailed account of this methodology. STFT methodology has been widely applied to event-related EEG data (Makeig, 1993; Pfurtscheller and Andrew, 1999). For the STFT method, a window length comprising 128 data points (corresponding to 512 ms), a zero-padding factor of 4 and pre-windowing of the data with a Hanning window were utilized for estimation of the power spectrum at each time point in the TFR.
For computation of the TFRs, the trial-averaged ERP waveform was first subtracted from each single trial data before being transformed to the time-frequency domain utilizing the ST or STFT, resulting in a complex-valued TFR for each trial. The absolute power for each single-trial TFR was then calculated by taking the square of the magnitude of the complex-valued TFR for each trial and these were then averaged across all trials to produce the resultant TFR. This method of computing the event-related TFR produces a time-frequency distribution of the non-phase-locked power in the event-related trials, and is similar to the time-domain inter-trial variance method introduced by Kalcher and Pfurtscheller (1995) that produces a time course of non-phase-locked power within a predefined frequency band by first removing contributions of the phase-locked activity in this band. In the current study, the event-related TFRs produced in this way are termed even-related non-phase-locked TFRs or ERONPL TFRs to differentiate them from the event-related evoked TFRs (EROEVK TFRs) and event-related total TFRs (EROTOT TFRs) quantified in the previously studies (Andrew and Fein, In Press; Jones et al., 2006; Rangaswamy et al., 2007),. One ERONPL TFR was produced for each subject, for each electrode site, for each TFR method (ST vs. STFT) and for each stimulus type (target vs. rare non-target vs. standard non-target). Grand average ERONPL TFRs across groups for each electrode site, TFR method and stimulus type were computed.
Post-stimulus time-frequency regions of interest (TFROI) were selected based on visual inspection of the grand average TFRs for each of the stimulus types and at selected midline electrode sites of interest (MESOI), these being Fz, FCz, Cz, CPz and Pz. The absolute θ power was computed as the average power within the post-stimulus TFROI. A corresponding pre-stimulus TFROI was also defined, having the same frequency band as the post-stimulus TFROI, but with a time window preceding that of the stimulus onset. The average power within this pre-stimulus TFROI was utilized as a reference for comparing event-related changes in post-stimulus power, and is referred to as the reference θ power. The post-stimulus relative θ power is computed either as the relative percentage change of the θ power to the reference θ power i.e.
| Equation 1 |
or by calculating the log ratio of the absolute θ power to the reference θ power, i.e.
| Equation 2 |
Grand average topographical maps across groups were computed for each of the ERONPL θ power measures (reference, absolute and relative).
Relative power time courses and topographical map series in the θ band were obtained by computing the average absolute θ power at each time point in the ERONPL TFRs, and normalizing this by the relative θ power using either Equation 1 or 2. Relative percentage power time courses (Equation 1) are a typical way of displaying ERO dynamics in the literature and are referred to as ERD / ERS time courses (Pfurtscheller and Lopes da Silva, 1999). Time courses displayed as log ratios of the absolute power at a particular time point relative to the reference power (Equation 2) have also been utilized in the literature. Makeig (1993) refers to these as the event-related spectral perturbation (ERSP).
To investigate θ power recorded at rest with EO, Fourier-transform (FT)-based spectral analysis1 was applied to the EO resting data. The resting data were first corrected for ocular artifacts (Gratton et al., 1983). The data were then divided into non-overlapping segments of 128 data points (corresponding to 512 ms and matching the segment length utilized in the computation of the STFT-based event-related TFRs for the oddball task). Any segments containing out of range voltages (± 75 μV) were rejected as artifacts. A Hanning windowed was applied to each segment and the segment was zero-padded with additional 384 data points (matching the windowing and zero-padding applied in the STFT-based event-related TFR computation for the oddball task), and the complex-valued Fourier transform of the zero-padded, windowed data in each segment was computed. The square of the magnitude of each single-segment complex-valued spectrum was then computed and averaged across all segments. Theta band power was computed from the resting power spectra by computing the average power within the same θ frequency band as used for the event-related power measures in the task.
As all analyses were applied to midline electrodes and as none of these lie are on the periphery of the montage, there were no problems with potential artifacts in CSD computations due to montage edge effects.
Statistical Analysis
SPSS (SPSS Inc., Chicago, USA) was utilized for all statistical analyses. The logarithmic transform of the resting, relative and absolute θ power were utilized in all analyses as these had univariate normal distributions2. For the relative θ power measures, the log ratio measures (Equation 2) rather than the percentage change measures (Equation 1) were used, as the log ratios were normally distributed.
Two-way multivariate analyses of variance (MANOVAs) were used separately for the reference, absolute and relative θ power measures. The respective θ power measures at the MESOIs were the multiple dependent variables, with group (NACs vs. LTAAs) as the between-subjects variable and stimulus (target vs. rare non-target vs. standard non-target) as the repeated-measures variable. Planned repeated contrasts were used to investigate significant stimulus effects. Additional one-way MANOVAs and multivariate analyses of covariance (MANCOVAs) were used to investigate the group effect for each level of stimulus. For the MANCOVA analyses, the P3b amplitude at electrode site Pz was used as the covariate in the analysis. The choice of this ERP amplitude component was based on previous findings on this data that showed that it was the best discriminator of the two groups (Andrew and Fein, in preparation), (Fein and Chang, 2006). The reference θ power measures at MESOIs were also used together with the P3b amplitude as covariates for the MANCOVA on relative θ power measures. For all MANOVAs (MANCOVAs), separate analyses were applied for the power measures derived from ST-based and STFT-based TFRs so that the sensitivity of results to the TFR method could be checked.
The associations between subject variables (i.e., alcohol use, duration of abstinence and family history density) and the pre-stimulus reference and the relative θ power at MESOIs that showed the largest group effect were investigated using Spearman’s correlations.
A two-way MANOVA was applied to the task reference and resting EO θ power, with the average pre-stimulus reference θ power across all three stimulus types used as the task reference θ power in the analysis. The reference θ power measures were derived from the STFT-based TFRs, so that they could be directly compared with the FT-based resting θ power measures. The θ power measures at the MESOIs were the multiple dependent variables, with group (NACs vs. LTAAs) as the between-subjects variable and condition (resting vs. task) as the repeated-measures variable.
For all MANOVAs (MANCOVA) performed, the Pillai-Bartlet trace was used as the test statistic. Mauchly’s tests of sphericity were carried out on the repeated measures variables, and where violated, Greenhouse-Geisser correction to the degrees of freedom was applied. Follow-up analyses were performed to investigate significant MANOVA (MANCOVA) effects. Univariate ANOVAs (ANCOVAs), with each of the dependent variables taken independently, and discriminant analyses, with the dependent variables taken as the predictors in the discriminant function, were used for these post-hoc analyses. Bonferroni corrections for multiple comparisons were not applied to any of the analyses.
RESULTS
Results for both nose-referenced and CSD derivations were similar, discounting a recording reference contribution to the findings. Only results for the nose-reference data are presented.
(i) ERONFL TFRs and θ-band ERS time courses
Figure 1 shows the grand average ERONPL TFRs at electrode site FCz for the target stimulus during task performance. The grand average TFRs shown were computed using the ST method.
Figure 1.
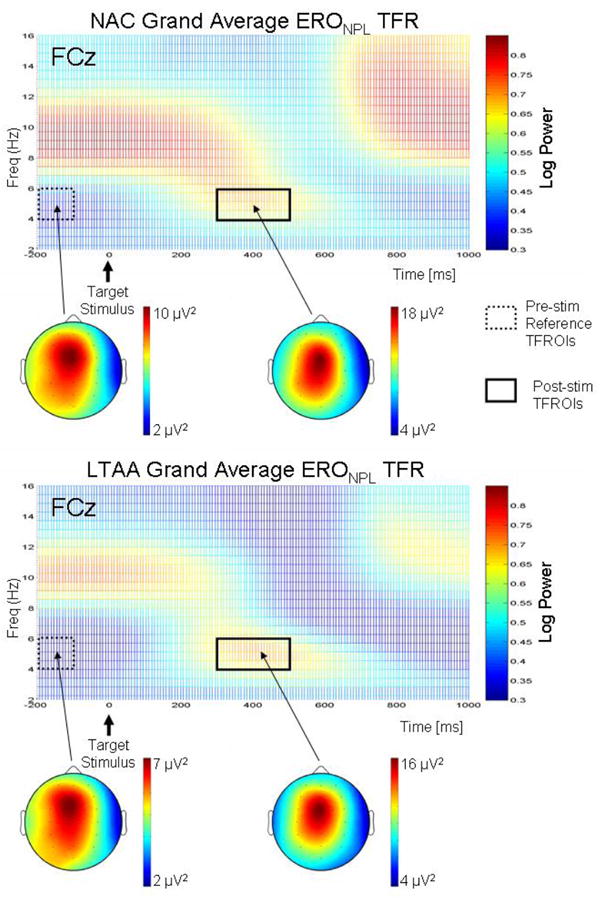
Grand average ERONPL TFRs for NACs (top plot) and LTAAs (bottom plot) at electrode site FCz for the target stimulus. The TFRs were computed using the ST method. Power in the TFRs is displayed on a logarithmic scale and the scale is the same for both TFRs. The locations of the pre-stimulus and post-stimulus TFROIs are indicated on the TFRs. Topographical maps for the pre- and post-stimulus TFROIs are shown for each group below the corresponding TFR. The scales for each map are different so as to clearly indicate the maximum of the spatial distribution for the reference and absolute theta θ power.
The spectro-temporal dynamics revealed in the grand average TFRs show that within the θ frequency band, a short-lasting synchronization of activity (i.e. an induced θ oscillation) occurs between about 200 ms to 600 ms. Based on visual inspection of STFT and ST grand average TFRs across MESOIs, a post-stimulus TFROI for this θ ERS was selected with lower and upper frequency bounds of 4 Hz and 6 Hz respectively, and upper and lower time bounds of 300 ms and 550 ms respectively. The corresponding pre-stimulus reference TFROI has the same frequency band as the post-stimulus TFROI, with the lower and upper time bounds of -200 ms and -100 ms respectively (the TFROIs are shown overlaid on the TFRs in Figure 1).
Grand average topographical maps for the reference and absolute θ power measures are displayed underneath the TFRs for each of the NAC and LTAA groups in Figure 1. The maps show that the spatial distribution of both reference and absolute θ power are localized over the midline fronto-central region around electrode site FCz.
Figure 2 show group comparisons (NAC vs. LTAA) of the grand average relative θ power time courses at electrode site FCz for the target (1st row), rare non-target (2nd row) and standard non-target (3rd row) stimuli. The LTAAs show, on average, a larger increase in θ power in response to the target stimulus (i.e. larger θ ERS or induced oscillation) compared to the NACs. The grand average peak ERS for the LTAAs is 217%, while the grand average ERS maximum is 138% in the NACs. Grand average topographical (ERS) maps are also shown for the time point corresponding to the ERS peak for each of the NAC and LTAA groups. These spatial maps show that the ERS has a spatial peak over the centro-parietal region for the NACs, while for the LTAAs, the ERS is localized more over the fronto-central region. On average, the θ ERS for the NACs and LTAAs for the non-target stimuli do not show large difference between the NACs and LTAAs. Comparison across the three stimulus types shows that the induced oscillations are largest for the target stimulus compared to the non-target stimuli.
Figure 2.
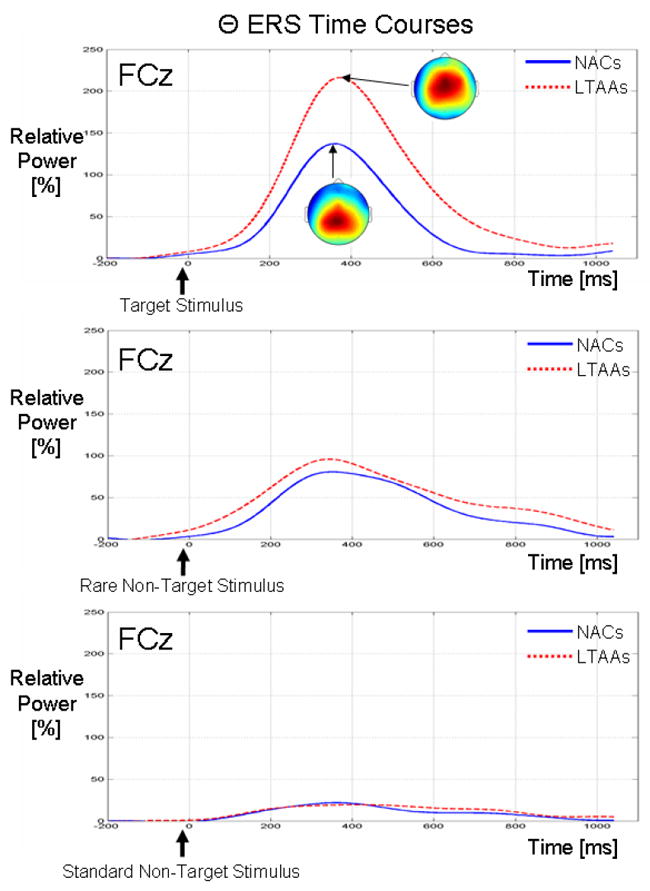
Group comparisons of the theta-band relative power (i.e. ERS) time courses at electrode site FCz for the target (top plot), rare non-target (middle plot) and standard non-target (bottom plot) stimuli. The time courses were computed from the STFT-based ERONPL TFRs by averaging the power within the θ band defined by the TFROIs. The scales are the same for all three sets of time courses. Topographical maps for each group are shown at the peak of the ERS time course. The scales for the maps are different so as to clearly illustrate the location of the maximum of the spatial distribution of the relative θ power. For the NACs, the scale on the topographical maps ranges from 40% (blue) to 160% (red), while for the LTAAs, the scale is from 50% to 200%.
(ii) Group and stimulus comparisons for the ERONFL θ power measures
The results of the separate two-way MANOVAs on the reference, absolute and relative θ power measures are shown in Table 1. The results shown are for θ power measures derived using the ST TFR method only. The results for the STFT method are not shown as they were similar to the ST method, indicating that the analysis is not sensitive to the TFR method utilized.
Table 1.
Two-way MANOVA results for the reference, absolute and relative θ power. The respective θ power measure at MESOIs is the dependent variables, with group (NACs vs. LTAAs) as the between-subjects independent variable and stimulus (target vs. rare non-target vs. standard non-target) as the repeated-measures independent variable. Post-hoc two-way ANOVA results for each of the dependent variables taken on their own is shown below the overall MANOVA result.
| NAC
|
LTAA
|
Effect Sizes (% of Variance)
|
|||||||
|---|---|---|---|---|---|---|---|---|---|
| Standard Non-Target | Rare Non-Target | Target | Standard Non-Target | Rare Non-Target | Target | Group | Stimulus | Group* Stimulus | |
| Reference θ Power 2-Way MANOVA | 16.8** | 14.7 | 6.1 | ||||||
|
|
|||||||||
| Mean Log Power
|
|||||||||
| Ref θ Power at Fz | 0.933 | 0.939 | 0.923 | 0.843 | 0.825 | 0.818 | 5.7** | 1.8 | 0.9 |
| Ref θ Power at FCz | 0.972 | 0.983 | 0.964 | 0.861 | 0.854 | 0.838 | 9.7** | 2.2 | 0.6 |
| Ref θ Power at Cz | 0.946 | 0.954 | 0.937 | 0.826 | 0.822 | 0.811 | 10.5*** | 1.5 | 0.2 |
| Ref θ Power at CPz | 0.913 | 0.920 | 0.904 | 0.799 | 0.794 | 0.787 | 9.8** | 1.1 | 0.3 |
| Ref θ Power at Pz | 0.884 | 0.883 | 0.875 | 0.767 | 0.760 | 0.760 | 9.9** | 0.4 | 0.1 |
|
| |||||||||
| Absolute θ Power 2-Way MANOVA | 12.1* | 80.2*** | 23.9** | ||||||
|
|
|||||||||
| Mean Log Power
|
|||||||||
| Abs θ Power at Fz | 0.993 | 1.103 | 1.138 | 0.892 | 1.018 | 1.155 | 2.5 | 56.4*** | 11.3*** |
| Abs θ Power at FCz | 1.024 | 1.152 | 1.216 | 0.915 | 1.052 | 1.210 | 4.3* | 68.1*** | 10.6*** |
| Abs θ Power at Cz | 0.996 | 1.122 | 1.201 | 0.876 | 1.011 | 1.173 | 6.4* | 67.6*** | 7.7*** |
| Abs θ Power at CPz | 0.951 | 1.057 | 1.170 | 0.841 | 0.949 | 1.115 | 7.6** | 63.7*** | 2.7 |
| Abs θ Power at Pz | 0.908 | 0.993 | 1.110 | 0.800 | 0.874 | 1.029 | 9.6** | 58.6*** | 1.1 |
|
| |||||||||
| Relative θ Power 2-Way MANOVA | 11.5* | 78.8*** | 23.4*** | ||||||
|
|
|||||||||
| Mean Log Ratios
|
|||||||||
| Rel θ Power at Fz | 0.061 | 0.164 | 0.215 | 0.049 | 0.193 | 0.337 | 5.7* | 54.2*** | 10.1*** |
| Rel θ Power at FCz | 0.052 | 0.170 | 0.251 | 0.055 | 0.198 | 0.372 | 7.0** | 64.8*** | 9.6*** |
| Rel θ Power at Cz | 0.050 | 0.168 | 0.265 | 0.050 | 0.189 | 0.361 | 4.0 | 63.8*** | 6.2** |
| Rel θ Power at CPz | 0.038 | 0.137 | 0.266 | 0.042 | 0.155 | 0.328 | 1.9 | 60.1*** | 2.0 |
| Rel θ Power at Pz | 0.025 | 0.110 | 0.235 | 0.032 | 0.114 | 0.268 | 0.6 | 54.1*** | 0.6 |
Effect is significant:
p ≤ 0.05;
p ≤ 0.01;
p ≤ 0.001.
(a) Reference θ power
For the reference θ power, the group effect is significant (F(5,90) = 3.634; p = 0.005), while the stimulus and group × stimulus effects are not. The overall group effect accounts for 16.8% of the variance, with the LTAAs showing less reference θ power than the NACs on average across all three stimulus types.
The insignificant group × stimulus interaction indicates that the pattern of group effects at each level of stimulus is the same. Separate one-way between-subjects MANOVAs for each level of stimulus confirmed this finding, showing significant group effects for the target, rare non-target and standard non-target stimuli, with less reference θ power in the LTAAs vs. the NACs (Table 2 shows the one-way MANOVA results for the reference θ power for the target stimulus). Post-hoc analyses on the significant group effects showed that the effect was significant at all MESOIs, with the largest effects on average across the three stimulus types being at central and parietal electrode sites.
Table 2.
One-way MANOVA and MANCOVA results for the reference (target stimulus) and relative θ power. The respective θ power measure at MESOIs is the dependent variables and group (NACs vs. LTAAs) is the between-subjects independent variable. The covariates are either the P3b amplitude at Pz taken on its own or the P3b together with the reference θ power measures at each of the MESOIs. Post-hoc one-way ANOVA (ANCOVA) results for each of the dependent variables taken on their own is shown below the overall MANOVA (MANCOVA) result.
| NAC
|
LTAA
|
Effect Sizes (% of Variance)
|
|
|---|---|---|---|
| Target | Target | Group | |
| Reference θ Power (Target) 1-Way MANOVA | 14.9* | ||
|
|
|||
| Mean Log Power
|
|||
| Ref θ Power at Fz | 0.923 | 0.818 | 5.3* |
| Ref θ Power at FCz | 0.964 | 0.838 | 9.9** |
| Ref θ Power at Cz | 0.937 | 0.811 | 10.1** |
| Ref θ Power at CPz | 0.904 | 0.787 | 8.7** |
| Ref θ Power at Pz | 0.875 | 0.760 | 8.6** |
| Reference θ Power (Target) 1-Way MANCOVA with covariate: | 11.8* | ||
| P3b Amplitude at Pz | |||
|
|
|||
| Marginal Mean Log Power
|
|||
| Ref θ Power at Fz | 0.914 | 0.826 | 3.6 |
| Ref θ Power at FCz | 0.956 | 0.846 | 7.3** |
| Ref θ Power at Cz | 0.927 | 0.821 | 7.1** |
| Ref θ Power at CPz | 0.895 | 0.796 | 6.1* |
| Ref θ Power at Pz | 0.865 | 0.771 | 5.6* |
|
| |||
| Relative θ Power (Target) 1-Way MANOVA | 20.1*** | ||
|
|
|||
| Mean Log Ratio
|
|||
| Rel θ Power at Fz | 0.215 | 0.337 | 14.4*** |
| Rel θ Power at FCz | 0.251 | 0.372 | 14.6*** |
| Rel θ Power at Cz | 0.265 | 0.361 | 8.9** |
| Rel θ Power at CPz | 0.266 | 0.328 | 3.2 |
| Rel θ Power at Pz | 0.235 | 0.268 | 0.9 |
| Relative θ Power (Target) 1-Way MANCOVA with covariate: | 21.6*** | ||
| P3b Amplitude at Pz | |||
|
|
|||
| Marginal Mean Log Ratio
|
|||
| Rel θ Power at Fz | 0.212 | 0.341 | 14.8*** |
| Rel θ Power at FCz | 0.243 | 0.380 | 17.3*** |
| Rel θ Power at Cz | 0.256 | 0.369 | 11.2*** |
| Rel θ Power at CPz | 0.255 | 0.339 | 5.6** |
| Rel θ Power at Pz | 0.225 | 0.279 | 2.4 |
| Relative θ Power (Target) 1-Way MANCOVA with covariates:- | 15.2* | ||
| P3b Amplitude at Pz | |||
| Ref θ Power at Fz | |||
| Ref θ Power at FCz | |||
| Ref θ Power at Cz | |||
| Ref θ Power at CPz | |||
| Ref θ Power at Pz | |||
|
|
|||
| Marginal Mean Log Ratio
|
|||
| Rel θ Power at Fz | 0.226 | 0.327 | 13.1*** |
| Rel θ Power at FCz | 0.262 | 0.362 | 12.2*** |
| Rel θ Power at Cz | 0.272 | 0.354 | 7.3** |
| Rel θ Power at CPz | 0.268 | 0.326 | 3.3 |
| Rel θ Power at Pz | 0.236 | 0.267 | 1.0 |
Effect is significant:
p ≤ 0.05;
p ≤ 0.01;
p ≤ 0.001.
(b) Absolute θ power
The absolute θ power MANOVA shows that the group, stimulus and group × stimulus effects are all significant. The significant group effect (F(5,90) = 2.470; p = 0.038) accounts for 12.1% of the variance, with the LTAAs showing less absolute θ power than the NACs on average across all three stimuli, with the largest effects being at parietal electrode sites.
The significant stimulus effect (F(10,85) = 34.460; p < 0.001) accounts for 80.2% of the variance. Planned repeated comparisons on the stimulus effect showed that the absolute θ power was significantly larger for the target stimulus vs. rare non-standard stimulus and significantly larger for the rare versus standard non-target stimulus at all MESOIs for the two groups taken together.
The significant group × stimulus interaction effect (F(10,85) = 2.669; p = 0.007) accounts for 23.9% of the variance. Separate between-subjects one-way MANOVAs for each level of stimulus were used to further investigate this interaction effect. The results indicate that the absolute θ power significantly discriminated the groups for the non-target (rare and standard) stimuli, with less absolute θ power in the LTAAs vs. the NACs. Post-hoc analyses showed that the effects were significant across all MESOI, with the largest effects over parietal electrode sites. For the target stimulus, the group effect was not significant.
(c) Relative θ power
The relative θ power MANOVA shows that the group, stimulus and group × stimulus effects are all significant. The significant group effect (F(5,90) = 2.344; p = 0.048) accounts for 11.5% of the variance, with the LTAAs showing greater positive log ratios (i.e. larger ERS) than the NACs on average across all three stimuli, with the largest effects being at frontal electrode sites.
The significant stimulus effect (F(10,85) = 31.508; p < 0.001) accounts for 78.8% of the variance. Planned repeated comparisons on the stimulus effect showed that the absolute θ power was significantly larger for the target stimulus vs. rare non-standard stimulus and significantly larger for the rare versus standard non-target stimulus at all MESOIs for the two groups taken together.
The significant group × stimulus interaction effect (F(10,85) = 2.669; p = 0.007) accounts for 23.9% of the variance. Separate between-subjects one-way MANOVAs for each level of stimulus were used to further investigate this interaction effect (Table 2 shows the one-way MANOVA results for the reference θ power for the target stimulus). The results show that the induced θ power for the target stimulus significantly discriminates the groups, with the LTAAs showing a larger ERS than the NACs. The effect is largest at frontal electrode sites. The induced θ power for the non-target stimuli (rare and standard) do not significantly discriminate the groups.
Correlation analysis within each group revealed that neither pre-stimulus reference θ power nor induced θ power were associated with alcohol use variables, duration of abstinence or FHD.
(iii) Independence of ERONPL θ power and ERP amplitude measures
Table 2 shows the results of one-way between-group MANOVAs and MANCOVAs, performed separately for the reference and relative θ power. The results for the MANOVAs (presented in the previous section), show that for the group effect is significant for both the reference θ power (F(5,90) = 3.141; p = .012) and the relative θ power (F(5,90) = 4.527; p = .001), with the size of the effects accounting for 14.9% and 20.1% of the variance respectively.
The MANCOVA result on the reference θ power shows that the group effect is still significant (F(5,89) = 4.527; p = .001) after removing variance of the P3b amplitude, but the size of the effect is reduced from 14.9% to 11.8%. For the relative θ power MANCOVA, the group effect is also still significant (F(5,89) = 4.906; p = .001) after removing variance of the P3b amplitude, but in this case the size of the effect is not reduced, going from 20.1% to 21.6%. Furthermore, after removing the variance of the reference θ power at MESOIs and the P3b amplitude, the group effect is still significant (F(5,84) = 3.002; p = .015), but the effect size is smaller, going from 21.6% to 15.2%. The trends for the overall MANOVA (MANCOVA) are also observed in the post-hoc univariate ANOVA (ANCOVA) results at MESOIs shown in Table 2.
(iv) Comparison of reference θ power in the task vs. resting θ power
Results presented earlier showed that the task reference θ power did not differ across stimulus types. Therefore, use of the average reference θ power across the three stimulus types as representative of the pre-stimulus θ power throughout the task is justified. The top row of Figure 3 shows group comparisons of the grand average power spectra at electrode site FCz for the task (left plot of top row) and the resting condition (right plot of top row). The reference θ power (left plot of top row) across the selected θ band (4 Hz – 6 Hz) shows that, on average, the reference θ power is larger in the NACs compared to the LTAA, as presented in section (iii) of the results. The grand average resting power spectra (right plot of top row) also show that, on average, the power across the selected θ band is larger in the NACs compared to the LTAAs.
Figure 3.
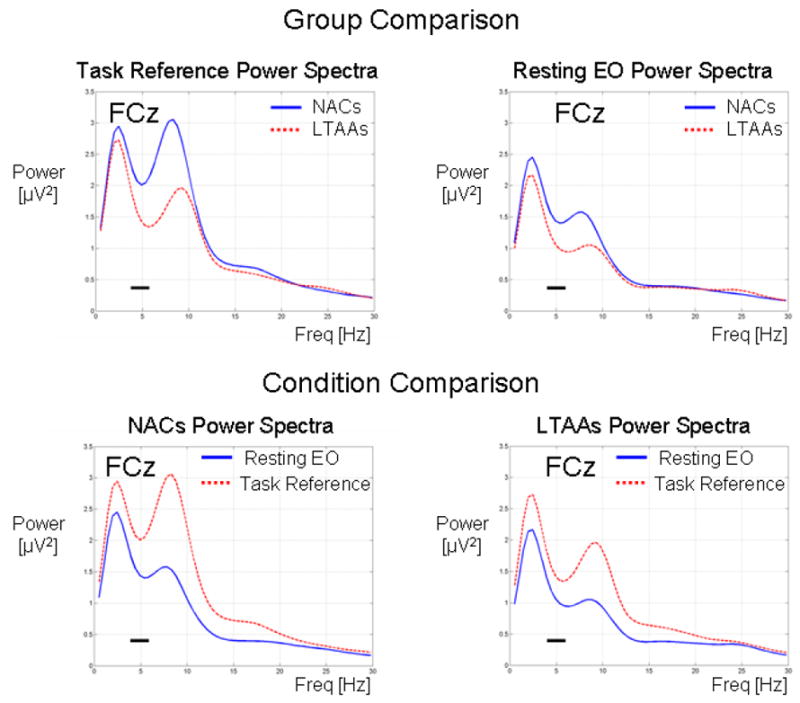
Group comparison (top row) of the reference power spectra for the pre-stimulus reference period averaged over three stimulus types (left plot) and resting eyes-open power spectra (right plot) and condition comparison (bottom row) of power spectra for NACs (left plot) and LTAAs is (right plot). The pre-stimulus reference power spectra were computed by averaging the spectra in the grand average STFT-based ERONPL TFR across the time interval defined by the pre-stimulus TFROI (i.e. -200 ms to -100 ms). The horizontal bar in the spectral plots shows the frequency band defined by the TFROI (i.e. 4 Hz to 6 Hz).
The lower row of Figure 3 shows the condition comparison (resting vs. task) of the grand average power spectra for the NACs (left plot) and LTAAs (right plot). The largest difference in the grand average power spectra across conditions is in the α band, where the reference power in the task is larger compared to the resting EO power. Within the θ band of interest, the difference is not as large, but the reference power in the task is also, on average, greater than the resting θ power.
For the two-way MANOVA on θ power with group (NAC vs. LTAA) and condition (resting vs. task) as the independent variables, Levene’s test showed that the assumption of homogeneity of variance was violated for the between-subjects group variable. Therefore, separate one-way between-subject MANOVAs were carried out for each level of the condition variable, and a one-way repeated-measure MANOVA was performed for comparing conditions for the combined groups. The results are shown in Table 3.
Table 3.
One-way MANOVA results for the resting and reference (averaged across all three stimulus types) θ power with group as the between-subject variables and one-way MANOVA results for the θ power with condition (resting vs. task reference) as the repeated-measures independent variable and with groups pooled. Post-hoc ANOVAs results for each of the dependent variables taken on their own is shown below the overall MANOVA.
| Resting Condition | Effect Sizes (% of Variance) | ||
|---|---|---|---|
| NAC | LTAA | Group | |
| Resting θ Power 1-Way MANOVA | 5.4 | ||
| Rest θ Power at Fz | 0.791 | 0.698 | 4.7 |
| Rest θ Power at FCz | 0.812 | 0.706 | 4.7 |
| Rest θ Power at Cz | 0.767 | 0.603 | 3.3 |
| Rest θ Power at CPz | 0.708 | 0.646 | 0.7 |
| Rest θ Power at Pz | 0.758 | 0.657 | 4.7 |
|
| |||
| Task Condition | Effect Sizes (% of Variance) | ||
| NAC | LTAA | ||
| Reference θ Power 1-Way MANOVA | 17.1** | ||
| Ref θ Power at Fz | 0.930 | 0.819 | 6.8** |
| Ref θ Power at FCz | 0.973 | 0.846 | 10.8*** |
| Ref θ Power at Cz | 0.948 | 0.821 | 10.9*** |
| Ref θ Power at CPz | 0.921 | 0.800 | 10.2** |
| Ref θ Power at Pz | 0.891 | 0.770 | 10.4*** |
|
| |||
| Resting Condition |
Task Condition |
Effect Sizes (% of Variance) Condition |
|
|
| |||
| θ Power 1-Way MANOVA | 48.4*** | ||
| θ Power at Fz | 0.745 | 0.875 | 42.8*** |
| θ Power at FCz | 0.759 | 0.909 | 35.2*** |
| θ Power at Cz | 0.685 | 0.885 | 18.2*** |
| θ Power at CPz | 0.677 | 0.860 | 20.2*** |
| θ Power at Pz | 0.708 | 0.830 | 29.5*** |
Effect is significant:
p ≤ 0.05;
p ≤ 0.01;
p ≤ 0.001.
In comparison to the task reference θ power that significantly discriminates the groups (F(5,90) = 3.714; p < .004), the resting θ power does not (F(5,90) = 1.037; p = .401). The repeated-measures MANOVA shows that the θ power is significantly greater during the reference period compared to EO rest condition (F(5,91) = 17.096; p < .001), with the effect accounting for 48.4% of the variance and occurring at all MESOIs.
DISCUSSION
Pre-stimulus θ power did not differ across stimulus types, supporting its use as a stimulus-independent baseline for the paradigm and shows that the inter-stimulus interval was sufficient for any stimulus-related changes in θ power to return to baseline before the next stimulus. This supports the computation of event-related relative power across multiple repeated trials.
Theta power during the resting eyes open condition did not differentiate the LTAAs and NACs. The pre-stimulus θ power in the task was larger than the resting θ power, thus showing an enhanced level of stimulus-independent θ synchronization for the task, consistent with higher levels of attention and motivation in the task compared to the resting condition. Furthermore, this enhancement of the task pre-stimulus θ power was larger for the NACs than the LTAAs, as the LTAAs showed significantly reduced pre-stimulus θ power compared to the NACs. After removing variance of the P3b amplitude, the pre-stimulus θ power still significantly discriminated the groups, but the effect size was reduced. This reduction is consistent with proposed oscillatory models of ERP generation where partial phase resetting of δ and θ oscillations contributes to the P300.
All stimuli showed a θ ERS, with induced θ oscillations to standard and rare non-target stimuli being smaller than those to target stimuli. While the post-stimulus θ power measured after non-target stimuli significantly discriminated the groups, the induced θ power did not. Thus both groups showed enhanced levels of post-stimulus θ power induced by the non-target stimuli, but the relative difference in θ power between NACs and LTAAs was the same for the pre-stimulus and post-stimulus periods. Thus, the post-stimulus θ power effect is carried from the effect of pre-stimulus θ power.
In contrast, induced θ oscillations 300 to 500 ms following the target stimulus are significantly enhanced in LTAAs compared to NACs. The group effect is specific to target detection. After removing variance of the pre-stimulus θ power and the P3b amplitude from the induced θ power, the group effect, although reduced in size, is still significant. This indicates that the induced θ oscillations, independent of pre-stimulus θ power levels, significantly discriminate the groups. Also, these induced θ oscillations are independent measures of group discrimination to the P3b amplitude measure. Furthermore, comparison of effect sizes show that induced θ oscillations that index target stimulus processing are more sensitive measures of group membership than baseline θ power measures that index general levels of attention and motivation during task performance.
The enhancement in the ERS is opposite in direction to the reduction in P3b amplitude in LTAAs compared to NACs (or equivalently, to the reduction in evoked δ and θ power, which comprise the P3b waveform (Andrew and Fein, In Press)). The spatial localization of induced θ oscillations over fronto-central regions also differs to that of the evoked δ and θ power measures, which show spatial localization over the centro-parietal regions. Andrew and Fein (In Press) present a between-subjects analysis of P3b amplitude (and it’s reflection in evoked power) on the data of the current study, showing reduced P3b in LTAAs. The effect size was about half that of the findings on induced θ oscillations reported here. This strongly suggests that measures of the induced θ oscillations during target processing are more powerful discriminators of LTAAs and NACs than the P3b (whether examined in the time or time/frequency domain).
No associations within LTAA between induced θ oscillations and severity of alcohol abuse, duration of abstinence or the density of the family history of alcohol problems were found. These findings suggest that enhanced θ oscillations in LTAAs might be the result of alcohol abuse beyond a threshold (as was the case for all the LTAAs studied) that is not ameliorated with abstinence from alcohol. The lack of an association with severity of abuse and duration of abstinence also suggests that enhanced θ oscillations might provide an endophenotypic marker of vulnerability to alcoholism, although lack of an association with the family history of alcoholism is not consistent with this conclusion. From the data presented here it is thus not possible to distinguish the effects of predisposition to alcoholism, chronic alcohol abuse and recovery from alcoholism. Given the large differences found, further investigation of induced oscillations in populations of active alcoholics and offspring of alcoholics are planned to investigate this further.
Acknowledgments
This work was supported by National Institutes for Health, NIH Grants #1R21AA017311, #1R01AA016944 and #2R01AA013659.
Footnotes
the Welch periodogram spectral estimator
Tests of multivariate normality were not carried out
Publisher's Disclaimer: This is a PDF file of an unedited manuscript that has been accepted for publication. As a service to our customers we are providing this early version of the manuscript. The manuscript will undergo copyediting, typesetting, and review of the resulting proof before it is published in its final citable form. Please note that during the production process errors may be discovered which could affect the content, and all legal disclaimers that apply to the journal pertain.
References
- American Psychiatric Association. DSM-IV-TR: Diagnostic and Statistical Manual of Mental Disorders. 4. American Psychiatric Publishing; Washington, DC: 2000. [Google Scholar]
- Andrew C, Fein G. Event-related oscillation vs. event-related potential analysis of P300 as a biomarker for alcoholism. Alcohol Clin Exp Res. doi: 10.1111/j.1530-0277.2009.01136.x. In Press. [DOI] [PMC free article] [PubMed] [Google Scholar]
- Bastiaansen M, Hagoort P. Event-induced theta responses as a window on the dynamics of memory. Cortex. 2003;39:967–992. doi: 10.1016/s0010-9452(08)70873-6. [DOI] [PubMed] [Google Scholar]
- Deiber M-P, Missonnier P, Bertrand O, Gold G, Fazio-Costa L, Ibanez V, et al. Distinction between Perceptual and Attentional Processing in Working Memory Tasks: A Study of Phase-locked and Induced Oscillatory Brain Dynamics. Journal of Cognitive Neuroscience. 2007;19:158–172. doi: 10.1162/jocn.2007.19.1.158. [DOI] [PubMed] [Google Scholar]
- Delorme A, Makeig S. EEGLAB: an open source toolbox for analysis of single-trial EEG dynamics including independent component analysis. J Neurosci Methods. 2004;134:9–21. doi: 10.1016/j.jneumeth.2003.10.009. [DOI] [PubMed] [Google Scholar]
- Fein G, Chang M. Visual P300s in long-term abstinent chronic alcoholics. Alcohol Clin Exp Res. 2006;30:2000–2007. doi: 10.1111/j.1530-0277.2006.00246.x. [DOI] [PMC free article] [PubMed] [Google Scholar]
- Gevins A, Smith ME, McEvoy L, Yu D. High Resolution EEG Mapping of Cortical Activation Related to Working Memory: Effects of Task Difficulty, Type of Processing, and Practice. Cereb Cortex. 1997;7:374–385. doi: 10.1093/cercor/7.4.374. [DOI] [PubMed] [Google Scholar]
- Gratton G, Coles MG, Donchin E. A new method for off-line removal of ocular artifact. Electroenceph clin Neurophysiol. 1983;55:468–484. doi: 10.1016/0013-4694(83)90135-9. [DOI] [PubMed] [Google Scholar]
- Jensen O, Tesche CD. Frontal theta activity in humans increases with memory load in a working memory task. Eur J Neurosci. 2002;15:1395–1399. doi: 10.1046/j.1460-9568.2002.01975.x. [DOI] [PubMed] [Google Scholar]
- Jones KA, Porjesz B, Chorlian D, Rangaswamy M, Kamarajan C, Padmanabhapillai A, et al. S-transform time-frequency analysis of P300 reveals deficits in individuals diagnosed with alcoholism. Clin Neurophysiol. 2006;117:2128–2143. doi: 10.1016/j.clinph.2006.02.028. [DOI] [PubMed] [Google Scholar]
- Kalcher J, Pfurtscheller G. Discrimination between phase-locked and non-phase-locked event-related EEG activity. Electroenceph clin Neurophysiol. 1995;94:381–384. doi: 10.1016/0013-4694(95)00040-6. [DOI] [PubMed] [Google Scholar]
- Kamarajan C, Porjesz B, Jones K, Chorlian D, Padmanabhapillai A, Rangaswamy M, et al. Event-related oscillations in offspring of alcoholics: neurocognitive disinhibition as a risk for alcoholism. Biol Psychiatry. 2006;59:625–634. doi: 10.1016/j.biopsych.2005.08.017. [DOI] [PMC free article] [PubMed] [Google Scholar]
- Kamarajan C, Porjesz B, Jones KA, Choi K, Chorlian DB, Padmanabhapillai A, et al. The role of brain oscillations as functional correlates of cognitive systems: a study of frontal inhibitory control in alcoholism. Int J Psychophysiol. 2004;51:155–180. doi: 10.1016/j.ijpsycho.2003.09.004. [DOI] [PMC free article] [PubMed] [Google Scholar]
- Klimesch W. Memory processes, brain oscillations and EEG synchronization. Int J Psychophysiol. 1996;24:61–100. doi: 10.1016/s0167-8760(96)00057-8. [DOI] [PubMed] [Google Scholar]
- Klimesch W. EEG alpha and theta oscillations reflect cognitive and memory performance: a review and analysis. Brain Res Brain Res Rev. 1999;29:169–195. doi: 10.1016/s0165-0173(98)00056-3. [DOI] [PubMed] [Google Scholar]
- Klimesch W, Russegger H, Doppelmayr M, Pachinger T. A method for the calculation of induced band power: implications for the significance of brain oscillations. Electroenceph Clin Neurophysiol. 1998;108:123–130. doi: 10.1016/s0168-5597(97)00078-6. [DOI] [PubMed] [Google Scholar]
- Krause CM, Sillanmäki L, Koivisto M, Saarela C, Häggzvist A, Laine M, et al. The effects of memory load on event-related EEG desynchronization and synchronization. Clinical Neurophysiology. 2000;111:2071–2078. doi: 10.1016/s1388-2457(00)00429-6. [DOI] [PubMed] [Google Scholar]
- Makeig S. Auditory event-related dynamics of the EEG spectrum and effects of exposure to tones. Electroenceph clin Neurophysiol. 1993;86:283–293. doi: 10.1016/0013-4694(93)90110-h. [DOI] [PubMed] [Google Scholar]
- Mann K, Ackerman K, Croissant B, Mundle G, Nakovics H, Diehl A. Neuroimaging of gender differences in alcohol dependence: are women more vulnerable? Alcoholism: Clinical & Experimental Research. 2005;29:896–901. doi: 10.1097/01.alc.0000164376.69978.6b. [DOI] [PubMed] [Google Scholar]
- McEvoy LK, Pellouchoud E, Smith ME, Gevins A. Neurophysiological signals of working memory in normal aging. Brain Res Cogn Brain Res. 2001;11:363–376. doi: 10.1016/s0926-6410(01)00009-x. [DOI] [PubMed] [Google Scholar]
- Missonnier P, Deiber MP, Gold G, Millet P, Gex-Fabry Pun M, Fazio-Costa L, et al. Frontal theta event-related synchronization: comparison of directed attention and working memory load effects. J Neural Transm. 2006;113:1477–1486. doi: 10.1007/s00702-005-0443-9. [DOI] [PubMed] [Google Scholar]
- Perrin F, Pernier J, Bertrand O, Echallier JF. Spherical splines for scalp potential and current density mapping. Electroencephalogr Clin Neurophysiol. 1989;72:184–187. doi: 10.1016/0013-4694(89)90180-6. [DOI] [PubMed] [Google Scholar]
- Pfurtscheller G. Event-related synchronization (ERS): an electrophysiological correlate of cortical areas at rest. Electroencephalogr Clin Neurophysiol. 1992;83:62–69. doi: 10.1016/0013-4694(92)90133-3. [DOI] [PubMed] [Google Scholar]
- Pfurtscheller G, Andrew C. Event-Related changes of band power and coherence: methodology and interpretation. J Clin Neurophysiol. 1999;16:512–519. doi: 10.1097/00004691-199911000-00003. [DOI] [PubMed] [Google Scholar]
- Pfurtscheller G, Lopes da Silva FH. Event-related EEG/MEG synchronization and desynchronization: basic principles. Clin Neurophysiol. 1999;110:1842–1857. doi: 10.1016/s1388-2457(99)00141-8. [DOI] [PubMed] [Google Scholar]
- Porjesz B, Begleiter H. Alcoholism and human electrophysiology. Alcohol Res Health. 2003;27:153–160. [PMC free article] [PubMed] [Google Scholar]
- Rangaswamy M, Jones KA, Porjesz B, Chorlian DB, Padmanabhapillai A, Kamarajan C, et al. Delta and theta oscillations as risk markers in adolescent offspring of alcoholics. Int J Psychophysiol. 2007;63:3–15. doi: 10.1016/j.ijpsycho.2006.10.00. [DOI] [PMC free article] [PubMed] [Google Scholar]
- Skinner HA, Allen BA. Alcohol dependence syndrome: measurement and validation. Abnormal Psychology. 1982;91:199–209. doi: 10.1037//0021-843x.91.3.199. [DOI] [PubMed] [Google Scholar]
- Sobell LC, Sobell MB. Self-reports issues in alcohol abuse: State of the art and future directions. Behaviorial Assessment. 1990;12:77–90. [Google Scholar]