

Abstract
Cytomegalovirus (CMV) infection and reactivation pose a serious threat for patients after haematopoietic stem cell transplantation. We have previously shown that CD8+ T cells targeting different CMV epitopes correlate with protection at different threshold frequencies in those patients. To investigate if this may relate to a different quality of these cells here we analyse the T-cell receptor diversity of pp50 (245–253)/HLA-A*0101 specific CD8+ T cells with that of CD8+ T cells targeting various pp65 peptides. The results from this pilot study show differences in the breadth of the T-cell receptor usage of the different cell populations. We observe for the first time that the T-cell receptor Vβ CDR3 spectratypes used by CMV pp50 (245–253)/HLA-A*0101-specific CD8+ T cells can reach higher numbers than those used by CD8+ T cells targeting various pp65 peptides in our patient cohort. This merits further investigation into the effectiveness of the different CMV-specific T cells and their impact on immunosenescence, which is important to eventually define the most useful source of adoptive therapy and monitoring protocols for cytomegalovirus-specific immune responses.
Keywords: CD8/cytotoxic T cells, cytomegalovirus/virology, stem cell/bone marrow transplantation, T-cell receptor
Introduction
Cytomegalovirus (CMV) is usually asymptomatic in immunocompetent hosts and enters a lifelong latent phase1 during which it is controlled by persisting immune responses.2 Primary infection or reactivation of latent CMV are major problems for haematopoietic stem cell transplant recipients because their immunosuppressed state facilitates dissemination of the virus and disease3 resulting in inflammation, systemic disease and an increased rate of graft-versus-host disease.4–6 Antiviral therapy is used prophylactically or pre-emptively but long-term treatment is often associated with toxicity, selection of resistant virus and can only prevent some of the CMV-associated complications.7–9 Instead, restoration of a functional antiviral cellular immune response is necessary for sustained control of latent CMV infection.10,11
We have previously shown that ex vivo CMV-specific CD8+ T cells restricted by common tissue types in Caucasoids (HLA-A*0101, HLA-A*0201, HLA-A*2402 and HLA-B*3501) correlate with protection from CMV reactivation at different threshold frequencies.12 To investigate these responses further, here we analyse the T-cell receptor (TR) usage of these different CMV-specific CD8+ T cells targeting CMV pp65 and CMV pp50. This includes the TR usage in CD8+ T cells with specificity for CMV pp50 (245–253)/HLA-A*0101, which, to the best of our knowledge, has not been reported previously. Responses to these targets, CMV pp65 and pp50, have been shown to exhibit higher cytotoxic potential than responses to other CMV peptides.13
To evaluate the specificity and clonal composition of ex vivo antigen-specific CD8+ T cells, we used tetrameric HLA : peptide complexes to label and sort antigen-specific T cells, and TR Vβ spectratyping to analyse the repertoire diversity of sorted cells. PCR amplified TR Vβ cDNAs from the sorted cells were also cloned and sequenced to evaluate the actual TR sequence diversity from each population. We had previously shown that the levels of these different CMV peptide /HLA-specific T cells that correlate with protective immunity fall into two classes, with levels of T cells specific for HLA-A*0101/pp50 (245–253) and HLA-A*0201/pp65 (495–03) being some 10-fold greater than those specific for HLA-A*2402/pp65 (341–349) and HLA-B*3501/pp65 (123–131).12 Here we sought to ask whether the level of repertoire complexity in the responses showed any relationship with the T-cell numbers associated with protective immunity.
Materials and methods
Ethics statement
Written informed consent was obtained from all patients and the study was approved by the Royal Free Hospital Ethical Practices Sub-Committee (reference 90-2K).
Patients
Patients treated for haematological diseases by haematopoietic stem cell transplant from 2002 to 2006 at the Royal Free Hospital, London, UK were recruited for this study if they expressed one or several of the HLA types HLA-A*0101, HLA-A*0201, HLA-A*2402 or HLA-B*3501 and they were CMV seropositive. Their characteristics, as well as patient and donor CMV serology findings, are summarized in Table 1.
Table 1.
Characteristics of patients
| Peptide/HLA specificity of TR analysed | ||||||||||||||
|---|---|---|---|---|---|---|---|---|---|---|---|---|---|---|
| Patient | CMVpp50/HLA-A1 | CMVpp65/HLA-A1 | CMVpp65/HLA-A2 | CMVpp65/HLA-A24 | CMVpp65/HLA-B35 | Diagnosis | Sex (r/d) | Age (r/d) | CMV (r/d) | HSC source | Conditioning regimen | TCD of graft | GVH prophylaxis | Time of sampling |
| 1 | √ | AML | m/f | 43/41 | +/+ | Allo PBSC | Bu, Cam, Flu | n | CSA | d101 | ||||
| 2 | √ | MDS | f/m | 32/36 | +/+ | Allo PBSC | Flu, Mel | n | CSA, MMF | d283 | ||||
| 4 | √ | AML | m/m | 44/38 | +/+ | Allo PBSC | Cy, TBI | n | CSA, MTX | d122 | ||||
| 8 | √ | AML | f/f | 55/43 | +/+ | Allo PBSC | Cam, Flu, Mel | n | CSA | d53 | ||||
| 9 | √ | MM | f | 42 | + | Auto PBSC | Mel | n | – | d713 | ||||
| 11 | √ | CML | f/f | 57/28 | +/+ | Allo PBSC | Cam, Flu, Mel | n | CSA | d588 | ||||
| 12 | √ | AA | m/f | 36/30 | +/+ | Allo BM | ATG, Cy | n | CSA | d54 | ||||
| 14 | √ | √ | MM | f | 51 | + | Auto PBSC | Mel | n | – | d55 | |||
| 21 | √ | √ | FasL | m/f | 32/28 | +/− | Allo PBSC | Cam, Flu, Mel | n | CSA | d616 and 682 | |||
| 22 | √ | AML | f/m | 44/41 | +/+ | Allo PBSC | Cy, TBI | CAM | CSA | d55 | ||||
| 24 | √ | Myelofibrosis | m/f | 66/60 | +/+ | Allo PBSC | Cam, Flu, Mel | n | CSA | d63 | ||||
| 29 | √ | B-CLL | m/f | 53/42 | +/+ | Allo PBSC | Cam, Flu, Mel | n | CSA | d52 | ||||
| 30 | √ | NK-NHL | m | 55 | + | Auto BM | BCNU, E, Cyt, Mel | n | n | d894 | ||||
| 31 | √ | √ | MM | m | 52 | + | Auto PBSC | Mel | n | n | d728 | |||
| 34 | √ | AML | f/m | 30/39 | +/+ | Allo PBSC | Flu, Cy, TBI | CAM | n | d808 | ||||
| 35 | √ | β-Thal | m/m | 31/16 | +/+ | Allo PBSC | Flu, Cam, Bu, Cy | n | CSA, MTX | d189 | ||||
| 36 | √ | NHL | m | 49 | + | Auto BM | R, CCNU, E, Cyt, Cy | n | n | d129 | ||||
| 37 | √ | MM | m | 60 | + | Auto PBSC | Mel | n | n | d869 | ||||
AA, aplastic anaemia; allo, allogeneic transplant; AML, acute myeloid leukaemia; ATG, anti-thymocyte globulin; auto, autologous transplant, B-, disease is associated with B cells; BCNU, bisN,N’-bis(2-chloroethyl)-N-nitroso-urea (carmustine); βThal, β thalassaemia; Bus, busulfan; Cam, campath received in vivo; CCNU, N-(2-chloroethyl)-N’-cyclohexyl-N-nitrosourea (Lomustine);CLL, chronic lymphocytic leukaemia; CML, chronic myeloid leukaemia; CMV, CMV serology; CSA, cyclosporine A; Cy, cyclophosphamide; Cyt, cytarabine; d, days post transplantation; E, etoposide;f, female; FasL, Fas ligand deficiency; Flu, fludarabine; m, male; MDS, myelodysplastic syndrome; Mel, melphalan; MM, multiple myeloma; MMF, mycophenolate mofetil; MTX, methotrexate; n, none; NHL, non-Hodgkin's lymphoma; NK-, disease related to natural killer cells; Peptide/HLA specifications: CMV pp50 (245–253)/HLA-A*0101: VTEHDTLL, CMV pp65 (363–373)/HLA-A*0101: YSEHPTFTSQY, CMV pp65 (495–503)/HLA-A*0201: NLVPMVATV, CMV pp65 (341–349)/ HLA-A*2402: QYDPVAALF, CMV pp65 (123–131)/HLA-B*3501: IPSINVHHY; R, rituximab (anti-CD20); TBI, total body irradiation; TCD, T-cell depletion.
Blood sampling and tetramer staining
Sample preparation, generation of tetramers and flow cytometry staining were performed as described previously.12
Proliferation analysis using CFSE
Peripheral blood mononuclear cells (PBMCs) were stained at 107 cells/ml in complete medium with 10 μm carboxyfluorescein succinimidyl ester (CFSE; Molecular Probes, Paisley, UK) at 37° in the dark for 10 min. This was followed by three washing steps using resuspension in ice-cold complete medium [RPMI-1640 medium with l-glutamine supplemented with 10% heat inactivated fetal calf serum (FCS), 1 U/ml penicillin and 1 μg/ml streptomycin (all BioWhittaker, Stratech Scientific, Suffolk, UK)]. Cells were then incubated at 2 × 10⁶ cells/ml in complete medium at 37° in the dark for subsequent stimulation. Each stimulation was performed in triplicate. Cells were either left unstimulated or were stimulated with phytohaemagglutinin (PHA; 2 μg/ml) for a defined period of time. All samples were left in culture for the same length of time after staining with CFSE. After culture, cells were washed twice in PBS/0·5% FCS. They were resuspended in 50 μl PBS/FCS and stained with 3 μl allophycocyanin (APC) -labelled anti-CD3 and peridinin chlorophyll protein-labelled anti-CD8 antibodies (Becton Dickinson, Oxford, UK) at 4° for 20 min. Washing thereafter was performed twice with PBS. Cells were then immediately acquired on a FACSCalibur flow cytometer (Becton Dickinson) to detect CFSE.
Cell sorting
Flow cytometric sorting of tetramer binding CD3+ CD8+ T cells was performed using a FACS Aria cell sorter (Becton Dickinson) usually resulting in > 90% purity. Where indicated in the Results section PBMCs stained with phycoerythrin (PE) or APC-labelled tetramer were separated on ice using anti-PE or anti-APC magnetic antibody cell sorting (MACS) MicroBeads and MS+ positive selection columns (Miltenyi Biotec, Surrey, UK) according to the manufacturer's instruction. Selection was preceded by a CD8+ selection step using the CD8+ T-cell isolation kit II (Miltenyi Biotec) involving indirect magnetic labelling of non-CD8+ T cells using a cocktail of biotin-conjugated antibodies against CD4, CD14, CD16, CD19, CD36, CD56, CD123, TR-γ/δ and CD235a (glycophorin A). These cells were subsequently magnetically labelled with anti-biotin microbeads (Miltenyi Biotec) for depletion. The PBMCs were then stained with PE-labelled or APC-labelled tetramer for positive selection with anti-PE or anti-APC MicroBeads over two consecutive columns. The purity of these cells was 68·6% (of CD8+ T cells, corresponding to 59·1% of CD3+ T cells, patient 4), 96·3% (of CD8+ T cells, corresponding to 56·9% of CD3+ T cells, patient 8), 65·3% (of CD8+ T cells corresponding to 56·6% of CD3+ T cells, patient 9) and 97·3% (of CD8+ T cells corresponding to 70·6% of CD3+ T cells, patient 11).
Preparation of cDNA
Cell pellets were used for extraction of total RNA using the RNeasy Micro Kit with poly-A RNA carrier solution and RNase-free DNase (all reagents; Qiagen, Sussex, UK) according to the manufacturer's instructions. Reverse transcription-PCR was performed using sensiscript reverse transcriptase (Qiagen) and random primers (Promega, Southampton, UK) according to the manufacturer's instructions.
Spectratyping
One microlitre (of a total of 20 μl) cDNA was amplified in a 12·5-μl reaction volume using 0·265 units Platinum Taq (Invitrogen Life Technologies Ltd, Paisley, UK), 2 mm MgCl2 (Invitrogen), 0·4 mm dNTPs (Bioline, London, UK), 0·4 μm unlabelled constant region Cβ primer and a mixture of labelled Vβ primers in PCR buffer (Invitrogen). The PCR conditions were 95° for 1 min followed by denaturation at 95° for 30 seconds, annealing at 58° for 30 seconds and primer extension at 72° for 5 min for 30 cycles followed by a final polymerization step at 72° for 10 min. Seven multiplex PCR (A–G) were performed per sample. These included optimized ratios of primer concentrations, which were multiplexed according to compatibility and amplicon size as listed in Table 2. A standard set of 24 Vβ primers that represent 22 TRBV subgroups14,15 was used (modified from refs 16 and 17). Table 3 indicates the correspondence between the primer names based on the nomenclature by Wei et al.,15 the international ImMunoGeneTics (IMGT) nomenclature for the TRBV subgroups14 and the number of functional genes per subgroup (IMGT Repertoire, http://www.imgt.org). Products of the PCR were diluted 1 : 10 before 2 μl were mixed with 7·75 μl 0·1% (volume/volume) Tween-20 (BDH Biochemicals, Dagenham, Essex, UK) and 0·25-μl size standard (ET-ROX 550; Amersham Biosciences, GE Healthcare UK Ltd, Buckinghamshire, UK). Separation was performed with the linear polyacrylamide (LPA) separation polymer MegaBACE Long Read Matrix (Amersham Biosciences) on a MegaBACE 1000 (Amersham Biosciences) using 3 kV injection voltage, 10 kV run voltage, 60 seconds injection time and 80 min run time at 44°. Data were analysed with Genetic Profiler software (Amersham Biosciences) whereby signals below 100 units were usually discounted.
Table 2.
T-cell receptor Vβ PCR multiplexing
| Mix | Molarity (μm) | Primer name1 | TRBV subgroup2 | F3 | 5′ label | Primer sequence | Amplicon size (bp) |
|---|---|---|---|---|---|---|---|
| A | 2·36 | Vβ·1 | TRBV9 | 1 | FAM | 5-CAA CAG TTC CCT GAC TTG CAC-3 | 185–214 |
| 1·59 | Vβ·2 | TRBV20 | 1 | JOE | 5-TCA ACC ATG CAA GCC TGA CCT-3 | 182–220 | |
| 3·19 | Vβ·5S2 | TRBV5 | 5 | TAMRA | 5-CCT AAC TAT AGC TCT GAG CTG-3 | 176–214 | |
| 13·29 | Vβ·5S1 | TRBV5 | 5 | JOE | 5-ATA CTT CAG TGA GAC ACA GAG AAA C-3 | 242–271 | |
| B | 2·66 | Vβ·6 | TRBV7 | 7 | FAM | 5-AGG CCT GAG GGA TCC GTC TC-3 | 182–211 |
| 2·66 | Vβ·7 | TRBV4 | 3 | JOE | 5-CTG AAT GCC CCA ACA GCT CTC-3 | 188–220 | |
| 3·99 | Vβ·8 | TRBV12 | 3 | FAM | 5-TAC TTT AAC AAC AAC GTT CCG-3 | 248–277 | |
| 13·29 | Vβ·9 | TRBV3 | 1 | TAMRA | 5-AAA TCT CCA GAC AAA GCT CAC-3 | 185–217 | |
| 31·88 | Vβ·16 | TRBV14 | 1 | JOE | 5-GAG TCT AAA CAG GAT GAG TCC-3 | 229–261 | |
| C | 3·99 | Vβ·12 | TRBV10 | 3 | FAM | 5-GAC AAA GGA GAA GTC TCA GAT-3 | 219–248 |
| 2·66 | Vβ·13S2 | TRBV6 | 8 | TAMRA | 5-GTT GGT GAG GGT ACA ACT GCC-3 | 236–271 | |
| 1·99 | Vβ·13S1 | TRBV6 | 8 | JOE | 5-GAC CAA GGA GAA GTC CCC AAT-3 | 218–247 | |
| D | 2·39 | Vβ·11 | TRBV25 | 1 | FAM | 5-ACA GTC TCC AGA ATA AGG ACG-3 | 186–218 |
| 2·92 | Vβ·20 | TRBV30 | 1 | TAMRA | 5-TCT GAG GTG CCC CAG AAT CTC-3 | 212–244 | |
| 26·57 | Vβ·15 | TRBV24 | 1 | JOE | 5-GTC TCT CGA CAG GCA CAG GCT-3 | 188–214 | |
| E | 1·33 | Vβ·3 | TRBV28 | 1 | FAM | 5-TCT AGA GAG AAG AAG GAG CGC-3 | 185–214 |
| 10·63 | Vβ·24 | TRBV15 | 1 | TAMRA | 5-AAA GAT TTT AAC AAT GAA GCA GAC-3 | 232–261 | |
| 5·31 | Vβ·17 | TRBV19 | 1 | JOE | 5-CAC AGA TAG TAA ATG ACT TTC AG-3 | 235–270 | |
| F | 2·66 | Vβ·18 | TRBV18 | 1 | FAM | 5-GAG TCA GGA ATG CCA AAG GAA-3 | 220–246 |
| 15·94 | Vβ·23 | TRBV13 | 1 | TAMRA | 5-TCA TTT CGT TTT ATG AAA AGA TGC-3 | 248–277 | |
| 16·63 | Vβ·14 | TRBV27 | 1 | FAM | 5-TCT CGA AAA GAG AAG AGG AAT-3 | 185–211 | |
| 6·64 | Vβ·21 | TRBV11 | 3 | FAM | 5-GAT ATG AGA ATG AGG AAG CAG-3 | 242–280 | |
| G | 2·6 | Vβ·4 | TRBV29 | 1 | FAM | 5-CAT ATG AGA GTG GAT TTG TCA TT-3 | 222–251 |
| 7·97 | Vβ·22 | TRBV2 | 1 | TAMRA | 5-CAG AGA AGT CTG AAA TAT TCG A-3 | 221–250 |
Vβ primers were used in multiplex PCR reactions with the Cβ primer 5′ CTT CTG ATG GCT CAA ACA C 3′ (Alta Biosciences) to obtain amplicons of the range of size listed. Vβ primers were purchased from Sigma Genosys except Vβ21, which was purchased from ABI. The molarity at which they were used is indicated.
Primer names according to the nomenclature of Wei et al.15
F, functional. This column indicates the number of functional genes belonging to the different TRBV subgroups (IMGT Repertoire, http://www.imgt.org).
Table 3.
Primer nomenclature
| Primer names | IMGT TRBV subgroups | Number of functional genes per subgroup |
|---|---|---|
| Vβ·1 | TRBV9 | 1 |
| Vβ·2 | TRBV20 | 1 |
| Vβ·3 | TRBV28 | 1 |
| Vβ·4 | TRBV29 | 1 |
| Vβ·5S1 | TRBV5 | 5 |
| Vβ·5S2 | ||
| Vβ·6 | TRBV7 | 7 |
| Vβ·7 | TRBV4 | 3 |
| Vβ·8 | TRBV12 | 3 |
| Vβ·9 | TRBV3 | 1 |
| Vβ·11 | TRBV25 | 1 |
| Vβ·12 | TRBV10 | 3 |
| Vβ·13S1 | TRBV6 | 8 |
| Vβ·13S2 | ||
| Vβ·14 | TRBV27 | 1 |
| Vβ·15 | TRBV24 | 1 |
| Vβ·16 | TRBV14 | 1 |
| Vβ·17 | TRBV19 | 1 |
| Vβ·18 | TRBV18 | 1 |
| Vβ·20 | TRBV30 | 1 |
| Vβ·21 | TRBV11 | 3 |
| Vβ·22 | TRBV2 | 1 |
| Vβ·23 | TRBV13 | 1 |
| Vβ·24 | TRBV15 | 1 |
This table indicates the names of T-cell receptor (TR) Vβ· primers according to the nomenclature of Wei et al.,15 the correspondence of those to the.TRBV subgroups of the IMGT nomenclature14,27,28 and the number of functional genes belonging to these different TRBV subgroups (IMGT Repertoire, http://www.imgt.org).
Quantitative PCR
Quantification of TR β-chain mRNA using primers within the constant region (TRBC) was performed with 5 μl cDNA, 0·4 μm of each of the primers [Cβ forward 5′ TGA CTC CAG ATA CTG CCT GA 3′ (Alta Biosciences, Birmingham, UK) and Cβ reverse 5′ CGT CTG ACA CCG AAR TGG AG 3′ (Alta Biosciences)] and 12·5 μl Power SYBR Green PCR Master Mix (Applied Biosystems, Paisley, UK) in a total volume of 25 μl using denaturation at 95° for 5 min followed by 40 cycles of 95° for 15 seconds and 58° for 1 min followed by a dissociation stage on an ABI 7500 Real Time PCR instrument (Applied Biosystems) using triplicate samples, non-template controls and plasmid standards containing 10–108 molecules of TRBC. Control amplification was performed from the transferrin receptor gene using a pre-designed and validated primer/probe mix (Applied Biosystems).
T-cell receptor clonal analysis
T-cell receptor Vβ PCR products were ligated into pCR2.1 (Invitrogen) for transformation of TOP10F’ cells. Plasmid DNA from bacterial clones with inserts were sequenced using standard M13 forward (5′-GTA AAA CGA CGG CCA G-3′) and reverse (5′-CAG GAA ACA GCT ATG AC-3′) primers (Invitrogen) using BigDye V3.1 chemistry on an Applied Biosystems 3100 capillary sequencer using 35 cycles of 96° for 10 seconds, 46° for 5 seconds, 60° for 4 min (Advanced Biotechnology Centre, Imperial College, London, UK). Sequences were analysed using the IMGT/V-QUEST online tool,18 with integrated IMGT/JunctionAnalysis,19 of IMGT®, the international IMmunoGeneTics information system® (http://www.imgt.org).20
Results
Brief non-specific T-cell stimulation amplifies mRNA levels but does not distort the TR repertoire through differential proliferation
To estimate the TR diversity of ex vivo CMV-specific CD8+ T cells, PBMCs stained with CMV peptide/HLA tetramer were sorted into the cell fraction that bound to tetramer and the remaining fraction of cells that did not bind to tetramer. RNA was then extracted from sorted cells followed by reverse transcription PCR to obtain cDNA. The PCR amplification of the TR Vβ CDR3 region from cDNA was performed and PCR products of different sizes were separated by capillary electrophoresis.
The numbers of sorted tetramer binding cells were frequently small (often < 3000), raising concerns about the efficiency of detection of rare clones within the sorted population. However, in vitro expansion to increase the numbers could also introduce a bias into the observed repertoire, if different clones had intrinsically different rates of proliferation. To optimize the analysis of the TR repertoire of the sorted cells, a short antigen-non-specific stimulation was performed to activate the cells and boost TR mRNA levels. The rationale behind this approach is that TR transcription is up-regulated during T-cell activation, which can be achieved non-specifically by PHA.21 To avoid artefacts introduced by differential proliferation of individual clones, it was intended to limit stimulation to a time period before cell division was initiated. The stimulation period that was finally chosen did not induce proliferation of cells, while still inducing blasts and an increase in the TR mRNA levels in the lymphocytes.
To establish the duration of stimulation necessary, T cells were stimulated with PHA for different time periods after which TR β chain (TRB) mRNA levels were assessed using quantitative PCR (qPCR) with SYBR Green (Fig. 1a). Cells stimulated with PHA for different time periods were harvested for RNA extraction and cDNA generation. Blast transformation (not shown) and proliferation (Fig. 1b) were assessed by means of forward and side scatter characteristics and by CFSE staining, respectively. Blast transformation occurred within 1 hr of stimulation but no dilution of CFSE occurred for up to 32 hr when compared with unstimulated cells, indicating that proliferation did not occur within this time period.
Figure 1.
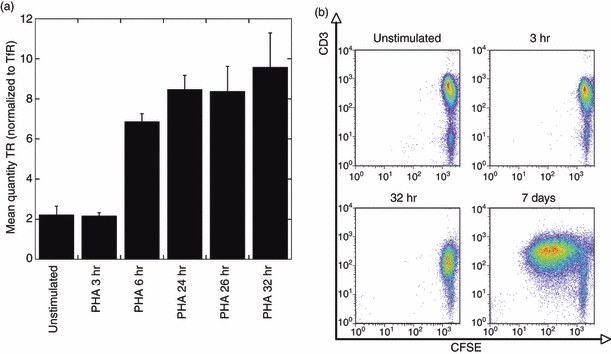
T-cell receptor (TR) quantification and proliferation measurements in lymphocytes after stimulation with phytohaemagglutinin (PHA). (a) The intracellular TR mRNA expression in cells was measured after stimulation with PHA for the time periods indicated on the x-axis and is normalized to the respective expression of TfR (mean ± SD; n = 3). (b) Proliferation was measured by CFSE staining of lymphocytes (x-axis) without stimulation or after stimulation with PHA for 3 hr, 32 hr or 7 days as indicated.
The comparison of message levels versus cell proliferation indicates that TRB mRNA levels can successfully be increased without induction of proliferation of lymphocytes (which may potentially distort the TR repertoire) after in vitro stimulation with PHA for a minimum of 6 hr up to at least 32 hr. A 6-hr period of stimulation of sorted CMV-specific CD8+ T cells was used in subsequent experiments to boost TR mRNA levels before spectratyping experiments. This short time period of stimulation was preferred to avoid an additional potential complication, that of activation-induced T-cell death, which could also distort the observed TR repertoire. The latter is evident in memory effector T cells stimulated with PHA overnight and the functionality of cells is preserved during short periods of stimulation.22
The maximum number of TRBV used in CD8+ T cells targeting CMV pp50 (245–253) is greater than in CD8+ T cells targeting various CMV pp65 peptides
For each CMV peptide/HLA tetramer combination in our study, cDNA was prepared from the cell fraction that bound to tetramer and from the remaining fraction of cells that did not bind to tetramer. Short-term PHA stimulation and spectratyping analysis was then carried out to determine the diversity present in the TR recognizing different CMV peptide/HLA tetramer combinations. A representative example of the results obtained is shown in Fig. 2 for CMV pp50 (245–253)/HLA-A*0101-specific CD8+ T cells sorted from patient 14 to a purity of 96·4% (yielding approximately 5000 cells). The results after amplification with primers specific for the TRBV30 (Vβ.20) subset are shown.
Figure 2.
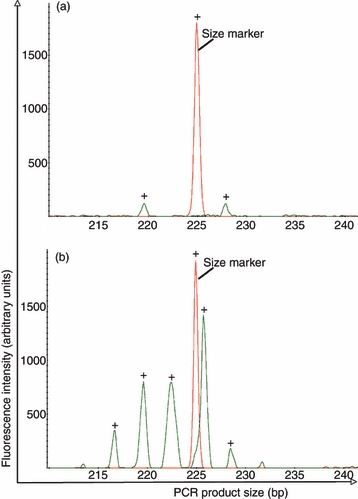
Representative example of T-cell receptor spectratyping histograms of sorted cell populations. Frequency histograms of TRBV30 (Vβ.20) derived from cDNA from patient 14 in overlay with one peak derived from the molecular size standard (225 bp size marker). (a) Sorted tetramer binding cell fraction, (b) Sorted cell fraction that did not bind tetramer.
In this case, two peaks were identified in the tetramer positive pool (Fig. 2a). These did not correspond to the most abundant peak in the non-selected pool, the cell fraction that did not bind to tetramer (Fig. 2b), and so are unlikely to represent contamination from the bulk pool. Histograms are shown in overlay with a size marker to enable similar scaling. Peaks in the sorted cell fraction, nevertheless, reflect strong signals well above 100 units, which is well above the background in our experience.
Extending this analysis to all patients in our study, we have obtained the results summarized in Table 4, where the number of peaks for each Vβ subset identified in each tetramer sorted pool is shown.
Table 4.
CDR3 size classes detected by spectratyping of tetramer binding CD8+ T cells
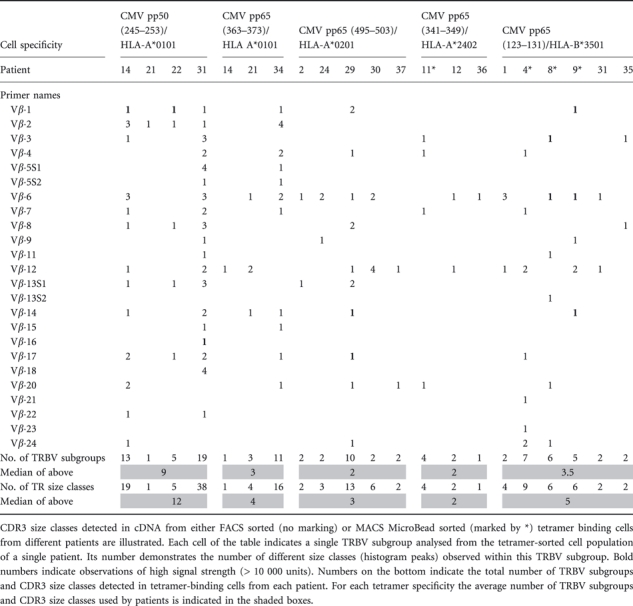 |
The majority of responses make use of a small number of Vβ families (TRBV subgroups), each displaying one or two peaks in the spectratype. However, we observed that CMV pp50 (245–253)/HLA-A*0101-specific CD8+ T cells are more variable and with the exception of patient 21 reach a higher number of spectratype peaks than CD8+ T cells targeting a number of CMV pp65 peptides (maximum 38 spectratype peaks in contrast to 4–16 spectratype peaks used by other cells). The median number of TRBV subgroups used by CMV pp50 (245–253)/HLA-A*0101-specific CD8+ T cells was 9 (n = 4, range 1–19) in contrast to a median of 2–3·5 subgroups in the CD8+ T cells targeting the other peptide/HLA combinations tested. Identical CDR3 size classes in different patients were observed for TRBV9 (Vβ.1) (strongest signals), TRBV20 (Vβ.2), TRBV12 (Vβ.8), TRBV6 (Vβ.13S1) and TRBV2 (Vβ.22). These CDR3 size classes may reflect public clonotypes, defined as those that expressed identical TRBV amino acid sequences and recurred in multiple individuals.
The median number of TRBV subgroups used by CMV pp65/HLA-A*0101-specific CD8+ T cells was 3 (n = 3, range 1–11). Two patients showed peaks of the same size in the TRBV10 (Vβ.12) subset; this may reflect public TR clonotypes.
CMV pp65/HLA-A*0201 specific CD8+ T cells used a median of 2 (n = 5, range 2–10) TRBV subgroups with responses from four out of five patients using only two different TRBV subgroups, whereas cells from the remaining patient used 10 different TRBV subgroups. Peaks corresponding to the same length of CDR3 in different patients (and which may therefore reflect public TR clonotypes) were observed for TRBV7 (Vβ.6), TRBV10 (Vβ.12) and TRBV30 (Vβ.20).
The CMV pp65/HLA-A*2402-specific CD8+ T cells were analysed from three haematopoietic stem cell transplant recipients. The median number of TRBV subgroups used was 2 (n = 3, range 1–4). However, cells from one of these patients (patient 11) were sorted with MACS MicroBeads. These were of lower purity than the flow-sorted cells and of higher TR diversity. For each Vβ subset, CDR3 size classes were different between all patients.
The median number of TRBV subgroups used by CMV pp65/HLA-B*3501-specific CD8+ T cells was 3·5 (n = 6, range 2–7). As with the previous specificity, when flow-sorted cells of high purity were analysed, a more limited diversity was seen, with only two TRBV subtypes used in each patient (n = 3). The same CDR3 size classes were observed for TRBV28 (Vβ.3), TRBV7 (Vβ.6), TRBV10 (Vβ.12) and TRBV15 (Vβ.24). These CDR3 size classes may reflect public TR clonotypes and a selection of those (TRBV7 and TRBV10 from three patients, Fig. 3) were cloned for sequencing purposes.
Figure 3.
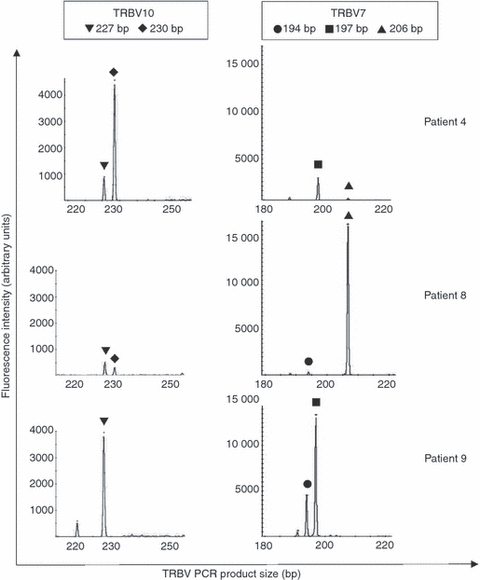
T-cell receptor (TR) spectratyping of pp65 (123–131)/HLA-B*3501 sorted cell populations from patients 4, 8 and 9. Frequency histograms of TRBV7 and TRBV10 spectratyping are from sorted tetramer binding cells. Similarities in CDR3 size classes are marked by symbols.
TRBV7 (Vβ.6) and TRBV10 (Vβ.12) sequences reveal no obligatory public TR usage by CMV pp65/HLA-B*3501-specific CD8+ T cells
We have used TR Vβ spectratyping to estimate the diversity of T cells responding to individual CMV epitopes presented by a range of common HLA class I molecules, and have shown that most responses use a limited number of TRBV subgroups and within each of those only one or a few peaks (CDR3 size classes) can be identified.
However, the use of this methodology cannot define clonality, as it does not assess the extent of heterogeneity within a particular TR Vβ CDR3 size class. Therefore some of the TRBV PCR products from sorted tetramer-binding cells were cloned and a range of clones were selected for nucleotide sequencing to determine whether the same rearrangement size reflected an identical receptor. A public TR sequence had been reported in CMVpp65/HLA-B*3501-specific CD8+ T cells.23 Therefore two TRBV subgroups, TRBV7 and TRBV10, that were used by CMV pp65/HLA-B*3501-specific CD8+ T cells from patients 4, 8 and 9 were chosen to further investigate identical size classes.
Spectratyping had revealed that one TRBV10 size class (227 bp PCR product) was found in patients 4, 8 and 9, whereas a second TRBV10 size class (230 bp PCR product) was found in patients 4 and 8 (Fig. 3). For these MACSBead-sorted cells only those with stronger fluorescent signals in cDNA obtained from the tetramer-binding cell fraction rather than from the cell fraction that did not bind tetramer were considered genuine in Table 4. This was the case for TR Vβ PCR products of 227 bp from patients 4 and 9 and those of the 230 bp from patient 4.
For TRBV7, results from spectratyping analysis of CMV pp65/HLA-B*3501-specific CD8+ T cells from patients 4, 8 and 9 demonstrated that one size class (197 bp PCR product) was present in patients 4 and 9. A second size class (206 bp PCR product) was present in patients 4 and 8. A third size class (194 bp PCR product) was found in patients 8 and 9 (Fig. 3). However, this size class did not demonstrate a higher fluorescent signal in tetramer-binding cell fractions than in cell fractions that did not bind tetramer and was therefore not considered in Table 4.
To ask whether the single peaks identified by PCR truly represented a single rearrangement, and not a mixture of rearrangements sampled from the most abundant size class, TRBV7 and TRBV10 PCR products obtained from cDNA from tetramer-binding cell fractions from patients 4, 8 and 9 were cloned and sequenced for subsequent junctional analysis. The IMGT/V-QUEST software program18 was used to analyse which V, D and J genes were used by TRBV domains (V-D-J regions) from tetramer-binding CMV-specific CD8+ T cells.
Table 5 demonstrates a restricted diversity of nucleotide sequences of TRBV10 clones from CMV-specific CD8+ T cells within each individual. This is especially pronounced in clones from patient 8, which all (n = 8) demonstrated the same sequence. Hence, the individual peaks identified do represent unique rearrangements. Shared (i.e. public) clonotypes were not observed in the selected patients and the receptors used by different individuals contained different TRBV genes. In addition to TR rearrangements with PCR product sizes of 227 and 230 bp described above, there was a productively rearranged TR with a PCR product size of 233 bp detected in sequenced T-cell clones from patient 9, which had not been detected by spectratyping. A TR rearrangement with a PCR product size of 221 bp, which was detected in the spectratype of patient 9, was found to be a non-productive rearrangement when junctions of sequenced T-cell clones were analysed.
Table 5.
Junctional analysis of TRBV10 (Vβ.12) clones found in CMV pp65/HLA-B*3501-specific CD8+ T cells from patients 4, 8 and 9
| Patient (PCR size, bp) | TRBV1 | V(D)J | TRBD | TRBJ | CDR3 length | F |
|---|---|---|---|---|---|---|
| 4 (230) | 10-1*01/02 | CASNPGTGTDTQYF | 1*01 | 2-3*01 | 12 | 5/9 |
| 4 (230) | 10-1*01/02 | CASNPGTGADEQYF | 1*01 | 2-7*01 | 12 | 2/9 |
| 4 (227) | 10-1*01/02 | CASNAGTGNEQYF | 1*01 | 2-7*01 | 11 | 1/9 |
| 4 (230) | 10-1*01/02 | CASNAGTGTDTQYF | 1*01 | 2-3*01 | 12 | 1/9 |
| 9 (227) | 10-3*01/02/03/04 | CAISVAARGEQFF | 2*01 | 2-1*01 | 11 | 4/9 |
| 9 (233) | 10-3*01/02/03/04 | CAISETTRGDSPLHF | 1*01 | 1-6*02 | 13 | 2/9 |
| 9 (233) | 10-3*01/02/03/04 | CAISXTTRGDSPLHF | 1*01 | 1-6*02 | 13 | 1/9 |
| 9 (221) | 10-1*01/02 | CASSDLI#GYTF | – | 1-2*01 | NR(O) | 2/9 |
| 8 (227) | 10-3*01/02/03/04 | CAISGRGDTEAFF | 1*01 | 1-1*01 | 11 | 8/8 |
This table lists the genes and potential alleles used by TRBV10 clones and their V–D–J junctions. The junctions extend from 2nd-CYS 104 to J-PHE 118, according to the IMGT unique numbering. Similarities between sequences from different individuals are highlighted in bold. The frequency of clones detected is shown in column F. Two clones were found to have unproductively rearranged sequences because of out of frame (O) junctional sequences and are shown in grey. NR, not relevant.
V alleles could not be determined unambiguously because of short PCR products.
Junctional analysis of TRBV7 clones is illustrated in Table 6. As with TRBV10, a restricted diversity within each individual of TR Vβ rearrangements of CMV-specific CD8+ T cells can also be observed for TRBV7. A dominant sequence in five of six T-cell clones from patient 4, in nine of 11 T-cell clones from patient 8 and in five of 10 T-cell clones from patient 9 can be observed. TR Vβ rearrangements with a PCR product size of 206 bp (for which a major peak was observed in patient 8's spectratype and a very small peak in patient 4's spectratype) were only detected in sequenced T-cell clones from patient 8 but not patient 4, consistent with their relative abundance in the spectratype. TR Vβ rearrangements with a PCR product size of 197 bp found in spectratypes from patients 4 and 9 were found to be different and non-productive when the junctions of the sequenced T-cell clones were analysed. T-cell receptor rearrangements with a PCR product size of 194 bp detected in patient 8 and 9 by spectratyping and T-cell cloning shared a minor junctional CDR3 motif (ASSL) originating from TRBV7, which is highlighted in bold in Table 5. Again, no public clonotypes were observed and T-cell clones were rearranged from different TRBD and TRBJ genes in the selected patients. Additional small PCR amplifications of other sizes detected by spectratyping were not found by sequencing analysis of 6–11 T-cell clones generated from each patient. Conversely, a non-productive TR rearrangement with a PCR product size of 200 bp was observed by T-cell cloning and sequencing from patient 4 although no amplified product of the corresponding size was observed by spectratyping analysis.
Table 6.
Junctional analysis of TRBV7 (Vβ.6) clones found in CMV pp65/HLA-B*3501-specific CD8+ T cells from patients 4, 8 and 9
| Patient (PCR size, bp) | TRBV1 | V(D)J | TRBD | TRBJ | CDR3 length | F |
|---|---|---|---|---|---|---|
| 4 (197) | 7-3/4/6/7/8/9 | CASSVRLAGA#YEQYF | 2*01 | 2-7*01 | NR (O) | 5/6 |
| 4 (200) | 7-3/4/6/7/8/9 | VSLCQQLRSGRSG##EQYF | 2*02 | 2-7*01 | NR (O, S) | 1/6 |
| 8 (206) | 7-4/6/7/8 | CASSLGAGTFKTNEKLFF | 1*01 | 1-4*01 | 16 | 9/11 |
| 8 (194) | 7-3/6/7 | CASSLTDGDQPQHF | 1*01 | 1-5*01 | 12 | 1/11 |
| 8 (206) | 7-3/4/6/7/8 | VSLC*QLRGRDF*#TNEKLFF | 1*01 | 1-4*01 | NR (O, S) | 1/11 |
| 9 (194) | 7-4/6/7/8/9 | CASSLVASQETQYF | 2*01 | 2-5*01 | 12 | 1/10 |
| 9 (197) | 7-3/4/6/7/8 | VSLCQHLPRGRV#ETQYF | 2*01 | 2-5*01 | NR (O, S) | 5/10 |
| 9 (197) | 7-3/4/6/7/8 | CASIYRGAG*ETQYF | 2*01 | 2-5*01 | NR (O, S) | 2/10 |
| 9 (194) | 7-3/4/6/7/8/9 | VSLCQQLSG*#QETQYF | 2*01 | 2-5*01 | NR (O, S) | 1/10 |
| 9 (197) | 7-3/4/6/7/8 | VSLCQHLPRGRVRDPV#F | 2*01 | 2-5*01 | NR (O, S) | 1/10 |
This table lists the potential genes used by TRBV7 clones. V–D–J junctions are described in a similar manner as in Table 5. ‘O’ indicates that clones had an out of frame junction, whereas ‘S’ indicates presence of stop codons. NR, not relevant.
V genes could not be determined unambiguously because of short PCR products.
In summary, the estimation of the diversity of T cells responding to individual CMV epitopes presented by a range of common HLA class I molecules has shown that most responses use a limited number of TRBV subgroups and within each of those only one or a few peaks (CDR3 size classes) can be identified. The level of repertoire complexity does not directly correlate with the different threshold T-cell numbers that we had previously shown to be associated with protective immunity for different CMV peptide /HLA.12 However, we observed a trend towards the maximum number of TRBV used in CD8+ T cells targeting CMV pp50 (245–253) being greater than in CD8+ T cells targeting various CMV pp65 peptides. Additional clonotypic analysis of CD8+ T cells targeting one of the CMV pp65 peptides, CMV pp65/HLA-B*3501 specific CD8+ T cells, demonstrated heterogeneity at the junctional region of the dominant TR Vβ CDR3 size classes for TRBV7 (most of which were found to be non-productive rearrangements) and TRBV10 in different patients. Hence the same rearrangement sizes did not reflect identical TR with public TR sequence used by these antigen-specific T cells.
Discussion
Knowledge of the clonality of virus-specific immune cells is an important component of understanding what constitutes an effective and a protective immune response. As an example, a monoclonal T-cell response may be very effective in controlling an initial viral infection, but because viral escape mutants may readily arise, it may be ineffective in long-term protection, at least for viruses with high sequence variability. It is, however, unlikely that such escape variants are produced for all TR specificities of a polyclonal immune response. Furthermore, the clonality of CMV-specific CD8+ T cells present at a significant frequency in peripheral blood has a wide-ranging impact on patients. Although there is an obvious benefit in protection against CMV-related disease, the persistent drive of CMV is linked to the accumulation of expanded populations of exhausted or anergic cells in the elderly24 and immunosenescence, a process of age-associated deterioration of immune functions.25 This effective shrinkage of the functional T-cell repertoire may render individuals susceptible to infections other than CMV26 especially if the expanded populations are of low clonal diversity.
The median number of TRBV subgroups used by CMV pp65/HLA-A*0201-specific CD8+ T cells analysed in this project is comparable with those of previous reports. A study by Peggs et al. reported that pp65/HLA-A*0201-specific CD8+ T cells in healthy individuals used 5–20 TRBV subgroups (median 10). These included TRBV3, 5, 6, 7, 9, 12, 19, 20, 24, 27 and 29 subgroups (IMGT nomenclature14,27,28) with major amplifications in the TRBV6, TRBV7 and TRBV12 subgroups. Conservation of CDR3 size classes was not observed.29 In comparison, TRBV subgroups that were used by CMV pp65/HLA-A*0201-specific CD8+ T cells in our cohort of five HSCT patients used 2–10 TRBV subgroups (median 2) including TRBV3, 6 (Vβ.13S1), 7, 9, 10, 12, 15, 19, 27, 29 and 30 subgroups. The diversity of the TR repertoire of these antigen-specific cells was restricted to one or two different CDR3 size classes in most TRBV subgroups and did not exceed four in any TRBV subgroup, similar to observations by Peggs et al.29 However, a more restricted TR Vβ usage with one or two predominant TRBV subgroups in each individual within TRBV2, 6 (Vβ.13S1), 7, 19, 27 and 30 was shown by Wills et al.30 and confirmed in a later study by the same group detecting TRBV3, 4, 6 (Vβ.13S1), 7, 12, 19 and 27.31 In comparison, diversity was restricted to one or two CDR3 class sizes in only two different TRBV subgroups in most patients of our cohort, but inter-individual variability was evident by the observation of 11 different TRBV subgroups. The findings on TR diversity of CMV pp65/HLA-A2-specific CD8+ T cells were used further for comparison with CMV-specific CD8+ T cells targeting other peptide/HLA combinations.
The overall analysis of the TR diversity of CMV-specific CD8+ T cells targeting various peptide/HLA combinations demonstrated that most cells used TRBV7 and TRBV10 subgroups (Table 4). However, CDR1 and CDR2 of TR Vα, and to a lesser degree those of Vβ, interact primarily with the HLA part of the peptide/HLA complex and are encoded in the germline V genes, whereas the CDR3 regions of both Vα (TRA V–J junction) and Vβ (TRB V–D–J junction) are located in the centre of the TR/peptide/HLA interaction region and interact primarily with the peptide.32,33 Therefore, it may be expected that CMV peptides presented by different HLA may be recognized by TRs with different CDR1 and CDR2, and therefore different TRAV and TRBV subgroups. The common usage of TRBV7 and TRBV10 in different responses raises the question of whether this finding may have resulted from an artefact introduced by variable efficiencies of primers specific for different TRBV subgroups. Another possible explanation for this finding would be differential usage of TRBV subgroups by PBMCs from the general population.17 However, a study analysing variations in the human TRBV repertoire demonstrated predominance of TRBV7, TRBV10 and TRBV29 among 250 sequences from five healthy volunteers.34 Importantly, this analysis was performed by anchored PCR, so avoiding any potential bias introduced by varying efficiencies of different 3′ Vβ primers. These findings argue against the prominent TRBV7 and TRBV10 usage we observe in CMV-specific CD8+ T cells being an artefact of the different efficiencies of Vβ primers in our study. Instead, they suggest that the use of TRBV7 (comprising seven functional genes) and TRBV10 (comprising three functional genes) by CMV-specific CD8+ T cells reflects the underlying distribution of TRBV within PBMC.
A comparison of TRs used by CD8+ T cells targeting different CMV epitopes revealed that the maximal TR Vβ breadth was lower in CD8+ T cells targeting different CMV pp65 peptides (up to 16 TR size classes used) than in CD8+ T cells targeting the CMV pp50 (245–253) peptide (up to 38 TR size classes used). To our knowledge, this is the first study to analyse the T-cell repertoire diversity of CMV pp50-specific CD8+ T cells. The TR Vβ analysis of CMV-specific CD8+ T cells requires the screening of a large number of HLA-typed patients to find individuals with a response large enough for robust molecular analysis. This pilot study of a small number of samples from patients at varying clinical states, all at a time post-transplantation when they had recovered a high number of specific cells, shows a trend suggesting that the maximal TR breadth of pp50 (245–253)-specific CD8+ T cells is greater than of pp65-specific CD8+ T cells, although this did not reach statistical significance. We believe that these first data on the TR breadth of CMV pp50 (245–253)-specific CD8+ T cells are important to spark further investigative efforts in multi-centre trials. Six additional CMV pp50 epitopes have been demonstrated to elicit CD8+ T-cell responses, restricted by HLA-A1, HLA-A2, HLA-A3 or HLA-B44.35 Statistical analysis of the diversity of TR targeting these peptides in a larger patient cohort may be informative to determine whether CD8+ T cells targeting CMV pp50 have a more diverse repertoire in general than those targeting CMV pp65, whether the higher level of diversity is a property specific to individual peptides or whether the difference we have observed merely reflects a particularly diverse outlier in our cohort. Studies on cellular responses to CMV pp50 have only recently emerged in the literature and knowledge of the immunogenicity of CMV pp50 is far more restricted than the knowledge of the properties of CMV pp65 although CMV pp50 is one of the most immunogenic CMV proteins in the generation of a humoral response.36
Since our findings suggest that CD8+ T cells targeting CMV pp50 (245–253) are less restricted than those targeting various CMV pp65 peptides, it may be possible that the focusing of a diverse primary CMV pp50-specific CD8+ T-cell response with selection of clones with high-affinity TR into the memory CD8+ T-cell pool is less prominent than in CMV pp65-specific CD8+ T cells. It may also be possible that CD8+ T-cell responses specific for pp50 and pp65, which were both shown to be dominant components of the natural T-cell response to CMV,37 may demonstrate varying efficiency in viral control. This remains to be investigated in future studies.
We have taken a closer look at a selection of cells with identical TR size classes in three patients to analyse whether the peaks observed were in fact clonal or whether they represent mixtures of clones of the same CDR3 length. CDR3 sequences of TRBV7 and TRBV10 subsets of CMV pp65/HLA-B*3501-specific CD8+ T cells demonstrated dominant clones in each individual with very limited inter-individual junctional similarity. TRBV7 rearrangements in two out of three patients analysed in our study were found to be non-productive, and could not contribute to the CMV-specific TR expressed on the cell surface. The selection of the cells containing these non-productive rearrangements was presumably based on a second productive rearrangement that gave rise to a CMV-specific TR and indicates clearly that mRNA from a non-productively rearranged chromosome in some T cells can confuse the interpretation of spectratyping results. Hence, a combination of spectratyping and sequencing of TR junctional regions is optimal to give a full picture of the TR Vβ repertoire. Spectratyping can provide a fast method to screen antigen-specific cell populations from different individuals. However, only sequencing can determine whether identical peaks observed by spectratyping are clonal, whether they are similar and whether they are productively rearranged.
Acknowledgments
We gratefully acknowledge the support of Niga Nawroly (Imperial College, London, UK) for flow cytometry-based cell sorting and of the Bone Marrow Transplantation team and clinical staff at Crowley Ward at the Royal Free Hospital for help with recruiting patients and collecting blood samples. The patients who volunteered for the study are saluted for their commitment and consideration in providing blood specimens.
Acknowledgments
The authors have no conflict of interest to disclose.
Glossary
Abbreviations
- APC
allophycocyanin
- CD
cluster of differentiation
- CDR
complementary-determining region
- CFSE
carboxyfluorescein succinimidyl ester
- CMV
cytomegalovirus
- FCS
fetal calf serum
- GVH
graft versus host
- HCST
haematopoietic stem cell transplantation
- IMGT
the international IMmunoGeneTics information system®
- MACS
magnetic antibody cell sorting
- PBMC
peripheral blood mononuclear cells
- PE
phycoerythrin
- PHA
phytohaemagglutinin
- TR
T cell receptor (TR, the abbreviation officially approved by the WHO/IUIS nomenclature subcommittee for T cell receptors since the International Congress of Immunology in San Francisco in 1995)
References
- 1.Sissons JG, Bain M, Wills MR. Latency and reactivation of human cytomegalovirus. J Infect. 2002;44:73–7. doi: 10.1053/jinf.2001.0948. [DOI] [PubMed] [Google Scholar]
- 2.Zanghellini F, Boppana SB, Emery VC, Griffiths PD, Pass RF. Asymptomatic primary cytomegalovirus infection: virologic and immunologic features. J Infect Dis. 1999;180:702–7. doi: 10.1086/314939. [DOI] [PubMed] [Google Scholar]
- 3.Gandhi MK, Wills MR, Sissons JG, Carmichael AJ. Human cytomegalovirus-specific immunity following haemopoietic stem cell transplantation. Blood Rev. 2003;17:259–64. doi: 10.1016/s0268-960x(03)00028-6. [DOI] [PubMed] [Google Scholar]
- 4.Boeckh M, Leisenring W, Riddell SR, et al. Late cytomegalovirus disease and mortality in recipients of allogeneic hematopoietic stem cell transplants: importance of viral load and T-cell immunity. Blood. 2003;101:407–14. doi: 10.1182/blood-2002-03-0993. [DOI] [PubMed] [Google Scholar]
- 5.Boeckh M, Nichols WG, Papanicolaou G, Rubin R, Wingard JR, Zaia J. Cytomegalovirus in hematopoietic stem cell transplant recipients: current status, known challenges, and future strategies. Biol Blood Marrow Transplant. 2003;9:543–58. doi: 10.1016/s1083-8791(03)00287-8. [DOI] [PubMed] [Google Scholar]
- 6.Matthes-Martin S, Aberle SW, Peters C, et al. CMV-viraemia during allogenic bone marrow transplantation in paediatric patients: association with survival and graft-versus-host disease. Bone Marrow Transplant. 1998;21(Suppl. 2):S53–6. [PubMed] [Google Scholar]
- 7.Boeckh M, Ljungman P. How we treat cytomegalovirus in hematopoietic cell transplant recipients. Blood. 2009;113:5711–9. doi: 10.1182/blood-2008-10-143560. [DOI] [PMC free article] [PubMed] [Google Scholar]
- 8.Boutolleau D, Deback C, Bressollette-Bodin C, et al. Resistance pattern of cytomegalovirus (CMV) after oral valganciclovir therapy in transplant recipients at high-risk for CMV infection. Antiviral Res. 2009;81:174–9. doi: 10.1016/j.antiviral.2008.11.003. [DOI] [PubMed] [Google Scholar]
- 9.Reusser P, Einsele H, Lee J, et al. Randomized multicenter trial of foscarnet versus ganciclovir for preemptive therapy of cytomegalovirus infection after allogeneic stem cell transplantation. Blood. 2002;99:1159–64. doi: 10.1182/blood.v99.4.1159. [DOI] [PubMed] [Google Scholar]
- 10.Kapp M, Tan SM, Einsele H, Grigoleit G. Adoptive immunotherapy of HCMV infection. Cytotherapy. 2007;9:699–711. doi: 10.1080/14653240701656046. [DOI] [PubMed] [Google Scholar]
- 11.Quinnan GV, Jr, Kirmani N, Rook AH, et al. Cytotoxic T cells in cytomegalovirus infection: HLA-restricted T-lymphocyte and non-T-lymphocyte cytotoxic responses correlate with recovery from cytomegalovirus infection in bone-marrow-transplant recipients. N Engl J Med. 1982;307:7–13. doi: 10.1056/NEJM198207013070102. [DOI] [PubMed] [Google Scholar]
- 12.Giest S, Grace S, Senegaglia AC, et al. Cytomegalovirus-specific CD8+ T cells targeting different HLA/peptide combinations correlate with protection but at different threshold frequencies. Br J Haematol. 2010;148:311–22. [PubMed] [Google Scholar]
- 13.Lacey SF, Martinez J, Gallez-Hawkins G, et al. Simultaneous reconstitution of multiple cytomegalovirus-specific CD8+ cell populations with divergent functionality in hematopoietic stem-cell transplant recipients. J Infect Dis. 2005;191:977–84. doi: 10.1086/428136. [DOI] [PubMed] [Google Scholar]
- 14.Lefranc M-P, Lefranc G. The T cell Receptor FactsBook. San Diego, CA; London: Academic Press; 2001. [Google Scholar]
- 15.Wei S, Charmley P, Robinson MA, Concannon P. The extent of the human germline T-cell receptor V β gene segment repertoire. Immunogenetics. 1994;40:27–36. doi: 10.1007/BF00163961. [DOI] [PubMed] [Google Scholar]
- 16.Fernandes S, Chavan S, Chitnis V, Kohn N, Pahwa S. Simplified fluorescent multiplex PCR method for evaluation of the T-cell receptor V β-chain repertoire. Clin Diagn Lab Immunol. 2005;12:477–83. doi: 10.1128/CDLI.12.4.477-483.2005. [DOI] [PMC free article] [PubMed] [Google Scholar]
- 17.Choi YW, Kotzin B, Herron L, Callahan J, Marrack P, Kappler J. Interaction of Staphylococcus aureus toxin “superantigens” with human T cells. Proc Natl Acad Sci U S A. 1989;86:8941–5. doi: 10.1073/pnas.86.22.8941. [DOI] [PMC free article] [PubMed] [Google Scholar]
- 18.Brochet X, Lefranc MP, Giudicelli V. IMGT/V-QUEST: the highly customized and integrated system for IG and TR standardized V-J and V-D-J sequence analysis. Nucleic Acids Res. 2008;36:W503–8. doi: 10.1093/nar/gkn316. [DOI] [PMC free article] [PubMed] [Google Scholar]
- 19.Yousfi Monod M, Giudicelli V, Chaume D, Lefranc MP. IMGT/JunctionAnalysis: the first tool for the analysis of the immunoglobulin and T cell receptor complex V-J and V-D-J junctions. Bioinformatics. 2004;20(Suppl. 1):i379–85. doi: 10.1093/bioinformatics/bth945. [DOI] [PubMed] [Google Scholar]
- 20.Lefranc MP, Giudicelli V, Ginestoux C, et al. IMGT, the international ImMunoGeneTics information system. Nucleic Acids Res. 2009;37:D1006–12. doi: 10.1093/nar/gkn838. [DOI] [PMC free article] [PubMed] [Google Scholar]
- 21.Wotton D, Ways DK, Parker PJ, Owen MJ. Activity of both Raf and Ras is necessary for activation of transcription of the human T cell receptor beta gene by protein kinase C, Ras plays multiple roles. J Biol Chem. 1993;268:17975–82. [PubMed] [Google Scholar]
- 22.Fallen PR, Duarte RF, McGreavey L, Potter M, Ethell M, Prentice HG, Madrigal JA, Travers PJ. Identification of non-naive CD4+ CD45RA+ T cell subsets in adult allogeneic haematopoietic cell transplant recipients. Bone Marrow Transplant. 2003;32:609–16. doi: 10.1038/sj.bmt.1704185. [DOI] [PubMed] [Google Scholar]
- 23.Brennan RM, Miles JJ, Silins SL, Bell MJ, Burrows JM, Burrows SR. Predictable αβ T-cell receptor selection toward an HLA-B*3501-restricted human cytomegalovirus epitope. J Virol. 2007;81:7269–73. doi: 10.1128/JVI.00356-07. [DOI] [PMC free article] [PubMed] [Google Scholar]
- 24.Khan N, Shariff N, Cobbold M, Bruton R, Ainsworth JA, Sinclair AJ, Nayak L, Moss PA. Cytomegalovirus seropositivity drives the CD8 T cell repertoire toward greater clonality in healthy elderly individuals. J Immunol. 2002;169:1984–92. doi: 10.4049/jimmunol.169.4.1984. [DOI] [PubMed] [Google Scholar]
- 25.Northfield J, Lucas M, Jones H, Young NT, Klenerman P. Does memory improve with age? CD85j (ILT-2/LIR-1) expression on CD8 T cells correlates with ‘memory inflation’ in human cytomegalovirus infection. Immunol Cell Biol. 2005;83:182–8. doi: 10.1111/j.1440-1711.2005.01321.x. [DOI] [PubMed] [Google Scholar]
- 26.Hadrup SR, Strindhall J, Kollgaard T, Seremet T, Johansson B, Pawelec G, thor Straten P, Wikby A. Longitudinal studies of clonally expanded CD8 T cells reveal a repertoire shrinkage predicting mortality and an increased number of dysfunctional cytomegalovirus-specific T cells in the very elderly. J Immunol. 2006;176:2645–53. doi: 10.4049/jimmunol.176.4.2645. [DOI] [PubMed] [Google Scholar]
- 27.Folch G, Lefranc MP. The human T cell receptor β variable (TRBV) genes. Exp Clin Immunogenet. 2000;17:42–54. doi: 10.1159/000019123. [DOI] [PubMed] [Google Scholar]
- 28.Giudicelli V, Chaume D, Lefranc MP. IMGT/GENE-DB: a comprehensive database for human and mouse immunoglobulin and T cell receptor genes. Nucleic Acids Res. 2005;33:D256–61. doi: 10.1093/nar/gki010. [DOI] [PMC free article] [PubMed] [Google Scholar]
- 29.Peggs K, Verfuerth S, Pizzey A, Ainsworth J, Moss P, Mackinnon S. Characterization of human cytomegalovirus peptide-specific CD8+ T-cell repertoire diversity following in vitro restimulation by antigen-pulsed dendritic cells. Blood. 2002;99:213–23. doi: 10.1182/blood.v99.1.213. [DOI] [PubMed] [Google Scholar]
- 30.Wills MR, Carmichael AJ, Mynard K, Jin X, Weekes MP, Plachter B, Sissons JG. The human cytotoxic T-lymphocyte (CTL) response to cytomegalovirus is dominated by structural protein pp65: frequency, specificity, and T-cell receptor usage of pp65-specific CTL. J Virol. 1996;70:7569–79. doi: 10.1128/jvi.70.11.7569-7579.1996. [DOI] [PMC free article] [PubMed] [Google Scholar]
- 31.Weekes MP, Wills MR, Mynard K, Carmichael AJ, Sissons JG. The memory cytotoxic T-lymphocyte (CTL) response to human cytomegalovirus infection contains individual peptide-specific CTL clones that have undergone extensive expansion in vivo. J Virol. 1999;73:2099–108. doi: 10.1128/jvi.73.3.2099-2108.1999. [DOI] [PMC free article] [PubMed] [Google Scholar]
- 32.Kaas Q, Lefranc MP. T cell receptor/peptide/MHC molecular characterization and standardized pMHC contact sites in IMGT/3Dstructure-DB. In Silico Biol. 2005;5:505–28. [PubMed] [Google Scholar]
- 33.Wilson RK, Lai E, Concannon P, Barth RK, Hood LE. Structure, organization and polymorphism of murine and human T-cell receptor α and β chain gene families. Immunol Rev. 1988;101:149–72. doi: 10.1111/j.1600-065x.1988.tb00736.x. [DOI] [PubMed] [Google Scholar]
- 34.Rosenberg WM, Moss PA, Bell JI. Variation in human T cell receptor Vβ and Jβ repertoire: analysis using anchor polymerase chain reaction. Eur J Immunol. 1992;22:541–9. doi: 10.1002/eji.1830220237. [DOI] [PubMed] [Google Scholar]
- 35.Elkington R, Walker S, Crough T, Menzies M, Tellam J, Bharadwaj M, Khanna R. Ex vivo profiling of CD8+-T-cell responses to human cytomegalovirus reveals broad and multispecific reactivities in healthy virus carriers. J Virol. 2003;77:5226–40. doi: 10.1128/JVI.77.9.5226-5240.2003. [DOI] [PMC free article] [PubMed] [Google Scholar]
- 36.Gergely L, Czegledy J, Vaczi L. Human antibody response to human cytomegalovirus-specific DNA-binding proteins. Acta Virol. 1988;32:1–5. [PubMed] [Google Scholar]
- 37.Sylwester AW, Mitchell BL, Edgar JB, et al. Broadly targeted human cytomegalovirus-specific CD4+ and CD8+ T cells dominate the memory compartments of exposed subjects. J Exp Med. 2005;202:673–85. doi: 10.1084/jem.20050882. [DOI] [PMC free article] [PubMed] [Google Scholar]