

Abstract
The mammalian auditory system contains descending neural pathways, some of which project onto the cochlea via the medial olivocochlear (MOC) system. The function of this efferent auditory system is not entirely clear. Behavioral studies in animals with olivocochlear (OC) lesions suggest that the MOC serves to facilitate sound localization in noise. In the current work, noise-induced OC activity (the OC reflex) and sound-localization performance in noise were measured in normal-hearing humans. Consistent with earlier studies, both measures were found to vary substantially across individuals. Importantly, significant correlations were observed between OC-reflex strength and the effect of noise on sound-localization performance; the stronger the OC reflex, the less marked the effect of noise. These results suggest that MOC activation by noise helps to counteract the detrimental effects of background noise on neural representations of direction-dependent spectral features, which are especially important for accurate localization in the up/down and front/back dimensions.
Introduction
In addition to ascending neural pathways, the mammalian auditory system contains a network of descending, or efferent, pathways. The terminal branch of this network, known as the olivocochlear (OC) system, links nuclei of the superior olivary complex to the cochlea and auditory nerve (Guinan, 2006). The OC system consists of two branches: the lateral olivocochlear system, which innervates afferent auditory-nerve fibers (ANFs), and the medial olivocochlear (MOC) system, which terminates onto the cochlear outer hair cells (OHCs). Physiological studies have revealed that activation of the OC system alters cochlear responses (Murugasu and Russell, 1996) and suppresses ANF responses to sounds in a quiet background (Ruben and Sekula, 1960; Gifford and Guinan, 1983), but enhances ANF responses to sounds embedded in a noise background (Kawase et al., 1993). Accordingly, it has been proposed that a major function of the MOC system is to facilitate the detection or discrimination of sounds, such as speech, in the presence of background noise (Dewson, 1968; Micheyl and Collet, 1996; de Boer and Thornton, 2008).
In addition to detecting and discriminating sounds, humans and animals must often localize sounds to react appropriately to them—for instance, by orienting their gaze or running from a predator or toward prey. This ability relies on a multiplicity of cues: interaural differences in sound intensity and arrival time (or phase; so-called binaural cues), which are used primarily for left/right distinctions, and spectral features (e.g., dips or peaks in the spectrum) introduced by direction-dependent filtering of sounds by the pinnae, head, and torso (so-called spectral cues), which are used primarily for localization in the up/down and front/back dimensions (Middlebrooks and Green, 1991). Judgments in the up/down and front/back dimensions are highly sensitive to signal-to-noise ratio (SNR) degradation (Good and Gilkey, 1996; Best et al., 2005). It has been suggested that the MOC system can help to counteract detrimental effects of background noise on sound localization by unmasking spectral cues (Reiss et al., 2011). Behavioral studies, which have found poorer sound-localization performance in cats with a lesioned OC system than in controls, have provided some support for this hypothesis (May et al., 2004). However, so far, no study has reported evidence for a relationship between sound-localization performance and MOC activity under physiological conditions, i.e., in normal-hearing subjects with a fully functional OC system.
This study sought to investigate the relationship between the OC reflex—a measure of noise-induced MOC influence on the auditory periphery (Guinan, 2006)—and sound localization in noise in normal-hearing human listeners. Building upon earlier findings of substantial interindividual variability in both OC-reflex strength (Backus and Guinan, 2007) and sound-localization performance in noise (Good and Gilkey, 1996; Lorenzi et al., 1999; Best et al., 2005), we hypothesized that the impact of noise on sound-localization performance would be less in listeners in whom the OC reflex is strong than in listeners in whom the OC reflex is weaker.
Materials and Methods
Participants.
Eighteen volunteers (eight females; mean age, 32 ± 9 years) participated in the study. All had normal hearing (defined as thresholds of 15 dB HL or less at octave frequencies between 125 and 8000 Hz) and no history of auditory pathology. Otoscopy, tympanometry, and acoustic reflexes were also normal. All subjects were right-handed according to the Edinburgh handedness inventory (Oldfield, 1971). In agreement with the guidelines of the Declaration of Helsinki and of the Huriet law regulating biomedical research in humans in France, participants provided written informed consent before inclusion in the study. All participants were paid (10€/h) for their services.
Sound-localization experiment.
Participants were seated on an elevated chair inside a semi-anechoic room (Illsonic Sonex Audio) (Fig. 1a). The position of the chair was adjusted so that the head of the participant was 2.5 m away from each one of eight surrounding speakers. The loudspeakers were mounted on the vertices of a cuboid frame (height, 2.76 m; length, 2.94 m; depth, 2.94 m). The loudspeakers' coordinates (azimuth, elevation) were as follows: 45°, 35°; 135°, 35°; 225°, 35°; 315°, 35°; 45°, −35°; 135°, −35°; 225°, −35°; and 315°, −35°. Acoustic stimuli were generated digitally at a 48 kHz sampling rate using a real-time processor (RX8; Tucker-Davis Technologies) with eight digital-to-analog converters (DACs). The output of each DAC was attenuated (PA5; Tucker-Davis Technologies) and routed to the corresponding loudspeaker via an amplifier (D-75A; Crown). The participants were instructed to look straight ahead and to hold their head and eyes steady during the presentation of the acoustic stimuli. Two video cameras (one in front of the participant, one to the right) allowed constant monitoring of the participant's head position by the experimenter. On each trial, one of the eight loudspeakers emitted a brief signal (200 ms burst of pink noise bandpass filtered between 300 and 9000 Hz using fourth-order Butterworth filters, and including 36 ms on/off cos-squared ramps). The speaker emitting the signal was selected pseudorandomly such that all eight speakers emitted the signal an equal number of times across all trials corresponding to a given stimulus condition. The level of the signal (measured in the center of the cuboid speaker array) was fixed at 55 dB SPL. The signal was presented in quiet or centered temporally within a longer-duration burst (500 ms, including 36 ms on/off cos-squared ramps) of pink noise, which was bandpass filtered between 125 and 15,000 Hz (fourth-order Butterworth filters). This masker was played simultaneously on all eight speakers, with no correlation in its temporal fine structure across speakers to create a diffuse-field sensation (ISO 4869-1). The masker level (measured in the center of the speaker array) was set relative to the level of the signal so as to produce six different SNRs ranging from −7.5 to +5 dB in 2.5 dB steps. The task of the participant was to indicate (using an eight-button ovoid response box that mimicked the loudspeakers layout) which one of the eight speakers was the most likely to have produced the signal. Listeners received no feedback concerning the correctness of their responses. Each participant completed four sessions. The first session was devoted to training. Participants were given the opportunity to first familiarize themselves with the task, stimuli, and apparatus. During this training session, they performed 280 trials (5 trials × 8 speakers × 7 conditions corresponding to the six SNR conditions plus the quiet condition) in random order. The three following sessions were test sessions. At the beginning of each test session, participants performed eight practice trials; the data from these practice trials were not included into the analysis. On the remainder of each test session, participants performed 280 trials (5 trials × 8 speakers × 7 conditions). Thus, over the course of the three sessions, each participant performed 840 trials of the localization task.
Figure 1.
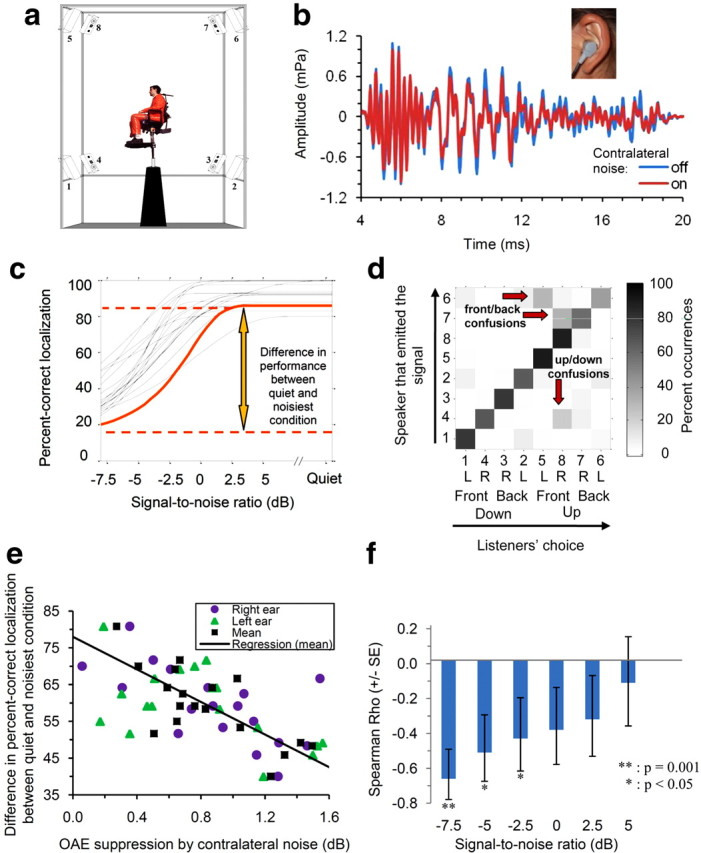
a, Apparatus used to measure sound-source localization. b, Illustration of the contralateral OAE suppression effect used to measure the MOC reflex in humans. The blue and red curves show examples of OAE traces recorded in the ear of one subject without (blue) and with (red) noise in the contralateral ear. Note that in the presence of contralateral noise, OAEs are reduced; this reflects the suppressive influence of noise-induced efferent MOC activity on OHC motility. c, Individual psychometric functions showing percentage correct as a function of SNR in the localization task. d, Confusion matrix showing the proportion of times that a speaker was identified by listeners as having emitted the signal out of the total number of times that this speaker actually emitted the signal, for the −2.5 dB SNR (group-mean data). Speakers are identified by numbers from 1 to 8. These numbers corresponded to those indicated in a. The speakers were ordered based on, first, whether they were below or above the horizontal plane (down/up); second, whether they were in the front of or behind the listener (front/back); and finally, whether they were to the right (R) or the left (L) of the listener. Red arrows indicate entries corresponding to substantial front/back and up/down confusions. e, Scatter plot and regression line relating the differences in percentage correct between the quiet and noisiest conditions in the localization task to the contralateral OAE suppression effects (circles, right ear; triangles, left ear; squares, mean) across the 18 listeners. The regression line is drawn from the mean contralateral OAE suppression (squares). f, Spearman correlation coefficients between contralateral OAE suppression effects and decreases in percentage correct sound-localization because of noise for each SNR tested. The error bars show ± one standard error (SE) of the mean. Significant correlations at the 0.05 level are indicated by an asterisk (*); one correlation, which was significant at the 0.001 level, is indicated by two asterisks (**).
Detection experiment.
The detection experiment involved signal and masker noises having the same spectral and spatial characteristics as in the localization task. The task was of the two-interval two-alternative forced-choice type. On each trial, two 500 ms bursts of noise (masker) were presented, separated by a 1 s silent gap. The signal was added to the first or second masker bursts, with equal a priori probabilities. As in the localization experiment, the masker was presented in diffuse field (i.e., from all eight speakers simultaneously) while the signal (temporally centered within the masker) could be produced by any one of the eight speakers (with equal a priori probabilities). The listener did not know in advance which speaker the signal would be coming from. This was done so that the stimuli and test conditions in this detection experiment would be as comparable as possible to the stimuli and test conditions used in the localization experiment. However, in this experiment, the listeners' task was to indicate whether the signal was in the first interval or the second interval by pressing either the “1” or the “2” button on a response box. Thus, unlike in the localization experiment, the listener did not need to localize the signal to be able to respond correctly. No feedback was provided. Participants performed this detection task for three sessions. Within a session, each participant completed six trials per SNR (−2.5, −5, and −7.5 dB) per loudspeaker (eight loudspeakers), yielding a total of 432 trials across the three sessions. Participants were given the opportunity to familiarize themselves with the task by performing 12 training trials at the beginning of each session.
Otoacoustic-emission recordings and OC-reflex measurements.
During otoacoustic emission (OAE) recordings (Fig. 1b), participants were placed in a reclining chair within a soundproof booth (InterAcoustics 1202A). Stimulus presentation, recording, and processing of OAE traces were performed using the ILO 92 (Otodynamics) software and hardware. OAEs evoked by 80 μs clicks were recorded both in the presence and in the absence of broadband noise at 35 dB sensation level (SL), i.e., 35 dB above detection threshold, in the opposite ear. Five different click levels, ranging from 54 to 66 dB SPL (peak) in 3 dB steps were tested. For each level, 960 clicks were presented with an interclick interval of 20 ms and the OAE traces evoked by each click were averaged together to obtain an average OAE trace for the considered stimulus condition and listener. The root-mean-square amplitude of the average OAE trace was converted to dB SPL to yield a mean OAE level. The five resulting OAE levels (one for each stimulus level) were fitted with a linear function of the stimulus level using a minimum-squared-error criterion. Finally, the Euclidean distance between the best-fitting linear functions through the OAE-versus-stimulus-level data obtained with and without contralateral noise was computed to obtain a measure of OC-reflex strength (Chery-Croze et al., 1994). The five click levels and the two contralateral-noise conditions (with, without) were tested in completely randomized order.
Data analysis.
For each listener separately, the number of correct responses obtained at each SNR across all trials in a given experiment (detection and localization) was divided by the total number of trials at this SNR and multiplied by 100 to obtain percentages of correct responses (PCs). To create the plots in Figure 1c, the PCs were fitted with the following mathematical function, which corresponds to the psychometric function of an unbiased equal-variance Gaussian observer in the m-alternative forced-choice paradigm (Green and Dai, 1991), as predicted by signal-detection theory (Green and Swets, 1966), with an additional scaling factor to account for the possibility of imperfect asymptotic performance.
 |
In this equation, Pmafc(x) is the predicted percentage of correct responses; λ is the lapse rate, reflecting the probability of attentional lapses and/or ambiguous localization cues; ϕ denotes the standard normal function; Φ denotes the cumulative standard function; m is the number of response alternatives (eight for the localization task, two for the detection task); and d′ is the sensitivity index. A power–law relationship between the physical (stimulus) variable, x, and the corresponding internal (sensory) axis was assumed, so that d′(x)= xα/σ, where σ is the SD of internal noise and the exponent α determines the shape (linear, concave, or convex) of the physical-to-sensory mapping. The stimulus variable, x, was equal to 10SNR/20, where SNR is the physical signal-to-noise ratio (in dB). In theory, the SNR for the quiet condition was infinite. However, in practice, some residual ambient noise is always present, and the actual SNR at the listener's ear was finite. For fitting purposes, we set the SNR for the quiet condition to +20 dB, after verifying that the parameter estimates obtained using this value did not differ appreciably from estimates obtained when assuming higher SNRs. The function described by the equation was fitted to individual PC data using a maximum-likelihood procedure (Wichmann and Hill, 2001), with the variables λ, α, and σ as free parameters.
To investigate statistical relationships between OC activity and sound-localization performance, we computed nonparametric (Spearman) correlation coefficients between the Euclidean distance (a measure of the reduction in OAE amplitude caused by contralateral noise; see above for details) and the decrease in the percentage of correct responses (relative to the quiet condition) for the different noise conditions across all 18 participants. Our choice to use a nonparametric measure of correlation was based on the consideration that we did not hypothesize specifically a linear relationship between OAE suppression and PC. Because of earlier results, indicating that MOC activity facilitates the detection or discrimination of signals in noise (Kawase et al., 1993; Micheyl and Collet, 1996), we predicted a negative relationship between OAE suppression and the decrease in PC when going from the quiet to noisy conditions; accordingly, one-tailed tests were used to assess the statistical significance of correlation coefficients between OAE suppression and PC.
Results
Sound localization
The results of the sound-localization experiment are illustrated in Figure 1, c and d. Figure 1c shows individual psychometric functions. As expected, PC was generally the lowest in the lowest SNR condition (−7.5 dB) and it increased monotonically with SNR. Although this general trend was present in all listeners, large interindividual differences were observed, both in absolute performance and in differences in performance between quiet and noise conditions. This can be seen in the wide range of PCs at the −7.5 dB SNR, where the best-performing listener achieved 54.16% correct whereas the poorest-performing listeners only achieved 19.16% correct. Figure 1d shows the confusion matrix for the −2.5 dB SNR (speakers are grouped according to their position in the up/down, front/back, and left/right dimensions). The total number of confusions was generally larger at lower SNRs and smaller at higher SNRs; confusion matrices for other SNRs generally showed a similar pattern. An analysis of these confusion matrices revealed that errors were mainly in the front/back and up/down dimensions, and were very rarely in the left/right dimension.
OC reflex
As expected, contralateral noise stimulation caused a significant reduction in OAE amplitude (repeated-measure ANOVA, F(1,17) = 101.56, two-tailed p < 0.0001) and, consistent with previous studies (Backus and Guinan, 2007), the magnitude of this effect differed substantially across the participants, reflecting variability in OC-reflex strength across individuals.
Relationship between sound localization and OC reflex
To determine whether the effect of noise on sound-localization performance covaried with MOC-reflex strength, we plotted the difference in the percentage of correct localization responses between the quiet and noisy conditions (i.e., PC in quiet minus PC in noise, separately for each SNR) as a function of contralateral OAE suppression (averaged across the left and right ears in each listener) across the 18 listeners, and computed nonparametric correlation coefficients (Spearman's ρ) between these two variables. Significant negative correlations—indicative of smaller noise-induced decreases in localization performance with increasing MOC-reflex strength—were observed for the three lowest (i.e., most unfavorable) SNRs: −7.5 dB (ρ = −0.69, one-tailed p = 0.0010) (Fig. 1e, squares), −5 dB (ρ = −0.54, one-tailed p = 0.02), and −2.5 dB SNRs (ρ = −0.44, one-tailed p = 0.04). However, the magnitude of the correlation coefficients decreased as the SNR increased (Fig. 1f), and for the three highest SNRs tested (0, +2.5, and +5 dB), the correlations were not statistically significant (0 dB SNR: ρ = 0.40, p = 0.06; +2.5 dB SNR: ρ = 0.36, p = 0.09; +5 dB SNR: ρ = 0.15, p = 0.29).
To determine whether these correlations were driven by one ear (left or right), we computed correlations between the differences in PC between quiet and noisy conditions and the contralateral OAE suppression effect separately for the right and left ears (Fig. 1e; circles, right ear; triangles, left ear). For the left ear, significant correlations were observed for all tested SNRs except the highest (−7.5 dB: ρ = −0.73, p = 0.0004; −5 dB: ρ = −0.63, p = 0.004; −2.5 dB: ρ = −0.51, p = 0.02; 0 dB: ρ = −0.55, p = 0.01; +2.5 dB: ρ = −0.56, p = 0.01; +5 dB: ρ = −0.31, p = 0.12). For the right ear, significant correlations were obtained for the lowest SNR only (−7.5 dB: ρ = −0.49, p = 0.03). Moreover, overall, the magnitude of the correlation coefficients was significantly larger for the left ear than for the right ear (t test on Fisher's z transformed correlation coefficients, p = 0.0001).
Relationship with detection-in-noise performance
Performance in the detection experiment showed no significant correlation with OAE suppression (−2.5 dB: ρ = 0.23, p = 0.19; −5 dB: ρ = 0.33, p = 0.11; −7.5 dB: ρ = 0.24, p = 0.18). Possible explanations for this negative result are considered in the Discussion, below.
Discussion
The results of this study provide the first demonstration of a relationship between efferent auditory activity and sound localization in humans. They extend the results of an earlier study, in which cats with OC lesions were found to localize sounds in noise less accurately than cats with an intact OC system (May et al., 2004). Although OC lesions presumably lead to the elimination—or to a drastic reduction—of OC influences on the cochlea, the current results demonstrate a relationship between OC-activity and sound-localization performance in noise under physiological conditions. Importantly, the finding of significant correlations between contralateral OAE suppression and sound-localization performance in noise indicates that differences in OC-reflex strength across individuals can explain, in part, the observed variability in sound-localization performance in noise (Best et al., 2005). Specifically, the results indicate that listeners' resilience to the detrimental effects of background noise on sound-localization performance is related to the strength of their OC reflex.
What mechanisms can explain the observed relationship between OC-reflex and sound-localization performance at low SNRs? Physiological studies in animals have revealed that electric or sound-induced stimulation of the MOC system turns down cochlear gain (Murugasu and Russell, 1996)—presumably, by inhibiting OHC electromotility—and suppresses auditory-nerve responses to sounds. Surprisingly, these suppressive effects have beneficial consequences on the neural representation of acoustic signals in noise. By reducing adaptation and/or saturation of neural responses by background noise, the MOC effectively enhances neural responses to signals relative to the noise and expands the dynamic range of ANFs (Winslow and Sachs, 1987; Kawase et al., 1993; Guinan, 2006). The net effect, over a range of fibers with different characteristics frequencies, is a better neural representation of spectral contrasts, especially for low-threshold ANFs, which are easily saturated by background noise (Reiss et al., 2011). Because spectral contrasts provide an important cue to sound-source location in the up/down and front/back dimensions, this could explain why listeners in whom the MOC reflex was stronger tended to make fewer errors in those two dimensions than listeners in whom the MOC reflex was weaker, especially with relatively high levels of background noise. Neural representations of direction-dependent spectral features in noise may be enhanced in individuals with a strong OC reflex. A possible involvement of the MOC in the localization of brief sounds was suggested by Macpherson and Middlebrooks (2000). These authors observed that brief Gaussian noise bursts presented at 55 dB SL were preferentially localized at eye level, regardless of their actual vertical position; however, when background noise was added to the stimuli, listeners' ability to identify correctly the position of the stimuli along the up/down axis was enhanced. Macpherson and Middlebrooks (2000) hypothesized that the background noise (or a longer-duration signal) activates the MOC reflex, leading to a shift of rate-level functions of ANFs toward higher stimulation levels, and to a better discriminability of spectral contrasts.
Earlier studies have found, or suggested, that MOC activity can facilitate the detection of acoustic signals in noise (Kawase et al., 1993; Micheyl and Collet, 1996). Therefore, we reasoned that the correlations between OAE suppression and sound-localization performance in noise that we observed in the current study might be accompanied by correlations between OAE suppression and detection performance. In fact, we found no significant correlation between listeners' performance in the detection task and OC-reflex strength. This negative outcome must be interpreted with caution, however. The lack of correlation between OAE suppression and detection performance does not necessarily imply that MOC activity did not facilitate the detection of the cues that the listeners used to localize the signals in the main experiment; it merely suggests that MOC activity may not have been a determinant factor of the listeners' ability to detect the signal. A plausible explanation for this outcome is that listeners relied on different cues for detecting the signal and for localizing it. For example, listeners could use increase in interaural correlation to detect the presence of the signal, and high-frequency spectral cues for localizing it (see above).
A puzzling outcome of this study relates to the finding of stronger relationships between localization performance and OAE suppression in the left ear than in the right ear. Although previous studies have identified asymmetries in peripheral (Sininger and Cone-Wesson, 2004), central (Zatorre et al., 2002; Brunetti et al., 2005), and efferent (Khalfa et al., 1998; Morlet et al., 1999) auditory function, it is not presently clear whether, and how, these earlier findings are related to the asymmetry observed in the current study. A tentative hypothesis, which is suggested by an earlier report of corticofugal modulation of cochlear mechanisms in humans (Perrot et al., 2006), is that this asymmetry might be a peripheral reflection of right-hemisphere dominance for spatial auditory processing in humans (Fujiki et al., 2002; Zatorre et al., 2002; Brunetti et al., 2005). Further study is needed on this point.
Overall, the current findings lend further support to the view that an important function of the OC-reflex is to help protect sound-localization ability against the detrimental effects of background noise, especially at low (i.e., unfavorable) SNRs (May et al., 2004; Smith et al., 2004; Reiss et al., 2011), and they suggest that interindividual variability in OC-reflex strength is one of the factors that can account for interindividual differences in sound-localization performance in noise in normal-hearing human listeners (Best et al., 2005).
Footnotes
This work was supported in part by the French Procurement Agency, the French National Center for Scientific Research, and the National Institutes of Health (Grant R01 DC010374). We thank Jean Christophe Bouy for help with software development and Ewan Macpherson, Josh McDermott, Xavier Perrot, Andrew Sabin, and two anonymous reviewers for many helpful comments.
The authors declare no competing financial interests.
References
- Backus BC, Guinan JJ., Jr Measurement of the distribution of medial olivocochlear acoustic reflex strengths across normal-hearing individuals via otoacoustic emissions. J Assoc Res Otolaryngol. 2007;8:484–496. doi: 10.1007/s10162-007-0100-0. [DOI] [PMC free article] [PubMed] [Google Scholar]
- Best V, van Schaik A, Jin C, Carlile S. Auditory spatial perception with sources overlapping in frequency and time. Acta Acust United Acust. 2005;91:421–428. [Google Scholar]
- Brunetti M, Belardinelli P, Caulo M, Del Gratta C, Della Penna S, Ferretti A, Lucci G, Moretti A, Pizzella V, Tartaro A, Torquati K, Olivetti Belardinelli M, Romani GL. Human brain activation during passive listening to sounds from different locations: an fMRI and MEG study. Hum Brain Mapp. 2005;26:251–261. doi: 10.1002/hbm.20164. [DOI] [PMC free article] [PubMed] [Google Scholar]
- Chery-Croze S, Moulin A, Collet L, Morgon A. Is the test of medial efferent system function a relevant investigation in tinnitus ? Br J Audiol. 1994;28:13–25. doi: 10.3109/03005369409077909. [DOI] [PubMed] [Google Scholar]
- de Boer J, Thornton AR. Neural correlates of perceptual learning in the auditory brainstem: efferent activity predicts and reflects improvement at a speech-in-noise discrimination task. J Neurosci. 2008;28:4929–4937. doi: 10.1523/JNEUROSCI.0902-08.2008. [DOI] [PMC free article] [PubMed] [Google Scholar]
- Dewson JH., 3rd Efferent olivocochlear bundle: some relationships to stimulus discrimination in noise. J Neurophysiol. 1968;31:122–130. doi: 10.1152/jn.1968.31.1.122. [DOI] [PubMed] [Google Scholar]
- Fujiki N, Riederer KA, Jousmäki V, Mäkelä JP, Hari R. Human cortical representation of virtual auditory space: differences between sound azimuth and elevation. Eur J Neurosci. 2002;16:2207–2213. doi: 10.1046/j.1460-9568.2002.02276.x. [DOI] [PubMed] [Google Scholar]
- Gifford ML, Guinan JJ., Jr Effects of crossed olivocochlear bundle stimulation on cat auditory nerve fiber responses to tones. J Acoust Soc Am. 1983;74:115–123. doi: 10.1121/1.389728. [DOI] [PubMed] [Google Scholar]
- Good MD, Gilkey RH. Sound localization in noise: the effect of signal-to-noise ratio. J Acoust Soc Am. 1996;99:1108–1117. doi: 10.1121/1.415233. [DOI] [PubMed] [Google Scholar]
- Green DM, Dai HP. Probability of being correct with 1 of M orthogonal signals. Percept Psychophys. 1991;49:100–101. doi: 10.3758/bf03211621. [DOI] [PubMed] [Google Scholar]
- Green DM, Swets JA. Signal detection theory and psychophysics. New York: Wiley; 1966. [Google Scholar]
- Guinan JJ., Jr Olivocochlear efferents: anatomy, physiology, function, and the measurement of efferent effects in humans. Ear Hear. 2006;27:589–607. doi: 10.1097/01.aud.0000240507.83072.e7. [DOI] [PubMed] [Google Scholar]
- Kawase T, Delgutte B, Liberman MC. Antimasking effects of the olivocochlear reflex. II. Enhancement of auditory-nerve response to masked tones. J Neurophysiol. 1993;70:2533–2549. doi: 10.1152/jn.1993.70.6.2533. [DOI] [PubMed] [Google Scholar]
- Khalfa S, Veuillet E, Collet L. Influence of handedness on peripheral auditory asymmetry. Eur J Neurosci. 1998;10:2731–2737. doi: 10.1046/j.1460-9568.1998.00286.x. [DOI] [PubMed] [Google Scholar]
- Lorenzi C, Gatehouse S, Lever C. Sound localization in noise in normal-hearing listeners. J Acoust Soc Am. 1999;105:1810–1820. doi: 10.1121/1.426719. [DOI] [PubMed] [Google Scholar]
- Macpherson EA, Middlebrooks JC. Localization of brief sounds: effects of level and background noise. J Acoust Soc Am. 2000;108:1834–1849. doi: 10.1121/1.1310196. [DOI] [PubMed] [Google Scholar]
- May BJ, Budelis J, Niparko JK. Behavioral studies of the olivocochlear efferent system: learning to listen in noise. Arch Otolaryngol Head Neck Surg. 2004;130:660–664. doi: 10.1001/archotol.130.5.660. [DOI] [PubMed] [Google Scholar]
- Micheyl C, Collet L. Involvement of the olivocochlear bundle in the detection of tones in noise. J Acoust Soc Am. 1996;99:1604–1610. doi: 10.1121/1.414734. [DOI] [PubMed] [Google Scholar]
- Middlebrooks JC, Green DM. Sound localization by human listeners. Annu Rev Psychol. 1991;42:135–159. doi: 10.1146/annurev.ps.42.020191.001031. [DOI] [PubMed] [Google Scholar]
- Morlet T, Goforth L, Hood LJ, Ferber C, Duclaux R, Berlin CI. Development of human cochlear active mechanism asymmetry: involvement of the medial olivocochlear system? Hear Res. 1999;134:153–162. doi: 10.1016/s0378-5955(99)00078-7. [DOI] [PubMed] [Google Scholar]
- Murugasu E, Russell IJ. The effect of efferent stimulation on basilar membrane displacement in the basal turn of the guinea pig cochlea. J Neurosci. 1996;16:325–332. doi: 10.1523/JNEUROSCI.16-01-00325.1996. [DOI] [PMC free article] [PubMed] [Google Scholar]
- Oldfield RC. The assessment and analysis of handedness: the Edinburgh inventory. Neuropsychologia. 1971;9:97–113. doi: 10.1016/0028-3932(71)90067-4. [DOI] [PubMed] [Google Scholar]
- Perrot X, Ryvlin P, Isnard J, Guénot M, Catenoix H, Fischer C, Mauguière F, Collet L. Evidence for corticofugal modulation of peripheral auditory activity in humans. Cereb Cortex. 2006;16:941–948. doi: 10.1093/cercor/bhj035. [DOI] [PubMed] [Google Scholar]
- Reiss LA, Ramachandran R, May BJ. Effects of signal level and background noise on spectral representations in the auditory nerve of the domestic cat. J Assoc Res Otolaryngol. 2011;12:71–88. doi: 10.1007/s10162-010-0232-5. [DOI] [PMC free article] [PubMed] [Google Scholar]
- Ruben RJ, Sekula J. Inhibition of central auditory response. Science. 1960;131:163. doi: 10.1126/science.131.3394.163. [DOI] [PubMed] [Google Scholar]
- Sininger YS, Cone-Wesson B. Asymmetric cochlear processing mimics hemispheric specialization. Science. 2004;305:1581. doi: 10.1126/science.1100646. [DOI] [PubMed] [Google Scholar]
- Smith DW, Kirk EC, Buss E. The function(s) of the medial olivocochlear efferent system in hearing. In: Pressnitzer D, de Cheveigné A, McAdams S, Collet L, editors. Auditory signal processing: physiology, psychoacoustics, and models. Dourdan, France: Springer; 2004. pp. 75–83. [Google Scholar]
- Wichmann FA, Hill NJ. The psychometric function. I. Fitting, sampling, and goodness of fit. Percept Psychophys. 2001;63:1293–1313. doi: 10.3758/bf03194544. [DOI] [PubMed] [Google Scholar]
- Winslow RL, Sachs MB. Effect of electrical stimulation of the crossed olivocochlear bundle on auditory nerve response to tones in noise. J Neurophysiol. 1987;57:1002–1021. doi: 10.1152/jn.1987.57.4.1002. [DOI] [PubMed] [Google Scholar]
- Zatorre RJ, Bouffard M, Ahad P, Belin P. Where is ‘where’ in the human auditory cortex? Nat Neurosci. 2002;5:905–909. doi: 10.1038/nn904. [DOI] [PubMed] [Google Scholar]