Abstract
One subunit of the prokaryotic voltage-gated potassium ion channel from Aeropyrum pernix (KvAP) is comprised of six transmembrane α helices, of which S1–S4 form the voltage-sensor domain (VSD) and S5 and S6 contribute to the pore domain (PD) of the functional homotetramer. However, the mechanism of electromechanical coupling interconverting the closed-to-open (i.e., nonconducting-to-K+-conducting) states remains undetermined. Here, we have vectorially oriented the detergent (OG)-solubilized VSD in single monolayers by two independent approaches, namely “directed-assembly” and “self-assembly,” to achieve a high in-plane density. Both utilize Ni coordination chemistry to tether the protein to an alkylated inorganic surface via its C-terminal His6 tag. Subsequently, the detergent is replaced by phospholipid (POPC) via exchange, intended to reconstitute a phospholipid bilayer environment for the protein. X-ray interferometry, in which interference with a multilayer reference structure is used to both enhance and phase the specular x-ray reflectivity from the tethered single membrane, was used to determine directly the electron density profile structures of the VSD protein solvated by detergent versus phospholipid, and with either a moist He (moderate hydration) or bulk aqueous buffer (high hydration) environment to preserve a native structure conformation. Difference electron density profiles, with respect to the multilayer substrate itself, for the VSD-OG monolayer and VSD-POPC membranes at both the solid-vapor and solid-liquid interfaces, reveal the profile structures of the VSD protein dominating these profiles and further indicate a successful reconstitution of a lipid bilayer environment. The self-assembly approach was similarly extended to the intact full-length KvAP channel for comparison. The spatial extent and asymmetry in the profile structures of both proteins confirm their unidirectional vectorial orientation within the reconstituted membrane and indicate retention of the protein’s folded three-dimensional tertiary structure upon completion of membrane bilayer reconstitution. Moreover, the resulting high in-plane density of vectorially oriented protein within a fully hydrated single phospholipid bilayer membrane at the solid-liquid interface will enable investigation of their conformational states as a function of the transmembrane electric potential.
I. INTRODUCTION
Voltage-gated potassium (Kv) and sodium (Nav) channels are responsible for the generation and propagation of neuronal action potentials [1–3]. Kv channels are prototypical, in that high-resolution x-ray crystal structures of the presumed open state of a few Kv channels have recently been determined [4–6]. The transmembrane domain of the channel is comprised of four identical subunits, each possessing six transmembrane α helices S1–S6. Helices S5 and S6 from each subunit combine to form the pore domain (PD) in the homotetramer that is conserved from archaebacteria to mammals. The PD opens in response to depolarizing transmembrane electrochemical potentials to permit passive ion transport giving rise to “ionic” currents. Helices S1–S4 in each subunit comprise a voltage-sensor domain (VSD), including four charged Arg (R) residues in S4 shown to be primarily responsible for voltage sensing. The N terminus and C terminus of each subunit are on the intracellular side of the cell membrane, as is the loop connecting the VSD and PD.
Transmembrane voltage sensing requires an electromechanical coupling between the VSDs and PD, the mechanism of which remains unresolved, despite intense investigation [7–10], for several reasons. First, the resting, closed state of the Kv channel occurs naturally only at a transmembrane potential of ~–100 mV. Second, the protein undergoes sequential conformational changes as it opens from the closed state, thereby requiring multiple structures to fully describe the functional system [5,11,12]. Initially, the VSD of each subunit must be activated involving two intermediates and charged residue movements along the membrane profile result in “gating” currents, but without ion conduction. When all four VSDs are activated, the channel is poised to open, but is not yet conducting ions. This fully activated state then undergoes a rapid cooperative transformation to the open, ion conducting state of the PD. Third, depolarizing transmembrane potentials are required to trigger these structural changes, and this is not feasible with the available crystal structures. Fourth, there is growing evidence that interactions between the protein, particularly the VSD, and the phospholipid in the membrane affect the protein function [13,14]. Therefore, a full understanding of the mechanism likely requires the investigation of the structure of these channels in a host phospholipid membrane under applied transmembrane potentials, making the development of both alternative membrane reconstitution approaches and appropriate structural techniques indispensable. This prompted us to focus initially on the structure of the isolated VSD, as well as the full-length KvAP channel, incorporated with a unidirectional vectorial orientation within a single phospholipid bilayer membrane environment. Prokaryotic KvAP (Kv channel from thermophilic archaebacteria Aeropyrum pernix) is structurally simpler possessing the transmembrane domain central to electromechanical coupling which is highly similar to its eukaryotic counterparts, but lacking their large cytoplasmic domain.
For VSD protein, two independent approaches were employed to form vectorially oriented monolayers of the expressed protein tethered to the surface of inorganic substrates. The first is designated as “directed assembly” (DA) and the second is designated as “self-assembly” (SA). Only the SA approach was employed for the expressed KvAP protein. The vectorially oriented proteins’ monolayers were subsequently exchanged against a phospholipid (POPC)-detergent(OG) mixture, intended to reconstitute a POPC bilayer environment for the tethered protein. Details are provided in Sec. II.
X-ray and neutron reflectivity, enhanced by interferometry [15–17], can be utilized to characterize the profile structures of the chemisorbed bio-organic overlayers formed on the surface of inorganic multilayer substrates at each stage of their fabrication by either the DA or SA approach [18,19]. The “profile structure” is a projection of the overlayer’s three-dimensional (3D) structure parallel to the plane of the membrane onto the normal to that plane, thereby averaging over the in-plane structure of the overlayer. In this work, x-ray interferometry was utilized to determine the electron density profile structures of the reconstituted VSD-POPC and KvAP-POPC membranes at each stage of their fabrication, hydrated by either moist He at high relative humidity or by bulk aqueous buffer. While the former hydration state at the solid-vapor interface employed lower energy x rays (8.048 or 13.474 keV), the latter hydration state at the solid-liquid interface necessarily employed higher energy x-rays (22.117 keV) to penetrate the bulk water, as available from undulator-based synchrotron sources. Comparison of the resulting asymmetric profile structures with those calculated from their respective x-ray crystal structures verified the intended vectorial orientation of each protein and indicated retention of the protein’s folded 3D tertiary structure upon completion of bilayer membrane reconstitution. Difference profile structures for VSD-POPC versus VSD-OG indicate a successful reconstitution of a POPC bilayer environment for the VSD protein.
These pioneering structural investigations of the voltage-sensor domain or the KvAP channel protein, vectorially oriented first within a single monolayer and subsequently within a reconstituted lipid bilayer membrane at the solid-liquid interface and at high in-plane density, are crucial to setting the stage for the application of transmembrane electric potentials. For instance, such x-ray interferometry techniques employing higher energy x-rays can achieve millisecond time resolution in response to a step between two potentials, and by utilizing site-directed labeling with a resonant metal atom can significantly increase the level of structural detail attained.
II. EXPERIMENT
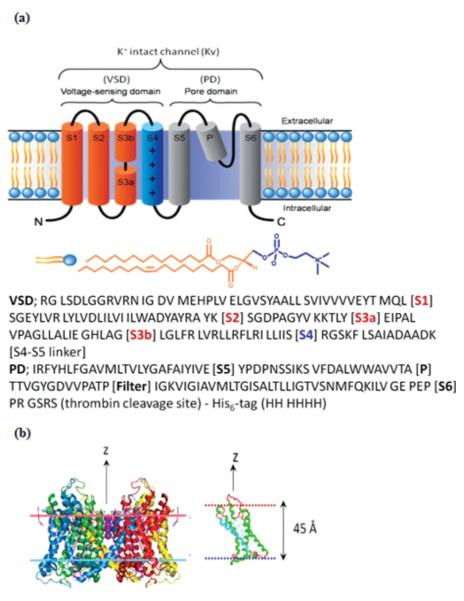
The isolated voltage-sensor domain (VSD) protein from Aeropyrum pernix (KvAP) in the absence of the PD, but retaining a portion of the S4-S5 linker helix, solubilized at 29 μM in buffer containing 3% β-D-glucopyranoside (OG), 20-mM tris(hydroxymethyl)aminomethane (Tris) at pH 7.8, and 100-mM potassium chloride (KCl), prepared via expression and purified via affinity chromotagraphy, was provided by Kenton Swartz’s laboratory at NINDS-NIH [20]. It was expressed in Escherichia coli XL1-blue cells (Stratagene, Cat 200228) and purified by affinity chromatography with the aid of a hexa-His tag (His6 tag) added to the C terminus of the S4-S5 linker. Matrix-assisted laser desorption/ionization-Time-of-flight (MALDI-TOF) mass spectrometry (Voyager-STR, PerSeptive Biosystems) provided an isotopically averaged molecular weight of 17.276 kDa. A single mutation in the S3-S4 linker (A111→C111) was labeled with a polarity-sensitive, thiol-reactive fluorescent probe badan (6-bromoacetyl-2-dimethylamino-naphtalene). The full-length KvAP channel (average molecular weight of 100 kDa) solubilized in buffer at 6.4 μM containing 3.2% n-decyl-β-D-maltopyranoside (DM), 50-mM tris(hydroxymethyl)aminomethane (Tris) at pH 7.8, and 100-mM potassium chloride (KCl), was provided by Manuel Covarrubias’s laboratory (Thomas Jefferson University, Jefferson Medical College, Philadelphia), following a protocol similar to that for VSD [20]. The one-letter amino acid sequence for the VSD and PD domains of the KvAP protein, along with a schematic depicting their secondary structural elements (i.e., α helices and flexible loops) within a lipid bilayer environment are shown in Fig. 1.
FIG. 1.
(Color online) (a) A linear representation of transmembrane-spanning segments, the VSD comprised of helices (S1–S4) and the PD formed by helices (S5 and S6) in the homotetramer. The transmembrane α helices (S1–S6) are shown as cylinders connected by black loops, embedded in phospholipid bilayer separating the intracellular and extracellular regions. The S4 helix has four positively charged arginine residues and the P helix forms the selectivity filter in the homotetramer. A single phospholipid molecule (POPC) is shown with hydrophobic tails [orange (light gray)] and hydrophilic head group [blue (dark gray)]. Amino acid sequences (single-letter symbol) for the VSD and the PD of the entire KvAP channel from Aeropyrum pernix, as expressed including the hexa-His tag and thrombin cleavage site, are also shown. (b) Representations of the full-length Kv1.2 (PDB accession code 2A79) crystal structure and the VSD itself, bounded by lipid bilayerlike environment (shown as horizontal dotted lines).
Circular dichroism (CD) of detergent-solubilized VSD and KvAP in buffer solution was carried out with an Aviv CD spectrophotometer (Model 410, Lakewood, NJ) at 22 °C. The solutions were placed in a 1-mm quartz cuvette and the spectra were recorded over the UV range of 190–280 nm with a time constant of 20 s, a spectral resolution of 1 nm, and scan rate of 10 nm/min. The spectra from both VSD and KvAP solutions reveal typical features (two minima) between 208 and 222 nm consistent with a predominantly α-helical secondary structure. The amplitudes of these features, on a molar ellipticity basis, indicate a 70%–80% α-helical content (not shown). The nonionic detergents n-octyl-β-D-glucopyranoside (OG) and n-decyl-β-D-maltopyranoside (DM) were purchased from Anatrace (Maumee, OH), suitable for preserving the native conformation of membrane proteins.
A. Substrate surface functionalization
For the x-ray interferometry, Si-Ni-Si multilayer inorganic substrates were used as the reference structure. They were deposited by dc magnetron sputtering onto 3-in. commercial Si(001) (p+-Si:B, 525 μm thick) wafers from El-Cat, Inc. (Waldwick, NJ) in this fashion comprised of 20-Å Si–20-Å Ni–50-Å Si. This fabrication was performed in the Optics Fabrication and Metrology (OFM) laboratory located in the X-Ray Science Division at the Advanced Photon Source (APS) of Argonne National Laboratory (ANL) (Argonne, IL). They were immersed and ultrasonicated in methanol, chloroform, and acetone consecutively, for 10 min each to remove organic residues. They were subsequently alkylated with 3-mercaptopropyl trimethoxysilane (MPS) by boiling in 0.5% (v/v) MPS in 2-propanol for 10 min with reflux to control the macroscopic polarity of the substrate’s surface possessing the underlying multilayer reference structure. After rinsing with 2-propanol, the alkylated substrates were blow dried under Ar and cured in an oven at 100 °C–110 °C for 10 min promoting cross linking as well as removal of organic residues. A monolayer of nitrilotriacetate (NTA) was subsequently chemisorbed onto the -SH end groups of the alkylated surface by self-assembly from a maleimido-C3-NTA solution (2 mg/mL in Tris buffer, 30 min). Lastly, the NTA-terminated alkylated surface of the substrate was incubated with NiSO4 solution (50 mM in deionized water) for 30 min to coordinate a Ni2+ ion with the three carboxylate and one tertiary amine ligand provided by NTA. (3-mercaptopropyl)trimethoxysilane (MPS) was obtained from Aldrich (St. Louis, MO), N-[5-(3-maleimidopr-opionylamino)-1-carboxy-pentyl]iminodiacetic acid and disodium salt monohydrate (maleimido-C3-NTA) were purchased from Dojindo Molecular Technologies (Rockville, MD).
B. Protein immobilization and membrane reconstitution
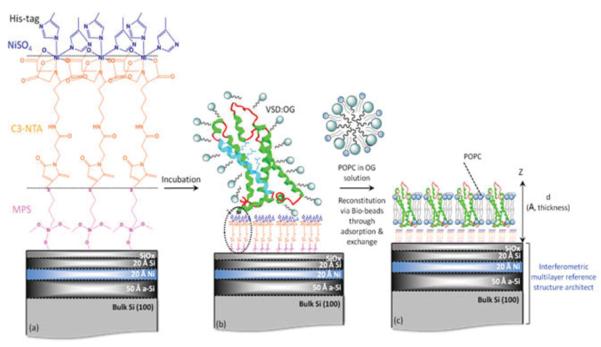
For VSD, two independent approaches were employed to form vectorially oriented monolayers of the expressed protein tethered to the surface of inorganic substrates. The first is self-assembly and the second is designated as directed assembly. For the SA approach (shown schematically in Fig. 2), the detergent (OG)-solubilized VSD (VSD-OG) or KvAP-DM is chemisorbed directly from isotropic solution via nickel coordination chemistry, utilizing the NTA (nitrilotriacetate) end groups of the alkylating chains and the hexa-histidyl tag of the protein as metal ligands, and subsequently washed after incubation for almost 8–10 h, with 1-mM TRIS buffer and MilliQ water to remove nonspecifically bound protein and subsequently stored in a moist environment of saturated salt solution with >90% relative humidity. The directed-assembly approach (shown schematically in Fig. 3) was carried out using the Langmuir trough (Riegler & Kirstein, GmbH, Germany) that utilizes the hydrophilic seven-residue consensus thrombin protease cleavage sequence followed by a hexa-histidyl tag appended onto the C terminus, as routinely employed in the purification of expressed proteins via affinity chromatography, to render the otherwise hydrophobic VSD protein amphiphilic. This allows the detergent-solubilized VSD protein itself, and in specified mixtures with phospho-lipids, to be spread as a Langmuir monolayer at the water-air interface. Suitable compression of the monolayer, established by x-ray reflectivity, forces the detergent into the aqueous subphase below the monolayer via infinite dilution, leaving the folded protein vectorially oriented (by its amphiphilicity) in a phospholipid monolayer environment at the interface. The Ni2+-NTA-terminated alkylated surface of the Si-Ni-Si substrate (previously characterized by x-ray reflectivity in helium) was positioned deep in the aqueous subphase inside the trough. A Langmuir monolayer of a 12:1 mole ratio mixture of POPC-VSD was spread on the subphase surface and compressed to a surface pressure of 40 mN/m. The upper surface of the Ni2+-NTA-terminated alkylated surface of the Si-Ni-Si substrate was slowly brought into contact with the lower surface of the compressed POPC-VSD monolayer, using a combination of mechanical and subsequent piezoelectric translation, tethering the VSD to the inorganic surface. The aqueous subphase utilized here was 1-mM potassium phosphate without KCl, to avoid salt condensation on the surface of the substrate following tethering of the POPC-VSD monolayer. For both approaches, either the VSD-OG monolayer via SA or the so-tethered VSD-POPC monolayer via DA, can be exchanged against a POPC-OG mixture in the presence of Bio-Beads, possessing a high detergent affinity, and subsequently washed, intended to reconstitute a putative POPC bilayer environment for the vectorially oriented VSD. Only the SA approach was employed, as previously described, for the expressed KvAP protein possessing the same hydrophilic sequence appended to the C terminus of each subunit. The surface tethered VSD-OG or KvAP-DM monolayer was incubated in 3 mL of 2 mg/mL POPC solution (pH 7.8, Tris buffer) with 0.9% OG or DM for ~1 h, followed by adding ~400 mg of Bio-Beads to the solution as an OG-DM adsorbent, thus facilitating POPC exchange. At least 3-4 h was required to complete the exchange, intended to reconstitute a POPC bilayer environment for the respective protein. Neutral lipid 1-palmitoyl-2-oleoyl-sn-glycero-3-phosphocholine (16:0-18:1 PC; POPC) was purchased from Avanti Polar Lipids (Alabaster, AL) in chloroform solution. Bio-Beads SM-2 Adsorbents were purchased from Bio-Rad (Hercules, CA). All other reagents and solvents were obtained either from Fisher Scientific (Springfield, NJ) or Sigma-Aldrich (St. Louis, MO). All of the compounds were used without further purification. The de-ionized water was supplied as MilliQ (18.4 M Ωcm, Millipore Corp., Bedford, MA).
FIG. 2.
(Color online) Schematic outlining the SA approach. (a) A Si-Ni-Si multilayer reference structure, alkylated with mercapto-propyl-silane (MPS) to functionalize its surface with thiol groups, is subsequently reacted with the linker maleimido-C3-NTA to provide nitrilotriacetate end groups for ligation with Ni+2 ions, along with (b) histidines from the protein’s C-terminal His6 tag following incubation with VSD-OG. (c) Reconstitution of vectorially oriented VSD in a single phospholipid bilayer environment via exchange against POPC-OG in the presence of Bio-Beads. For aqueous environments, water is expected on both the proximal and distal (with respect to the substrate) sides of the bilayer. The VSD is shown as ribbon representation of its crystal structure [6].
FIG. 3.
(Color online) Schematic outlining the DA approach. The lower surface of a suitably compressed Langmuir monolayer of a VSD-POPC mixture, containing VSD vectorially oriented by its appended hydrophilic C-terminal sequence ending with a His6 tag, is brought into contact with the upper surface of a Si-Ni-Si multilayer substrate, alkylated to possess NTA end groups ligating Ni+2 ions, shown in the left-to-middle frames. The resulting tethered VSD-POPC monolayer is subsequently exchanged against POPC-OG in the presence of Bio-Beads and washed to reconstitute a POPC bilayer environment for the VSD, as with the SA method.
C. X-ray reflectivity and interferometry
X-ray reflectivity data from Langmuir monolayers of VSD-POPC mixtures related to the DA approach, and x-ray interferometry data for VSD-OG monolayer and reconstituted VSD-POPC membranes via the SA approach and hydrated with bulk aqueous buffer, were collected with the liquid surface spectrometer at sector 9ID-C of the Advanced Photon Source at Argonne National Laboratory in the vertical scattering plane. The reflectivity data were collected at 13.474 keV (0.949 Å) while the interferometry data were collected at 22.117 keV (0.5605 Å) (see Fig. 4 and Appendix for details). X-ray interferometry data from VSD-OG monolayers, reconstituted VSD-POPC membranes, KvAP-DM monolayers, and reconstituted KvAP-POPC membranes via the SA approach and hydrated with moist He at 95% relative humidity were collected at 8.048 keV (1.543 Å), using a rotating-anode x-ray source, singly bent LiF monochromator optics, Huber 4-circle diffractometer, Si(111) analyzer and scintillation detector. X-ray interferometry data for VSD-POPC monolayers and reconstituted VSD-POPC membranes via the DA approach were collected with both the synchrotron and rotating-anode x-ray sources.
FIG. 4.
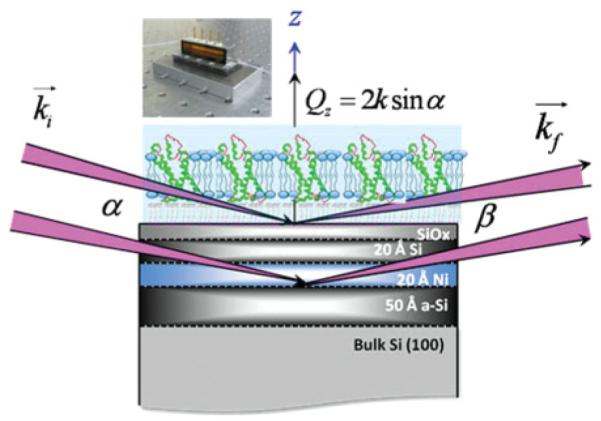
(Color online) The schematic representation of the interferometric approach to x-ray reflectivity as a function of momentum transfer vector Qz from vectorially oriented VSD (and KvAP) in reconstituted membranes at the solid-vapor (moist He) and solid-liquid (aqueous Tris buffer) interfaces to determine their electron density profile structure. Also shown is a photo of the electrochemical cell for either environment. The incident (ki) and reflected (kf ) wave-vector directions and the corresponding angles α and β are also shown (not to scale). The light blue environment for the reconstituted VSD-POPC membrane is either moist helium or aqueous buffer.
D. X-ray reflectivity and interferometry data analysis
The x-ray reflectivity data were analyzed by methods thoroughly described previously [21], as were the x-ray interferometry data [15].
III. RESULTS AND DISCUSSION
A. Protein immobilization and membrane reconstitution
The SA approach was originally developed to vectorially orient detergent-solubilized integral membrane proteins at the solid-gas or solid-liquid interface [18,19], and has been extended more recently as described in Sec. II, gainfully employing the hexa-histidyl tag appended to the C terminus (or N terminus) of membrane proteins prepared by expression [22]. It is particularly significant for the vectorial orientation of detergent-solubilized integral membrane proteins in lipid bilayer membranes, because the utilization of lipid bilayer tethered to an inorganic surface as a precursor to membrane protein incorporation is not possible, unlike the case for water-soluble membrane proteins, either amphipathic or amphihilic [23]. The DA approach benefited from our recent work to implement the interferometric approach to x-ray reflectivity from Langmuir monolayers of amphiphiles, employing the multilayer reference structure just beneath the unperturbed Langmuir monolayer in the aqueous subphase [15]. Bringing the Ni-NTA end groups on the upper surface of the alkylated multilayer substrate just into contact with the lower surface of the VSD-POPC Langmuir monolayer allows the chemisorption of the monolayer onto the substrate’s surface, which is thereby stable to extensive washing, unlike the so-called Langmuir-Schaeffer technique, which typically utilizes only physisorption to deposit the amphiphiles on the substrate’s surface [15].
B. X-ray reflectivity from Langmuir monolayers of VSD-POPC
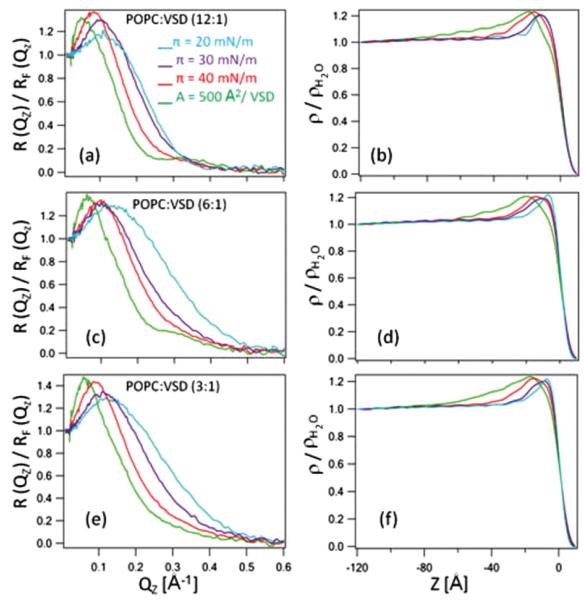
Pressure-area isotherms were used to first characterize Langmuir monolayers of VSD-POPC mixtures, for a number of mole ratios, at the water-gas interface as a function of the applied surface pressure [24]. They provided direct evidence that both the VSD protein and the POPC were retained at the interface upon compression to relatively high surface pressures. X-ray reflectivity was subsequently employed to investigate the structure of the VSD protein in these monolayers as a function of surface pressure. For minimal POPC-VSD mole ratios of 3:1–12:1, the secondary structure of the VSD was found to be retained at surface pressures up to 20 mN/m; the tertiary structure of the VSD was unfolded with all five helices lying in the plane of the interface. Increasing surface pressure above 30 mN/mto40mN/m, appeared to refold the protein resulting in a profile structure of the expected thickness for the four-helix (S1–S4) bundle structure of VSD oriented perpendicular to the interface, namely ~43 Å. Further compression resulted in a substantially increased thickness, presumably from the extension of the VSD protein from the POPC monolayer into the aqueous subphase. Details are presented in the Appendix and summarized in Figs. 11 and Figs. 12.
FIG. 11.
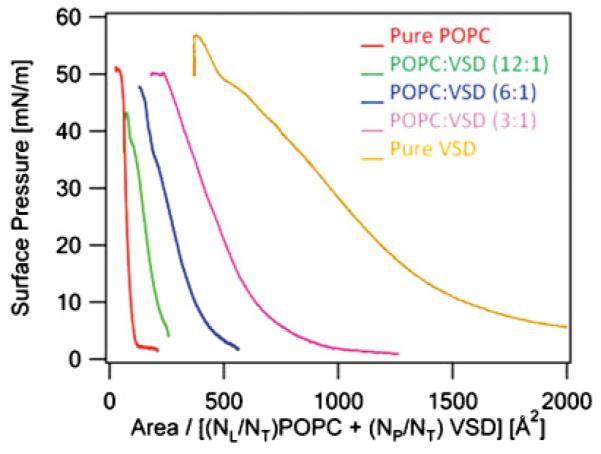
(Color online) The surface pressure-area (π-A) isotherms of pure POPC, mixed POPC-VSD at three mole ratios, and pure VSD monolayers. The abscissa is expressed here in terms of the average area per molecule as defined using Eq. (1). The rightmost curve is for pure VSD, the leftmost is for pure POPC, and in between from right to left is with increasing POPC mole ratio, i.e., from 3 to 12.
FIG. 12.
(Color online) (a), (c), (e) Fresnel-normalized x-ray reflectivity; (b), (d), (f) corresponding reduced electron density profiles, ρ(z)/ρH2O, calculated from the data shown in the left panel for the mixed monolayers of POPC-VSD at mole ratios of 12:1, 6:1, and 3:1 acquired as a function of surface pressure (π) (increasing from right to left, i.e., from 20 to 40 mN/m) and at the highest pressure achieved corresponding to an area A = 500 Å2/VSD molecule (the leftmost curve). The water-helium interface is at z = 0 Å (which is arbitrary) in the electron density profiles, with the aqueous subphase at negative z values and the helium gas at positive z values. Electron density at the interface is excess of water (i.e., reduced electron densities >1.0) from the VSD-POPC mixture retained at the interface. Note that for such small mole ratios of POPC-VSD, the protein is expected to dominate these profiles (see text).
C. X-ray interferometry with Si-Ni-Si multilayer substrates
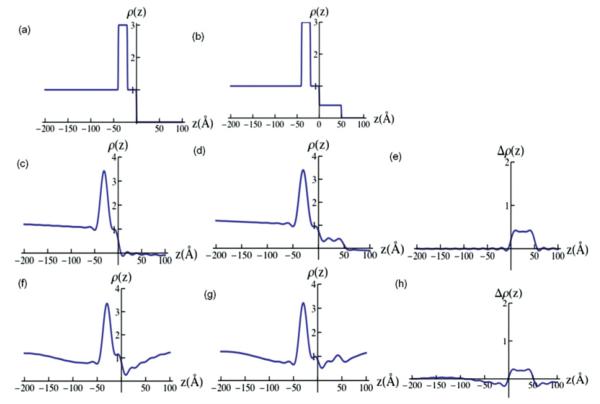
The Si-Ni-Si substrates, as opposed to Si-Ge-Si utilized in previous studies, were selected for these studies for two reasons. First, the scattering-length density contrasts for Ni versus Si are similar for both x rays and neutrons. Second, the Ni layer could potentially serve as an effective working electrode in an electrochemical cell, allowing for the application of electric potentials across the VSD-POPC or KvAP-POPC membrane reconstituted on their surface. However, since the alkylation procedure to tether the protein to the substrate requires a silicon oxide layer, the Ni layer is covered with a thin 20-Å layer of Si which is oxidized forming a SiOx layer on the top. This has a significant consequence for the electron density profiles of the bio-organic overlayers chemisorbed onto the substrate’s surface, calculated as a Fourier representation using our methods of data analysis, where the average electron density of the overlayer is quite small compared to that of the nearby Ni layer. In particular, Fourier transform truncation effects arising from the absence of useful data for photon momentum transfer Qz less than the critical angle, designated as (Qz)min truncation, as opposed to the typical (Qz)max truncation effects determining the spatial resolution achieved, are more pronounced in the neighborhood extending from the substrate’s surface [e.g., see Fig. 6(c) for 25 Å < z < 150 Å]. As a result, the results described later employ difference electron density profiles, calculated as the difference between the multilayer substrate with the chemisorbed bioorganic overlayer minus that of the substrate itself, both in the same environment, namely either moist helium or bulk aqueous buffer. With all other aspects of the reflectivity experiment being identical for both, this procedure effectively removes the effects of (Qz)min truncation revealing an accurate electron density profile of the bio-organic overlayer exhibiting only the effects of (Qz)max truncation, i.e., low-amplitude, minimum wavelength fluctuations. Model calculations justifying this approach are presented in the Appendix, Fig. 13.
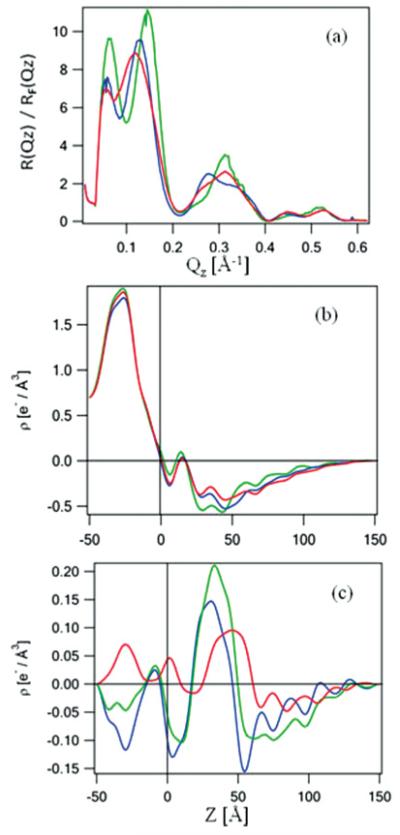
FIG. 6.
(Color online) The interferometric x-ray reflectivity results from a specimen prepared via the self-assembly approach. The Fresnel-normalized reflectivity data are shown in (a) and the corresponding absolute electron density profiles in (b), where green (light gray) corresponds to the Si-Ni-Si multilayer substrate itself, blue (dark gray) to the tethered VSD-OG monolayer, and red (gray) to the putative reconstituted VSD-POPC bilayer membrane. The difference electron density profiles, referenced to the profile of the Si-Ni-Si substrate itself, are shown in panel (c), where the blue (dark gray) profile is that of the VSD-OG monolayer, the green (light gray) profile that of the reconstituted VSD-POPC membrane, and the red (gray) profile is the difference between them, namely the VSD-POPC membrane profile minus that for the VSD-OG monolayer.
FIG. 13.
(Color online) (a) Model electron density profile for Si-Ni-Si substrate, expressed here as ρ(z)/ρSi. (b) Model electron density profile for Si-Ni-Si substrate plus an organic overlayer, also expressed here as ρ(z)/ρSi. (c) Fourier representation of the electron density profile ρ(z)/ρSi for Si-Ni-Si substrate with only (Qz)max truncation. (d) Fourier representation of the electron density profile ρ(z)/ ρSi for Si-Ni-Si substrate plus organic overlayer with only (Qz)max truncation. (e) Difference electron density profile Δρ(z)/ρSi [i.e., ρ(z)/ρSi for the Si-Ni-Si substrate plus organic overlayer minus ρ(z)/ρSi for the Si-Ni-Si substrate itself] revealing overlayer profile with only (Qz)max truncation. (f) Fourier representation of the electron density profile for Si-Ni-Si substrate ρ(z)/ρSi with both (Qz)max and (Qz)min truncation. (g) Fourier representation of the electron density profile for Si-Ni-Si substrate plus overlayer ρ(z)/ρSi with both (Qz)max and (Qz)min truncation. (h) Difference electron density profile Δρ(z)/ρSi [i.e., ρ(z)/ρSi for the Si-Ni-Si substrate plus organic overlayer minus ρ(z)/ρSi for the Si-Ni-Si substrate itself] revealing overlayer profile with both (Qz)max and (Qz)min truncation. Comparison of the two difference profiles, middle right and lower right, demonstrates that the effects of (Qz)min truncation are largely removed, preserving the average electron density, width, and symmetry features of the organic overlayer.
D. X-ray interferometry of VSD-POPC monolayers and VSD-POPC membranes via DA at the solid-vapor interface
We chose the Langmuir monolayer of POPC-VSD = 12:1 at 40 mN/m to perform DA. This mole ratio was estimated to be the minimum necessary to solvate the lateral surfaces of the folded VSD (S1–S4) in the monolayer, noting that the S4-S5 linker helix is amphipathic and thereby expected to remain localized in the plane of the interface. For such a minimal ratio, the protein would be expected to dominate the electron density profile of the monolayer. While the multistage DA approach appears to be more complex, it allows the VSD protein to freely associate with the solvating phospholipid in the Langmuir monolayer prior to tethering to the inorganic substrate, unlike the SA approach.
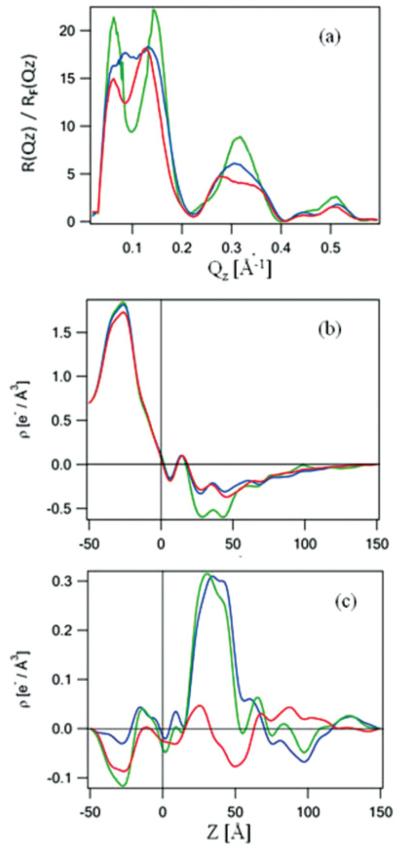
Figure 5 summarizes the x-ray interferometry results from a typical specimen prepared by DA approach hydrated with moist helium. Figure 5(a) shows the Fresnel-normalized reflectivities, which have similar integrals over the three stages, but exhibit significant stage-to-stage changes well in excess of the counting-statistics noise level throughout the accessed Qz range (0.01–0.62 Å−1). The features of the Si-Ni-Si multilayer substrate itself occur within −50 Å < z < 20 Å in the absolute electron density profiles, while the presence of VSD is readily evident in both absolute and difference electron density profiles [Figs. 5(b) and 5(c)]. The feature shown in the region of 20 Å < z < 70 Å in the blue difference profile in Fig. 5(c) represents the two-dimensional (2D) monolayer ensemble of VSD solvated by a monolayer of POPC. The electron density over this region is somewhat less than the average electron density of a protein (~0.4 e/Å3). Exchange of the VSD-POPC monolayer against POPC-OG followed by washing, intended to reconstitute a POPC bilayer environment for the protein, results in some structural reorganization, namely a small increase in electron density on the proximal side and a small decrease on the distal side of the VSD profile [red difference profile in Fig. 5(c)]. Proximal (near) and distal (far) are defined with respect to the substrate surface. Note that the red difference profile shown is Fig. 5(c) arises from the incorporation of additional POPC and/or some structural reorganization of the VSD itself. The average electron density of the bio-organic overlayer is largely retained, comparing the profiles from the monolayer prior to and following the putative bilayer reconstitution, indicative of successfully tethered VSD and consistent with the expectation that the protein is vectorially incorporated in the bilayer membrane (further discussion follows).
FIG. 5.
(Color online) The interferometric x-ray reflectivity results from a specimen prepared via the directed-assembly approach. The Fresnel-normalized reflectivity data are shown in (a) and the corresponding absolute electron density profiles in (b), where green (light gray) corresponds to the Si-Ni-Si multilayer substrate itself, blue (dark gray) to the tethered VSD-POPC monolayer, and red (gray) to the putative reconstituted VSD-POPC bilayer membrane. The difference electron density profiles, referenced to the profile of the Si-Ni-Si substrate itself, are shown in panel (c), where the blue (dark gray) profile is that of the VSD-POPC monolayer, the green (light gray) profile that of the reconstituted VSD-POPC membrane, and the red (gray) profile is the difference between them, namely the VSD-POPC membrane profile minus that for the VSD-POPC monolayer.
E. X-ray interferometry of VSD-OG monolayer and VSD-POPC membrane via SA at the solid-vapor interface
Figure 6 summarizes the x-ray interferometry results from a typical specimen prepared by the SA approach hydrated with moist helium. Figure 6(a) shows the Fresnel-normalized reflectivity, which again has similar integrals over the three stages, but exhibits significant stage-to-stage changes well in excess of the counting-statistics noise level throughout the accessed Qz range (0.01–0.62 Å−1). (See the Appendix, Fig. 14 for footprint and background corrected x-ray reflectivity data prior to normalization.) The features of the Si-Ni-Si multilayer substrate itself occur within − 50 Å < z < 20 Å in the absolute electron density profiles, while the presence of VSD is again evident in both absolute and difference electron density profiles [Figs. 6(b) and 6(c)]. The feature shown in the region of 20 Å < z < 60 Å in the blue difference profile in Fig. 5(c) represents the 2D monolayer ensemble of VSD-OG. The electron density over this region appears to be somewhat less than that achieved via the DA approach, although the average electron density level either side of this region in this difference profile fluctuates about a level less than 0.005 e/Å3. Exchange of the VSD-OG monolayer against POPC-OG followed by washing, intended to reconstitute a POPC bilayer environment for the protein, shown as the green difference profile, again results in some structural reorganization, seemingly dominated by a translation of the tethered protein away from the substrate surface [red difference profile in Fig. 6(c).] Again, note that the red difference profile shown in Fig. 6(c) arises from the incorporation of additional POPC and/or some structural reorganization of the VSD itself. The average electron density of the bio-organic overlayer increases somewhat, comparing the profiles from the monolayer prior to and following the putative bilayer reconstitution, but again indicative of successfully tethered VSD and consistent with the expectation that the protein is vectorially incorporated in the bilayer membrane (further discussion follows).
FIG. 14.
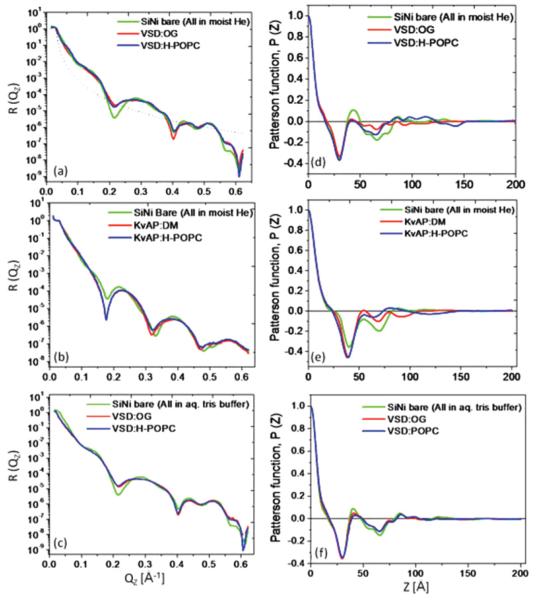
(Color online) (a)–(c) Beam-footprint-corrected x-ray reflectivity data; (d)–(f) autocorrelation (or Patterson) functions for the Si-Ni-Si substrate [green (light gray)], a VSD-OG monolayer [red (gray)], and the subsequent VSD-POPC membrane [blue (dark gray)] on its surface, all hydrated with moist He (top row), a KvAP-DM monolayer, and the subsequent KvAP-POPC membrane on its surface, all hydrated with moist He (middle row), and the same VSD-OG monolayer and the subsequent VSD-POPC membrane on its surface, all hydrated with aqueous buffer (bottom row). The autocorrelation functions are seen to be bounded (i.e., become effectively zero for larger z values) for all cases. For each case, the boundary constraint obtained from these autocorrelation functions is taken to be the same for the Si-Ni-Si substrate itself and with the tethered bio-organic overlayer(s) on its surface, namely the latter determine this constraint since their autocorrelation functions necessarily extend to larger z values. This is essential to making the derived electron density profiles directly comparable, allowing the use of the difference profiles employed in this work.
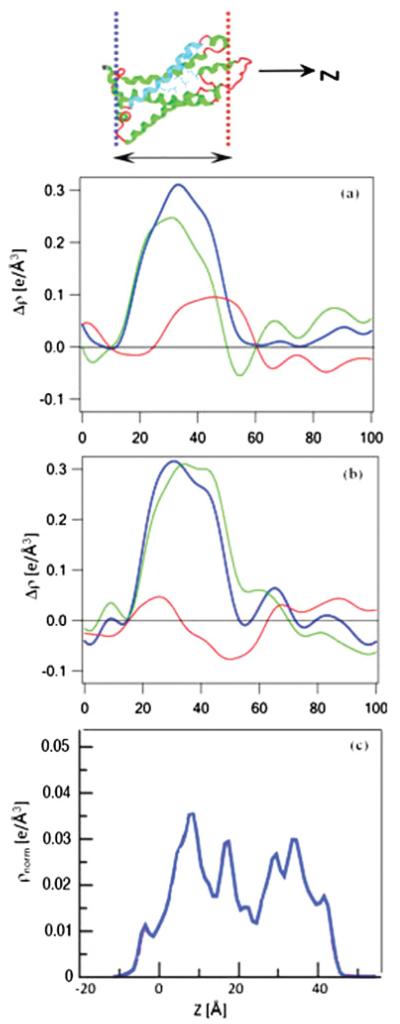
Comparisons of the difference electron density profiles for the VSD overlayer tethered by SA versus DA at the solid-vapor interface are shown in Figs. 7(a) and 7(b), respectively. Comparison of the VSD-OG profile with the VSD-POPC monolayer profile suggests that the VSD protein is packed rather more densely on the surface of the substrate using the multistep DA approach. This observation is not unanticipated considering the fact that the mixed VSD-POPC Langmuir monolayer, which is the precursor to the overlayer on the substrate, has been compressed and the VSD protein vectorially oriented unidirectionally at the water-gas interface prior to the chemisorption of the protein, whereas in the SA method, detergent-solubilized VSD molecules tumble in aqueous solution with chemisorption occurring randomly in time over the area of the substrate surface. Irrespective of the procedure for their preparation, it appears that the electron density profiles for the reconstituted VSD-POPC membranes (i.e., following reconstitution of a putative POPC bilayer environment for the VSD) agree well with the electron density profile calculated for isolated VSD within the Kv1.2-channel x-ray crystal structure, where the protein is solvated with a detergent-phospholipid mixture instead of only detergent (note that the x-ray crystal structure of the prokaryotic KvAP channel in this environment, necessary for the proper association of the VSD with the PD, has never actually been published. Thus, the highly similar transmembrane domain of the eukaryotic Kv1.2 channel is used here). In these reconstituted membranes, the VSD protein is expected to dominate the profile structure, since the POPC-VSD stoichiometry, which is known for the DA approach, is barely sufficient to solvate the lateral surfaces of the protein. This agreement concerns the profile extent (or dimension) of ~40 Å and its asymmetric features, namely higher density proximal relative to distal to the substrate surface, allowing for the considerably higher spatial resolution for the crystal structure. Note that this asymmetry in the VSD electron density profile, readily evident in the electron density profiles of the VSD-OG monolayer and the VSD-POPC membrane via either the SA or DA approach, is highly significant, indicative of this particular vectorial orientation of the VSD relative to the substrate surface. While the electron density profiles of the VSD-POPC membrane are seen to be qualitatively similar, they are quantitatively different in terms of the detailed nature of their asymmetry. This could reflect a differing degree of asymmetry in the putative reconstituted bilayer and/or a small difference in the profile structure of the VSD itself, given that refolding was required for the DA approach upon compression of the VSD-POPC monolayer prior to chemisorption.
FIG. 7.
(Color online) Comparison of the VSD-OG monolayer [green (light gray)] and VSD-POPC reconstituted membrane [blue (dark gray)] profiles from the SA approach in (a) with the VSD-POPC monolayer [green (light gray)] and VSD-POPC reconstituted membrane [blue (dark gray)] profiles from the DA approach in (b). The VSD-OG monolayer and both VSD-POPC reconstituted membrane profiles are similar to that calculated for the VSD from the x-ray crystal structure of Kv1.2 in a mixed detergent-phospholipid environment (c), both in profile extent (or dimension) and asymmetric features. Note that for the (c) calculated profile in blue (dark gray), the electron density and neutron scattering length density profiles for the fully hydrogenated VSD are very similar, and that this profile is calculated based on the area of the entire Kv1.2 channel, not the VSD itself (courtesy of Doug Tobias, University of California, Irvine). The oriented-VSD cartoon at the top of the figure is shown to guide the eye for the “profile structure” which is a projection of the 3D structure parallel to the plane of the membrane onto the normal to that plane.
F. X-ray interferometry of KvAP-DM monolayer and KvAP-POPC membrane via SA at the solid-vapor interface
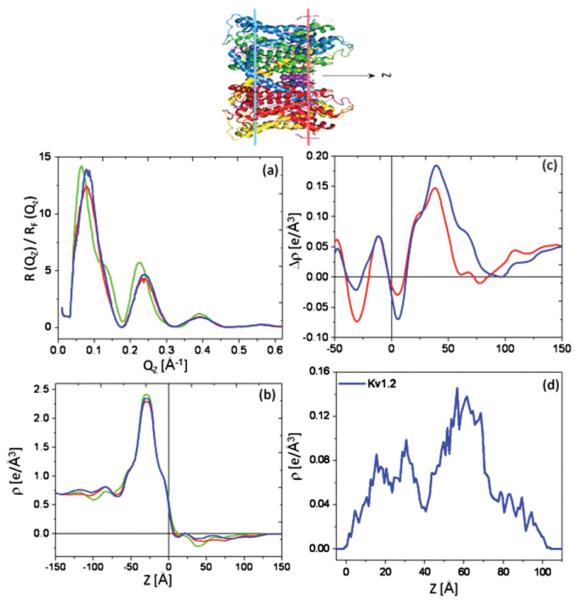
Encouraged by these results for VSD utilizing the SA approach, we sought to investigate the orientation of the VSD with respect to the PD in the full-length KvAP channel, cognizant of the fact that these are substantially different in the x-ray crystal structures of KvAP solvated by only aqueous detergent (DM) versus detergent-phospholipid mixtures (DM-POPC-POPE-POPS) [22]. We employed x-ray interferometry on KvAP-DM monolayers prepared via SA analogous to those for VSD-OG hydrated with moist helium. Figure 14(b) in the Appendix and Fig. 8(a) display footprint and background corrected and subsequent Fresnel-normalized reflectivity data, respectively, showing readily apparent systematic changes progressing from the multilayer substrate itself, to the KvAP-DM monolayer, to the KvAP-POPC membrane. Figures 5(b) and 5(c) summarize the results from the analysis in terms of both absolute and difference electron density profiles, respectively. The average electron density of the KvAP-DM monolayer in the difference profile [Fig. 8(c)] is comparable to that found for the VSD-OG monolayer, both prepared via SA. The total profile extent (or dimension) of the KvAP-DM monolayer is seen to be substantially smaller than that of the KvAP-POPC membrane, namely ~45 Å versus ~65 Å. This large change in profile structure, together with the readily apparent substantial changes in their respective asymmetric features, suggests a substantial reorganization of the KvAP protein upon changing from a detergent to a putative phospholipid bilayer environment, noting that the Kv protein would again be expected to dominate these electron density profiles. The profile structure of the KvAP-POPC membrane agrees reasonably well with that calculated from the x-ray crystal structure for the transmembrane domain of Kv1.2 (see prior note concerning KvAP versus Kv1.2 x-ray crystal structures) solvated with a detergent-phospholipid mixture [Fig. 8(d)], both in terms of their profile extents and particularly their asymmetric features, again noting the higher spatial resolution of the latter profile.
FIG. 8.
(Color online) The Fresnel-normalized reflectivity data (a) for bare Si-Ni-Si substrate itself [green (light gray)], with a KvAP-DM monolayer tethered to its surface via the SA approach [red (gray)], and subsequently for the KvAP-POPC reconstituted membrane [blue (dark gray)]. Corresponding absolute electron density profiles (b) (same color scheme) and the corresponding difference electron density profiles (c) for the KvAP-DM monolayer [red (gray)] and the KvAP-POPC membrane [blue (dark gray)], referenced to the profile of the Si-Ni-Si substrate itself, all in a moist helium environment. The electron density profile for Kv1.2 channel (d), calculated from the x-ray crystal structure in a mixed detergent-phospholipid environment. The oriented Kv1.2 cartoon is shown to guide the eye for the “profile structure” which is a projection of the 3D structure parallel to the plane of the membrane onto the normal to that plane.
G. X-ray interferometry of VSD-OG monolayer and VSD-POPC membrane via SA at the solid-liquid interface
Although integral membrane proteins can fully retain their function in lipid bilayer environments hydrated via the high relative humidity achievable with moist gas environments [25], full hydration with bulk aqueous media would normally be required for them to retain both their structure (fluid in-plane organization) and function (activity) [19]. Using the SA and DA approaches described herein, this hydration state would pertain to both proximal and distal sides of the membrane with respect to the substrate surface. Comparison of the electron density profiles of the VSD-OG monolayer and the VSD-POPC membrane might be expected to reveal the presence of the POPC, based on the relatively high electron density of its polar head groups, provided that exchange of the OG for POPC environment did not change the position of the VSD relative to the substrate surface or alter its profile structure. Full hydration with bulk aqueous buffer might be expected to facilitate such a comparison.
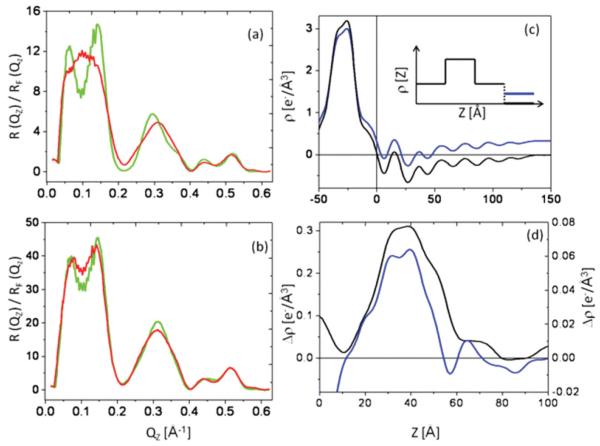
Figure 9(a) displays the Fresnel-normalized reflectivity from the VSD-OG monolayer prepared by SA hydrated with moist helium, while Fig. 9(b) displays that for the same VSD-OG monolayer hydrated with aqueous buffer, each along with that for the multilayer substrate itself in that environment. Although more subtle for the aqueous environment, significant changes occur in the Fresnel-normalized x-ray reflectivity progressing from the substrate itself to the VSD-OG monolayer, well in excess of the counting-statistics noise level throughout the accessed Qz range. Due to the aqueous environment, the value of the momentum transfer corresponding to the critical angle for total reflection (Qz)crit, key to the Fresnel-normalization, was expected to be significantly smaller for the silicon-water interface (0.0228 Å−1) than for the silicon-gas interface (0.0315 Å−1). For the measured reflectivity data, the determined best-fit values varied between 0.0243 and 0.0230 Å−1, progressing from substrate itself to VSD-OG and subsequent VSD-POPC overlayers. This marginal variation of ~7% over the course of the interferometry experiments is most likely due to Si and Ni interlayer diffusion. Figure 9(c) shows the absolute electron density profiles calculated for the Si-Ni-Si substrate itself, used to calculate the subsequent difference profiles, hydrated with moist helium compared with hydration with aqueous buffer; note that the average electron density for large distances from the substrate surface (e.g., z~100–150 Å) approaches 0.000 e/Å3 for hydration with moist helium and 0.333 e/Å3 for hydration with aqueous buffer. Figure 6(d) shows the difference electron density profiles for z 0 Å revealing the VSD-OG monolayer tethered to the substrate’s surface, hydrated with moist helium compared with that hydrated aqueous buffer, noting that the former is shown as an absolute electron density profile (i.e., referenced to moist helium at 0.000 e/Å3) while the latter is a relative (or excess) electron density profile (i.e., referenced to water at 0.333 e/Å3) in the respective profiles. The electron density profiles of the VSD-OG monolayer are thereby seen to be quite similar in terms of their maximal electron densities (0.30 e/Å3 versus 0.38 e/Å3), full widths (~50 Å), and asymmetric features, irrespective of their hydration with moist helium versus aqueous buffer.
FIG. 9.
(Color online) Fresnel-normalized reflectivity data for a Si-Ni-Si substrate [green (light gray)] and with a VSD-OG monolayer tethered to its surface [red (gray)] via the SA approach in (a) moist He, (b) aqueous Tris buffer environment. The corresponding absolute electron density profiles (c) for Si-Ni-Si substrate itself in moist He (black) and aqueous buffer [blue (dark gray)] environments. (d) The absolute difference electron density profile for the VSD-OG monolayer in moist helium (black), referenced to the substrate profile in moist helium (left ordinate scale), compared with the relative (or excess) difference electron density profile of the same VSD-OG monolayer in aqueous buffer [blue (dark gray)], referenced to the substrate profile in the buffer (right ordinate scale; note that 0.000 e−/Å3 on this relative scale is 0.333 e−/Å3 on an absolute scale). The inset in (c) depicts the simple cartoon for the Si-Ni-Si substrate in moist He versus aqueous buffer.
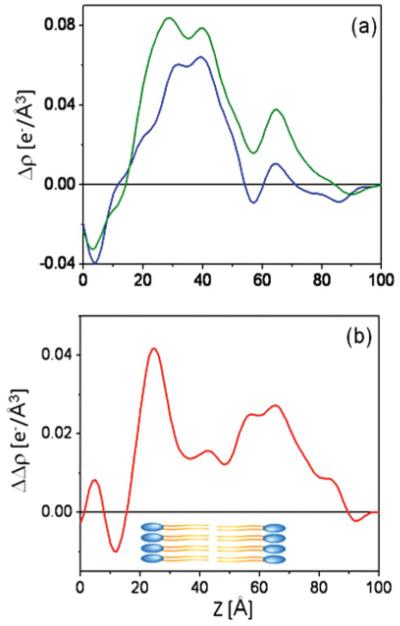
Figure 10(a) shows the relative electron density profile of the VSD-OG monolayer, compared with that following POPC-OG exchange intended to reconstitute a POPC bilayer environment for the VSD protein, both hydrated with aqueous buffer. A slight increase in the relative electron density profile for the VSD-POPC membrane (green profile) compared to the VSD-OG monolayer (blue profile) reveals features suggestive of replacement of the OG by a POPC bilayer. Moreover, the difference between the relative electron density profile for the VSD-POPC membrane minus that for the VSD-OG monolayer shown in Fig. 14(b) is consistent with a well ordered monolayer of POPC (i.e., a single resolved layer of polar head groups) proximal to the substrate surface and a positionally disordered POPC monolayer distal to the substrate, i.e., with two resolved layers of head groups in the profile projection, each with about half the amplitude of the single head group peak on the proximal side. The polar head group peaks on either side of the reconstituted bilayer exhibited the expected separation across the profile of the bilayer for POPC (~50 Å), with an intervening layer of lower electron density comparable to that of a fluid hydrocarbon core (hydrophobic tails of phospholipid bilayer). Given the similarity of the profile structures of the reconstituted VSD-POPC membranes hydrated with moist helium (Fig. 7), irrespective of their preparation via either SA or DA, the POPC-VSD stoichiometry is likely to be similar for both, noting that in the latter, this was intentionally 12:1 for the proximal monolayer of the bilayer. Moreover, this stoichiometry is also consistent with the relative electron density of the proximal-side polar head group feature (~0.04 e/Å3), based on the relative electron density of this feature in pure POPC bilayers (~0.08 e/Å3) and the relative areas occupied by the VSD protein and POPC in the plane of the precursor Langmuir monolayer of VSD-POPC at 40 mN/m obtained from the pressure-area isotherm data (i.e., ~700–750Å2 for each component). Notably, this stoichiometry (12:1 on a per monolayer basis or 24:1 on a per bilayer basis) is the minimal necessary to solvate the lateral surfaces of the VSD protein, as estimated from the area occupied by the VSD in the mixed POPC-VSD Langmuir monolayer at 40 mN/m and from molecular dynamics simulations of the tethered VSD-POPC membrane [26,27]. Thus, it is not at all surprising that the POPC bilayer structure revealed is highly perturbed, relative to that for a fully hydrated bilayer of pure POPC.
FIG. 10.
(Color online) The relative (or excess) difference electron density profiles (a) for the VSD-OG monolayer [blue (dark gray)] and the VSD-POPC reconstituted membrane [green (light gray)] prepared via the SA approach, and hydrated with aqueous buffer. The difference between these difference profiles, namely VSD-POPC membrane profile minus VSD-OG monolayer profile, is shown in (b) in red (gray). A schematic of the POPC bilayer is also shown for reference.
Lastly, we comment on the “sensitivity” of the x-ray interferometry data for the reconstituted membranes containing the vectorially oriented VSD or KvAP proteins at the solid-liquid interface as related to the ultimate goal, enabling the investigation of their conformational states as a function of the transmembrane electric potential. While the differences between the x-ray reflectivity data for the inorganic multilayer substrate itself versus that with the reconstituted membrane tethered to its surface are relatively small [e.g., as shown in Fig. 8(a), solid-vapor interface and in Fig. 8(b), solid-liquid interface], the signal-to-noise ratio over the entire range of photon momentum transfer is already substantially more than adequate to distinguish such differences (noting that they are also highly reproducible, specimen to specimen). Although these data were collected from flat specimens, necessitating simultaneous variation of the angles of incidence and reflection over a 30-min time interval, such data with the same signal-to-noise levels over the same range of momentum transfer can now be obtained in less than a second, using cylindrically bent inorganic multilayer substrates at the solid-liquid interface (alleviating the need for mechanically varying the angles of incidence and reflection) and focused undulator radiation at 22 keV. Employing cyclic changes in the transmembrane potential between any two selected values can then provide the signal-to-noise level required via signal averaging to accurately measure small differences in protein conformation in response to a step in the transmembrane voltage, noting that the total x-ray dosage remains small relative to that inducing radiation damage to the protein, if any.
IV. CONCLUSIONS
We report structural investigations via x-ray interferometry of the voltage-sensor domain or the full KvAP channel protein vectorially oriented within a single monolayer and subsequently within a reconstituted lipid bilayer membrane prepared by two independent approaches achieving high in-plane density, at both the solid-vapor and solid-liquid interfaces. Comparison of the profile structure for each protein within the reconstituted membrane with that calculated from their respective x-ray crystal structures confirms both the intended vectorial orientation of the protein within the membrane and indicates retention of the protein’s folded 3D tertiary structure upon completion of membrane reconstitution. Importantly, these developments are essential to enable direct structural investigations of the protein’s conformation as a function of the applied transmembrane electric potential at solid-liquid interface, both time resolved and steady state, utilizing synchrotron x-ray reflectivity techniques.
ACKNOWLEDGMENTS
We are indebted to Kenton Swartz and Dimitry Krepkiy for providing VSD-OG and Manuel Covarrubias and Aditya Bhattacharji for KvAP-DM proteins, Andrey Tronin for designing and Bill Pennie for fabricating the cell used to measure reflectivity in moist He and aqueous buffer environments, Ivan Kuzmenko and Chian Liu of the X-Ray Science Division, Argonne National Laboratory, for assistance with the liquid surface spectrometer alignment, and the fabrication of inorganic multilayer (Si-Ni-Si) substrates, respectively. We thank Paul Heiney for providing the triple-axis diffractometer facility, supported by the MRSEC program of the National Science Foundation (Grant No. DMR05-20020) and Erik Nordgren for helping in calculating the electron density from crystal structure of Kv1.2 channel. Use of the Advanced Photon Source was supported by the US Department of Energy, Office of Science, Office of Basic Energy Sciences, under Contract No. DE-AC02-06CH11357. This work is financially supported by NIH-NINDS Program Project, Grant No. NIH P01 GM086685 (S.G., J.K.B.) and NIH-NIGMS Program Project, Grant No. NIH P01 GM055876 (J.L., J.K.B.).
APPENDIX A. DIRECTED ASSEMBLY (DA)
Pressure-area isotherms
The surface pressure-area (π-A) isotherms were collected at ambient temperature with a custom-built Langmuir trough enclosed within a gas-tight canister, circulated with humid He gas to reduce x-ray background scattering from air and to minimize subphase evaporation. Surface pressure was monitored using a metal alloy probe hanging from a high precision microbalance (KBN 315, Kibron, Inc., Espoo, Finland). The KBN sensor provides a reliable measurement at the higher surface pressures important for the DA approach. A mixed monolayer of POPC-VSD at a defined mole ratio was prepared by sequentially spreading POPC in chloroform (22 μL) and VSD-OG (156 μL) solution onto the meniscus of a glass capillary through a microliter pipet at an oblique angle passing through the liquid-gas interface. The effectively infinite-volume, aqueous subphase typically contained 1-mM Tris and 5-mM KCl at pH 7.8. A delay of at least 30 min allowed excess detergent to dissolve into the subphase, prior to compression of the monolayer at a constant rate of ~125 Å2/VSD/min.
The area of the mixed monolayers is described in terms of the area per average molecule [Eq. (A1)], where the average molecule is defined as the sum of mole fractions of each component,
| (A1) |
where AL and AP are the average area of the lipid and protein molecules, respectively, and NL and NP are the number of lipid and protein molecules, respectively, noting that NT = NL + NP.
Pressure-area isotherms for five different mole ratios are shown in Fig. 11. At 40 mN/m (see corresponding x-ray reflectivity results following), the POPC occupies ~60 Å2/molecule and the VSD protein occupies ~750 Å2/molecule in the monolayers of the pure components, as well as in the mixed monolayers at this surface pressure employing Eq. (A1).
X-ray reflectivity
X-ray reflectivity data were recorded from Langmuir monolayers of VSD-POPC mixtures as a function of the applied surface pressure, shown in Fig. 12 as the Fresnel-normalized reflectivity data, using methods described previously [15,19,22]. They were analyzed to provide the corresponding monolayer electron density profiles, also shown in Fig. 12. At low surface pressures below 40 mN/m, the tertiary structure of the VSD protein appears to be unfolded, as the width of the electron density feature at the water-gas interface is ~10 Å, consistent with the diameter of α helices all lying in the plane of the interface. At 40 mN/m, the width of this feature increases to ~43 Å, consistent with the length of the four-helix bundle (S1–S4) of the folded VSD protein. Above 40 mN/m, this feature extends much further into the aqueous subphase, presumably due to a pressure-induced unfolding of the tertiary structure resulting in an extension along the only remaining dimension available, namely perpendicular to the interface. As a result, the DA approach utilized a compression of the Langmuir monolayer of the VSD-POPC mixture to a surface pressure of 40 mN/m, prior to tethering the VSD to the NTA end groups of the alkylate surface of the Si-Ni-Si multilayer substrates.
APPENDIX B. X-RAY INTERFEROMETRY
Data analysis comment 1
The method of data analysis utilized in the x-ray interferometry experiments has been thoroughly described previously [17]. It employs the distorted-wave Born approximation applied to the Fresnel-normalized x-ray reflectivity data. Representative reflectivity data prior to Fresnel normalization are shown in Fig. 14 for a tethered VSD-OG monolayer and a tethered KvAP-DM monolayer hydrated with moist helium, and the same VSD-OG monolayer hydrated with aqueous buffer, all three prior to and following exchange against POPC-OG, along with the data for the Si-Ni-Si multilayer substrate itself for each case. The Fourier transform of the Fresnel-normalized data provides the autocorrelation function of the gradient electron density profile for the Si-Ni-Si multilayer substrate itself, versus that for the substrate plus the bio-organic overlayer, which are bounded. This boundary constraint is key input for the so-called box-refinement algorithm utilized to solve the classic “phase problem” in the derivation of the electron density profiles. The corresponding autocorrelation functions are also shown in Fig. 14.
Data analysis comment 2
The Fourier and inverse Fourier transforms involved in the box-refinement algorithm employed in the analysis are subject to both (Qz)min and (Qz)max truncation, the former because total x-ray reflection occurs for incident angles less than the critical reflection angle, and the latter because of the minimum separation of distinct features in the gradient profile of the multilayer substrate-bio-organic overlayer system. The effects of each are demonstrated in model calculations shown in Fig. 13. For (Qz)max truncation only, the derived electron density profiles ρ(z), obtained by numerical integration from the gradient electron density profiles dρ(z)/dz provided by the analysis, contain only the typical low-amplitude, minimum wavelength fluctuations dictated by the value of (Qz)max , beyond which no significant Fresnel-normalized reflectivity data can be observed. The addition of (Qz)min truncation effects is more serious, causing the derived electron density profiles to possess curvature over regions outside the boundaries of the gradient profile where they would otherwise be flat (see Fig. 13). Nevertheless, as shown in the figure, the use of difference profiles Δρ(z), namely the electron density profile ρ(z) of the multilayer substrate with a bio-organic overlayer minus that of the substrate itself, effectively removes the effect of (Qz)min truncation, thereby accurately revealing the electron density profile of only the bio-organic overlayer. This “preservation of overlayer features” in such difference profiles has similarly been shown to occur for progressively lower average electron densities of the organic overlayer, relative to that of silicon, limited ultimately by the presence of significant features in the Fresnel-normalized reflectivity data due to the presence of the organic overlayer on the multilayer substrate’s surface, as determined by counting-statistics accuracy of the data over the accessed Qz range.
Footnotes
PACS number(s): 87.14.ep, 61.05.cm, 87.15.kt
References
- [1].Hodgkin AL, Huxley AF. J. Physiol. 1952;117:500. doi: 10.1113/jphysiol.1952.sp004764. [DOI] [PMC free article] [PubMed] [Google Scholar]
- [2].Bezanilla F. Physiol. Rev. 2000;80:555. doi: 10.1152/physrev.2000.80.2.555. [DOI] [PubMed] [Google Scholar]
- [3].Hill B. Ion Channels of Excitable Membranes. 3rd ed Sinauer; Sunderland, MA: 2001. [Google Scholar]
- [4].Long SB, Campbell EB, MacKinnon R. Science. 2005;309:897. doi: 10.1126/science.1116269. [DOI] [PubMed] [Google Scholar]
- [5].Long SB, Campbell EB, MacKinnon R. Science. 2005;309:903. doi: 10.1126/science.1116270. [DOI] [PubMed] [Google Scholar]
- [6].Long SB, Tao X, Campbell EB, MacKinnon R. Nature. 2007;450:373. doi: 10.1038/nature06265. [DOI] [PubMed] [Google Scholar]
- [7].Cuello LG, Jogini V, Cortes DM, Pan AC, Gagnon DG, Dalmas O, Perozo E. Nature. 2010;466:272. doi: 10.1038/nature09136. [DOI] [PMC free article] [PubMed] [Google Scholar]
- [8].Yeheskei A, Haliloglu T, Tal NB. Biophys. J. 2010;98:2179. doi: 10.1016/j.bpj.2010.01.049. [DOI] [PMC free article] [PubMed] [Google Scholar]
- [9].Ledwell JL, Aldrich RW. J. Gen. Physiol. 1999;113:389. doi: 10.1085/jgp.113.3.389. [DOI] [PMC free article] [PubMed] [Google Scholar]
- [10].Tombola F, Pathak MM, Isacoff EY. Annu. Rev. Cell Dev. Biol. 2006;22:23. doi: 10.1146/annurev.cellbio.21.020404.145837. [DOI] [PubMed] [Google Scholar]
- [11].Yellen G. Q. Rev. Biophys. 1998;31:239. doi: 10.1017/s0033583598003448. [DOI] [PubMed] [Google Scholar]
- [12].Grabe M, Lai HC, Jain M, Jan YN, Jan LY. Nature. 2007;445:550. doi: 10.1038/nature05494. [DOI] [PubMed] [Google Scholar]
- [13].Butterwick JA, MacKinnon R. J. Mol. Biol. 2010;403:591. doi: 10.1016/j.jmb.2010.09.012. [DOI] [PMC free article] [PubMed] [Google Scholar]
- [14].Shenkarev ZO, Paramonov AS, Lyukmanova EN, Shingarova LN, Yakimov SA, Dubinnyi MA, Chupin VV, Kirpichnikov MP, Blommers MJJ, Arseniev AS. J. Am. Chem. Soc. 2010;132:5630. doi: 10.1021/ja909752r. [DOI] [PubMed] [Google Scholar]
- [15].Lesslauer W, Blasie JK. Acta Crystallogr. A. 1971;27:456. [Google Scholar]
- [16].Materlik G, Frahm A, Bedzyk MJ. Phys. Rev. Lett. 1984;52:441. [Google Scholar]
- [17].Krishnan V, Strzalka J, Liu J, Liu C, Kuzmenko I, Gog T, Blasie JK. Phys. Rev. E. 2010;81:021604. doi: 10.1103/PhysRevE.81.021604. [DOI] [PubMed] [Google Scholar]
- [18].Chupa JA, McCauley JP, Strongin RM, Smith AB, Blasie JK, Peticolas LJ, Bean JC. Biophys. J. 1994;67:336. doi: 10.1016/S0006-3495(94)80486-2. [DOI] [PMC free article] [PubMed] [Google Scholar]
- [19].Kneller LR, Edwards AM, Nordgren CE, Blasie JK, Berk NF, Krueger S, Majkrzak CF. Biophys. J. 2001;80:2248. doi: 10.1016/S0006-3495(01)76197-8. and references therein. [DOI] [PMC free article] [PubMed] [Google Scholar]
- [20].Krepkiy D, Mihailescu M, Freites JA, Schow EV, Worcester DL, Gawrisch K, Tobias DJ, White SH, Swartz KJ. Nature. 2009;462:473. doi: 10.1038/nature08542. [DOI] [PMC free article] [PubMed] [Google Scholar]
- [21].Blasie JK, Zheng S, Strzalka J. Phys. Rev. B. 2003;67:224201–1. [Google Scholar]
- [22].Jiang Y, Ruta V, Chen J, Lee A, MacKinnon R. Nature. 2003;423:42. doi: 10.1038/nature01581. [DOI] [PubMed] [Google Scholar]
- [23].McGillivray DJ, Valincius G, Heinrich F, Robertson JWF, Vanderah DJ, Febo-Ayala W, Kasianowicz JJ. Biophys. J. 2009;96:1547. doi: 10.1016/j.bpj.2008.11.020. [DOI] [PMC free article] [PubMed] [Google Scholar]
- [24].Zheng S, Strzalka J, Jones DH, Opella SJ, Blasie JK. Biophys. J. 2003;84:2393. doi: 10.1016/S0006-3495(03)75045-0. [DOI] [PMC free article] [PubMed] [Google Scholar]
- [25].Pierce DH, Scarpa A, Trentham DR, Topp MR, Blasie JK. Biophys. J. 1983;44:365. doi: 10.1016/S0006-3495(83)84310-0. [DOI] [PMC free article] [PubMed] [Google Scholar]
- [26].Freites JA, Tobias DJ, von Heijne G, White SH. Proc. Natl. Acad. Sci. USA. 2005;102:15059. doi: 10.1073/pnas.0507618102. [DOI] [PMC free article] [PubMed] [Google Scholar]
- [27].Freites JA, Tobias DJ, White SH. Biophys. Lett. 2006;80:L90. doi: 10.1529/biophysj.106.096065. and references therein. [DOI] [PMC free article] [PubMed] [Google Scholar]


