

Abstract
Never or curtailed lactation has been associated with an increased risk for incident hypertension, but the effect of exclusive breastfeeding is unknown. The authors conducted an observational cohort study of 55,636 parous women in the US Nurses’ Health Study II. From 1991 to 2005, participants reported 8,861 cases of incident hypertension during 660,880 person-years of follow-up. Never or curtailed lactation was associated with an increased risk of incident hypertension. Compared with women who breastfed their first child for ≥12 months, women who did not breastfeed were more likely to develop hypertension (hazard ratio (HR) = 1.27, 95% confidence interval (CI): 1.18, 1.36), adjusting for family history and lifestyle covariates. Women who never breastfed were more likely to develop hypertension than women who exclusively breastfed their first child for ≥6 months (HR = 1.29, 95% CI: 1.20, 1.40). The authors found similar results for women who had never breastfed compared with those who had breastfed each child for an average of ≥12 months (HR = 1.22, 95% CI: 1.13, 1.32). In conclusion, never or curtailed lactation was associated with an increased risk of incident maternal hypertension, compared with the recommended ≥6 months of exclusive or ≥12 months of total lactation per child, in a large cohort of parous women.
Keywords: breast feeding, hypertension, lactation, oxytocin, parity, pregnancy, prolactin, women
Primary prevention of hypertension is a major public health priority. Although pharmacologic treatment can reduce the burden of this disease, compliance is poor, and adverse effects of treatment are common (1). Thus, hypertension remains a leading preventable cause of death for women (2).
Multiple lifestyle factors have been associated with increased incident hypertension (3). In addition, parous women who never breastfed (4) or only briefly lactated (5) may also have an increased risk of developing hypertension, compared with women who lactate for longer periods of time. Absent or premature discontinuation of lactation has also been associated with increased risks for diabetes (5–8), hyperlipidemia (5, 9), the metabolic syndrome (10, 11), and cardiovascular disease (5, 12, 13).
The mechanisms underlying these associations are not known. Lactation is associated with weight loss in some, but not all, studies, and we have previously hypothesized that lactation may “reset” maternal metabolism after pregnancy, reducing risk of obesity-related disease (14). Lactation also activates central neuroendocrine pathways, including oxytocin and prolactin, and these hormones have been associated with blood pressure regulation (15) and incident hypertension risk (16).
However, unmeasured confounding is a major concern in studies of lactation and health outcomes, because mothers who breastfeed are more likely to engage in other health-promoting behaviors (17, 18). Such confounding is a potential limitation of the 3 prior studies that have measured the association between lactation and hypertension. One study assessed incident disease in a population without data on dietary intake other than alcohol (4), and 2 studies measured prevalent hypertension, adjusting only for concurrent health behaviors (5, 11). No prior study has included information on pregnancy complications, such as preeclampsia or preterm birth, which may affect both breastfeeding success and maternal hypertensive disease risk. Moreover, previous studies have not considered the timing of introduction of foods other than breast milk, which is a measure of breastfeeding intensity.
To address these limitations in the existing literature, we measured the association between duration and exclusivity of lactation and incident maternal hypertension in the second Nurses’ Health Study. This large, prospective cohort includes data on duration of exclusive lactation for each child, as well as hypertensive pregnancy complications and preterm birth. Moreover, the study design allowed us to adjust our analyses for multiple lifestyle factors previously associated with risk of incident hypertension in women (3). We further conducted a sensitivity analysis to quantify the degree of unmeasured confounding that would explain observed associations between lactation and incident hypertension.
MATERIALS AND METHODS
Study population
The Nurses’ Health Study II began in 1989, enrolling 116,608 women from 14 US states. Participants were between 25 and 42 years of age at baseline. Each woman completed detailed questionnaires every 2 years. We limited the current analyses to data collected since 1991, the first year for which dietary data were available. We limited our analysis to women who could be “exposed” to breastfeeding, by excluding women who were nulliparous (n = 22,590), as well as those with missing data on breastfeeding (n = 19,605). Compared with women for whom breastfeeding data were available, women missing data on breastfeeding were less likely to self-identify as Caucasian (90% vs. 94%) or to be currently using oral contraceptives (60% vs. 73%) and were more likely to be current smokers (13% vs. 9%) and to be missing data on other health behaviors. However, the 2 groups were similar in age (assessed in 1991), year of first birth, body mass index (BMI) at age 18 years, and family history of hypertension.
We further excluded women who reported a diagnosis of hypertension prior to 1991 (n = 4,583) or who in 1989 reported elevated blood pressure (median systolic blood pressure >120 mm Hg or diastolic blood pressure >80 mm Hg, n = 7,038) or antihypertensive medications (n = 1,640). We further excluded women with self-reported physician-diagnosed diabetes (n = 215), cardiovascular diseases (n = 153), hyperlipidemia (n = 4,538), or cancer (n = 328) (Figure 1).
Figure 1.
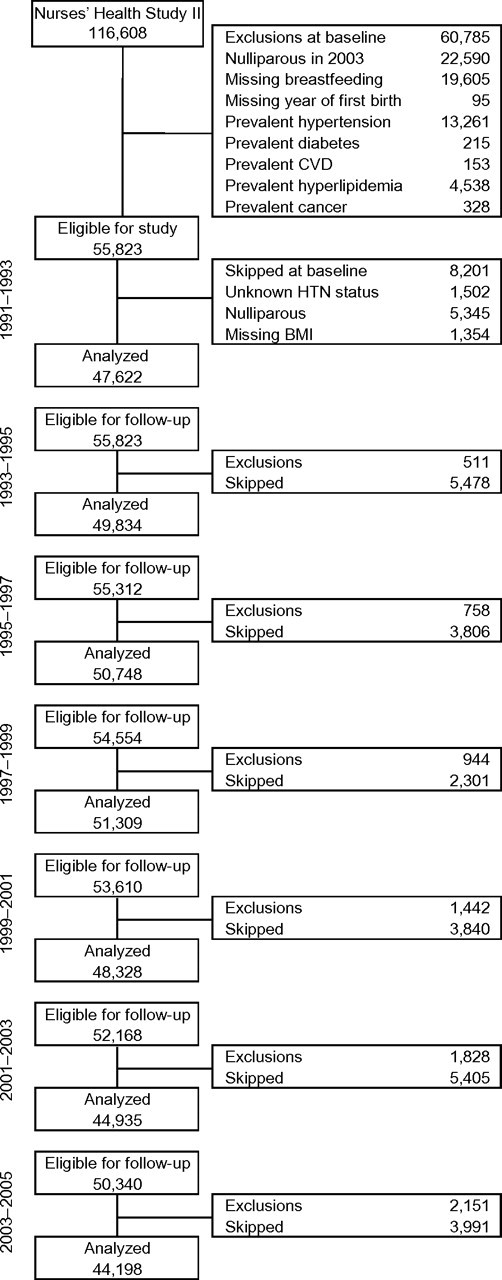
Study population, Nurses’ Health Study II, United States, 1991–2005. Participants were excluded from follow-up if they were diagnosed with hypertension or died. Participants were skipped in the current follow-up cycle if they were nulliparous, had unknown hypertension status, or were missing information on current body mass index. BMI, body mass index; CVD, cardiovascular disease; HTN, hypertension.
Assessment of parity and lactation history
At baseline in 1989 and on each biennial questionnaire, women reported their number of pregnancies lasting ≥6 months. In 1997, participants completed a detailed questionnaire on breastfeeding for each of their first 4 children, including timing of introducing formula and solid foods. Women with births after 1997 completed a similar questionnaire in 2003.
Measurement of the outcome
At baseline and on biennial follow-up questionnaires, participants were asked to report whether they had ever had a physician diagnosis of high blood pressure, excluding during pregnancy. If so, they were asked what year they received this diagnosis. Self-reported hypertension has been previously validated in our population by review of medical records for a randomly selected sample of 147 participants (19). The sensitivity of self-reported hypertension was 94%, and the specificity of reporting no diagnosis of hypertension was 85%. At baseline in 1989, participants were also asked to report their usual blood pressure when checked within the last 2 years.
Measurement of covariates
We included the following time-fixed covariates in our covariate-adjusted models: year of first birth, body mass index at age 18 years, family history of hypertension, self-classified race, and history of pregnancy complications. Parental history of hypertension and self-reported race were assessed on the 1989 questionnaire. Pregnancy complications, including gestational diabetes, preeclampsia, gestational hypertension, gestational diabetes, preterm birth, late miscarriage or stillbirth, and low birth weight, were self-reported on a supplemental questionnaire in 2001.
Time-varying covariate data were collected on multiple questionnaires. On each questionnaire, women reported current weight, use of nonnarcotic analgesics, and oral contraceptive use. Women reported height in 1989. We used current weight and self-reported height to calculate BMI (weight (kg)/height (m)2) at each follow-up time. Women reported alcohol consumption in 1991, 1995, 1999, and 2003 and physical activity in 1989, 1991, 1997, and 1999 (20). We calculated a Dietary Approaches to Stop Hypertension (DASH) diet score for each participant on the basis of validated food frequency questionnaires collected every 4 years (3).
Statistical analysis
The hazard ratio of incident hypertension by lactation history was assessed with a Cox proportional hazards model. Women contributed person-years from 1991 until diagnosis of hypertension, death, or study end date of June 2005. Because lactation duration was reported categorically, we modeled our primary analysis using categories. Two-sided P values are reported for trends, and 95% confidence intervals are reported for hazard ratio estimates.
As lactation is highly correlated with other health behaviors, both residual confounding and unmeasured confounding are major concerns. To address this problem, we used 2 different approaches. For our primary analysis, we used propensity scores with inverse probability weights (IPWs) to model the association between duration of lactation for the first child and incident hypertension. We then performed a sensitivity analysis to determine the degree of unmeasured confounding that would be needed to explain observed associations. In a secondary analysis, we measured the association between mean duration per child and incident hypertension, using multivariable regression.
All major medical organizations in the United States recommend ≥6 months of exclusive and ≥12 months of total breastfeeding for each child (21–23). We therefore used these durations as referent categories. We defined optimal breastfeeding as having occurred when a mother reported both ≥12 months of total breastfeeding and ≥6 months of exclusive breastfeeding for her first child.
To account for differences in other risk factors for hypertension, we created propensity scores for breastfeeding duration categories (24, 25). We used multinomial regression to model probability of each duration category as a function of covariates at study baseline in 1991, or, for women whose first birth occurred after 1993, at the cycle immediately preceding her first birth. We included in this propensity score body mass index at age 18 years and year of first birth (linear and quadratic), self-reported history of pregnancy complications (ever/never history of each condition: preeclampsia, gestational hypertension, gestational diabetes, preterm birth, low birth weight infant, or stillbirth), smoking status (current, past, missing), vigorous physical activity (<30, 30–59, 60–119, 120–209, ≥210 minutes/week), alcohol consumption (<1, 1–4, 5–9, 10 –14, 15–29, ≥30 g/day), DASH diet score quintile, family history of hypertension, current oral contraceptive use, current nonnarcotic analgesic use (none, <2, ≥2 days/week), and self-reported race (white, Hispanic, black, Asian, other).
We constructed weights for each participant using the inverse probability of the duration category she reported (26). We used these normalized IPWs in our Cox proportional hazards models. All models were adjusted for the woman’s age and follow-up time in months. To test whether BMI was an intermediate between lactation duration and incident hypertension, we added BMI to our IPW models, using 3-knot quadratic splines (27) to allow for nonlinear associations. We then performed a sensitivity analysis (28, 29) to determine the degree of unobserved confounding that would explain observed associations.
Many of the women in our cohort gave birth prior to the start of study follow-up in 1991, so we could not adjust for concurrent behaviors. In an additional sensitivity analysis, we limited our population to women with a first birth after 1989. For propensity weights, we further included pregravid BMI, defined as the BMI in the cycle prior to the first birth.
We further estimated the population-attributable risk of suboptimal lactation, which is the hypothetical proportion of hypertension cases that would be avoided if all individuals in the study lactated exclusively for ≥6 months and continued for ≥12 months. We used a previously published statistical approach (30) for this calculation, which assumes that there is an independent, causal association between lactation and incident hypertension.
To determine whether our results were sensitive to our modeling approach, we further measured the association between mean duration of lactation per child and incident hypertension, using Cox proportional hazards regression. We derived 2 variables, mean total duration per child and mean exclusive duration per child, which were updated during follow-up, as were lifestyle covariates. To test whether pregnancy complications confounded the association between lactation duration and incident hypertension, we quantified changes in parameter estimates for each duration category in age-adjusted models and in models adjusting for each pregnancy complication. To test whether a history of gestational hypertension, preeclampsia, or both modified associations between lactation and incident hypertension, we tested for effect modification using an interaction term.
All analyses were performed by using SAS, version 9.1, software (SAS Institute, Inc., Cary, North Carolina). The Institutional Review Board of Partners Healthcare approved the study. All P values were 2 tailed, and values of less than 0.05 were considered statistically significant.
RESULTS
There were 55,636 parous women who were eligible for our analysis, of whom 80.6% had breastfed their first child, 16.8% had breastfed their first child for ≥12 months, and 14.6% had exclusively breastfed their first child for ≥6 months. Longer lactation duration for the first child was associated with higher parity (Table 1), as well as lower BMI during follow-up, less family history of hypertension, less frequent smoking, and oral contractive use, higher DASH diet score, more frequent vigorous exercise, and more analgesic use.
Table 1.
Age-standardizeda Characteristics of 55,636 Parous Women in the Nurses’ Health Study II During Study Follow-up, by Duration of Lactation for First Child, United States, 1991–2005
| Duration of Lactation for First Child, months |
|||||||||||||
| None |
>0–3 |
>3–6 |
>6–9 |
>9–<12 |
≥12 |
||||||||
| No. | Mean | No. | Mean | No. | Mean | No. | Mean | No. | Mean | No. | Mean | ||
| Person-years | 126,012 | 95,475 | 125,370 | 111,970 | 89,853 | 112,200 | |||||||
| Age in 1991, yearsb | 37.3 | 35.5 | 35.1 | 35.2 | 35.4 | 35.7 | |||||||
| Year of first birthb | 1978 | 1982 | 1983 | 1983 | 1983 | 1983 | |||||||
| % | Mean | % | Mean | % | Mean | % | Mean | % | Mean | % | Mean | ||
| Race/ethnicityc | |||||||||||||
| White | 92.4 | 93.0 | 93.3 | 93.9 | 94.5 | 95.4 | |||||||
| Black | 2.0 | 0.9 | 0.9 | 0.9 | 0.6 | 0.4 | |||||||
| Hispanic | 0.9 | 1.0 | 1.0 | 0.8 | 0.7 | 0.8 | |||||||
| Asian | 0.8 | 1.7 | 1.5 | 1.2 | 1.0 | 1.1 | |||||||
| Other | 2.1 | 1.6 | 1.8 | 1.5 | 1.7 | 1.2 | |||||||
| Missing | 1.8 | 1.8 | 1.6 | 1.7 | 1.6 | 1.2 | |||||||
| Body mass index at age 18 years, kg/m2 | 20.7 | 20.9 | 20.6 | 20.5 | 20.5 | 20.5 | |||||||
| Body mass index in follow-up (1991–2005), kg/m2 | 25.1 | 25.3 | 24.9 | 24.6 | 24.4 | 24.2 | |||||||
| Family history of hypertension | 49.8 | 46.5 | 46.9 | 46.4 | 47.1 | 46.1 | |||||||
| Parity | |||||||||||||
| 1 | 22.0 | 19.4 | 19.3 | 16.3 | 15.1 | 17.4 | |||||||
| 2 | 48.1 | 49.8 | 48.7 | 48.6 | 47.5 | 45.6 | |||||||
| 3 | 22.3 | 23.1 | 24.2 | 26.0 | 27.7 | 25.7 | |||||||
| ≥4 | 7.7 | 7.6 | 7.9 | 9.1 | 9.8 | 11.4 | |||||||
| Any pregnancy complicationd | 24.9 | 23.8 | 22.9 | 21.9 | 21.7 | 22.1 | |||||||
| Ever preeclampsia | 10.1 | 9.8 | 9.6 | 8.5 | 8.2 | 8.2 | |||||||
| Ever gestational hypertension | 6.1 | 6.5 | 6.9 | 6.3 | 6.3 | 6.5 | |||||||
| Ever gestational diabetes | 4.7 | 5.3 | 5.1 | 5.0 | 5.1 | 5.4 | |||||||
| Ever infant <2.5 kg | 5.7 | 4.6 | 3.7 | 3.4 | 3.8 | 3.5 | |||||||
| Ever preterm birth | 9.0 | 8.2 | 7.2 | 7.5 | 7.6 | 6.9 | |||||||
| Ever stillbirth at >12 weeks | 2.1 | 1.4 | 1.2 | 1.4 | 1.8 | 1.6 | |||||||
| Smoking statuse | |||||||||||||
| Past | 24.0 | 23.7 | 24.7 | 24.4 | 22.6 | 22.8 | |||||||
| Current | 14.2 | 10.4 | 9.2 | 7.5 | 5.9 | 4.3 | |||||||
| Current oral contraceptive user | 78.2 | 74.9 | 72.8 | 71.6 | 70.0 | 68.5 | |||||||
| DASH diet scoree | |||||||||||||
| Quintile 1 | 27.8 | 22.7 | 18.8 | 15.0 | 12.8 | 10.5 | |||||||
| Quintile 2 | 22.1 | 22.1 | 21.6 | 19.4 | 18.0 | 15.6 | |||||||
| Quintile 3 | 17.8 | 17.9 | 18.7 | 19.2 | 19.1 | 17.6 | |||||||
| Quintile 4 | 14.9 | 17.5 | 19.7 | 21.0 | 22.1 | 23.0 | |||||||
| Quintile 5 | 10.6 | 13.5 | 15.7 | 19.5 | 22.9 | 28.3 | |||||||
| Alcohol consumption, g/daye | |||||||||||||
| <1 | 37.6 | 35.4 | 31.7 | 31.6 | 34.9 | 38.6 | |||||||
| 1–4 | 31.8 | 32.3 | 33.6 | 33.1 | 32.1 | 31.0 | |||||||
| 5–9 | 8.6 | 9.2 | 10.1 | 10.6 | 10.0 | 9.3 | |||||||
| 10–14 | 4.4 | 4.6 | 5.7 | 5.9 | 5.5 | 5.0 | |||||||
| 15–29 | 2.3 | 2.6 | 3.2 | 3.5 | 3.2 | 2.9 | |||||||
| ≥30 | 0.9 | 1.0 | 1.3 | 1.2 | 1.2 | 1.0 | |||||||
| Vigorous exercise, minutes/weeke | |||||||||||||
| <30 | 42.3 | 43.6 | 40.0 | 38.9 | 37.7 | 38.1 | |||||||
| 30–59 | 11.0 | 10.4 | 10.8 | 10.6 | 11.1 | 10.6 | |||||||
| 60–119 | 17.3 | 16.5 | 17.3 | 17.8 | 17.8 | 18.3 | |||||||
| 120–209 | 10.6 | 10.6 | 11.3 | 11.5 | 12.6 | 12.6 | |||||||
| ≥210 | 7.8 | 7.9 | 9.3 | 10.3 | 10.5 | 10.5 | |||||||
| Any analgesic at least 1 time/week | 44.5 | 45.7 | 47.2 | 49.1 | 49.4 | 53.5 | |||||||
Abbreviation: DASH, Dietary Approaches to Stop Hypertension.
Data are presented as percentages unless otherwise indicated and are directly standardized in years to the age distribution of the Nurses’ Health Study II.
Unadjusted mean age in 1991 and year of first birth.
Total sums to >100 because participants could select more than one race/ethnicity.
Any pregnancy complicated by preeclampsia, gestational hypertension, gestational diabetes, birth of an infant at <37 weeks’ gestation, birth of an infant weighing <2,500 g, or miscarriage or stillbirth at >12 weeks’ gestation.
Percentages do not sum to 100 because of missing data.
Both total duration and exclusive duration of lactation for the first child were correlated with subsequent parity (Mantel-Haenszel chi-square test for trend, P < 0.0001), and lactation durations among siblings were highly correlated (Pearson’s r = 0.46–0.81) (P < 0.0001). Thus, parity may be a “collider,” and adjustment for parity may produce false associations between lactation duration and outcome (31). For our primary analysis, we therefore analyzed the association between lactation duration for the first child (not all children) and incident hypertension.
We ascertained 8,861 cases of incident hypertension during 660,880 person-years of follow-up. We found a dose-response association between never or curtailed breastfeeding and incident hypertension risk. In IPW-adjusted models, mothers who had never breastfed had a 1.27-fold risk of incident hypertension (95% confidence interval (CI): 1.18, 1.36) (across breastfeeding duration categories, Ptrend < 0.001) compared with mothers who lactated for ≥12 months after their first birth (Figure 2; Table 2). To test whether BMI mediated this association, we further adjusted for BMI during follow-up, which modestly attenuated the association (for never vs. ≥12 months of lactation for the first child, BMI-adjusted hazard ratio (HR) = 1.22, 95% CI: 1.13, 1.31) (across breastfeeding duration categories, Ptrend < 0.001). When we measured the association between duration of exclusive lactation and incident hypertension, we found that women who did not lactate had an IPW-adjusted 1.29-fold risk of incident hypertension (95% CI: 1.20, 1.40) (across breastfeeding duration categories, Ptrend < 0.001) compared with having exclusively lactated for ≥6 months after the first birth (Table 2). Again, this association was somewhat attenuated in models adjusting for BMI during follow-up (for never vs. ≥6 months of exclusive lactation for the first child, BMI-adjusted HR = 1.22, 95% CI: 1.13, 1.31) (across breastfeeding duration categories, Ptrend < 0.001). All associations were materially unchanged with adjustment for lifetime parity.
Figure 2.
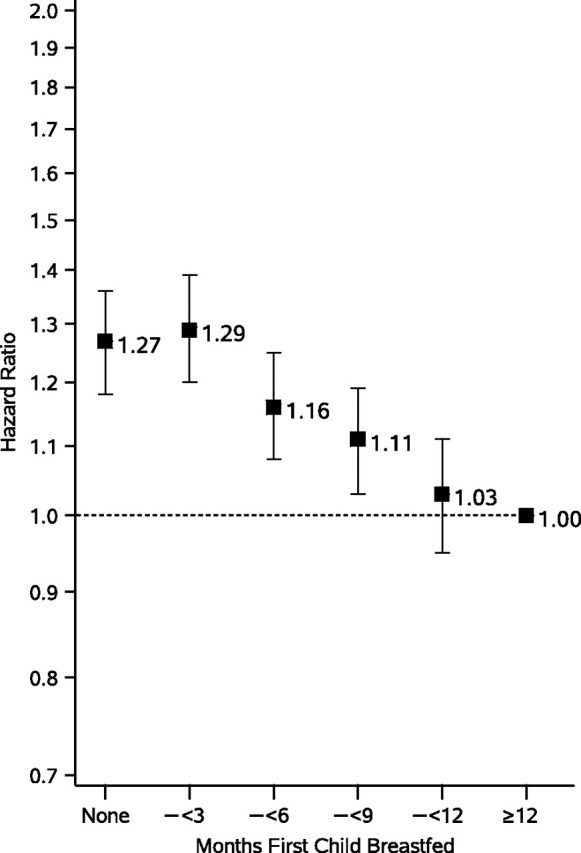
Association between duration of total breastfeeding for the first child and incident hypertension among 55,636 parous women in the Nurses’ Health Study II, United States, 1991–2005. Adjusted for age and inverse probability weight, derived from a multinomial logistic regression model for probability of each breastfeeding duration category as a function of maternal body mass index at age 18 years (linear and quadratic), year of first birth (linear and quadratic), self-reported history of preeclampsia, gestational hypertension, gestational diabetes, birth of an infant at <37 weeks’ gestation, birth of an infant weighing <2,500 g, miscarriage or stillbirth at >12 weeks’ gestation, smoking status, vigorous physical activity, alcohol consumption, Dietary Approaches to Stop Hypertension (DASH) diet score quintile, family history of hypertension, current oral contraceptive use, current nonnarcotic analgesic use, and self-reported race.
Table 2.
Association Between Duration of Breastfeeding for the First Child and Incident Hypertension Among 55,636 Parous Women in the Nurses’ Health Study II, United States, 1991–2005a
| Duration | No. of Cases | Person-Years | Age-adjusted Hazard Ratiob | 95% CI | Age- and IPW-adjusted Hazard Ratioc | 95% CI | Age-, IPW-,c and Current BMI-adjusted Hazard Ratiod | 95% CI |
| Total breastfeeding | ||||||||
| Never | 2,179 | 126,012 | 1.46 | 1.36, 1.57 | 1.27 | 1.18, 1.36 | 1.22 | 1.13, 1.31 |
| >0–3 months | 1,459 | 95,475 | 1.46 | 1.35, 1.57 | 1.29 | 1.20, 1.39 | 1.24 | 1.15, 1.33 |
| >3–<6 months | 1,639 | 125,370 | 1.28 | 1.19, 1.38 | 1.16 | 1.08, 1.25 | 1.13 | 1.05, 1.22 |
| 6–<9 months | 1,356 | 111,970 | 1.17 | 1.08, 1.26 | 1.11 | 1.03, 1.19 | 1.09 | 1.01, 1.17 |
| 9–<12 months | 1,014 | 89,853 | 1.07 | 0.99, 1.17 | 1.03 | 0.95, 1.11 | 1.03 | 0.96, 1.11 |
| ≥12 months | 1,214 | 112,200 | 1.00 | Referent | 1.00 | Referent | 1.00 | Referent |
| Ptrend | <0.001 | <0.001 | <0.001 | |||||
| Exclusive breastfeeding | ||||||||
| Never breastfed | 2,179 | 126,012 | 1.45 | 1.34, 1.56 | 1.29 | 1.20, 1.39 | 1.22 | 1.13, 1.31 |
| Breastfed, never exclusively | 2,801 | 198,791 | 1.32 | 1.23, 1.42 | 1.11 | 1.03, 1.19 | 1.07 | 1.00, 1.15 |
| >0–3 months exclusively | 1,491 | 118,373 | 1.19 | 1.10, 1.29 | 1.08 | 0.99, 1.18 | 1.08 | 0.99, 1.18 |
| >3–<6 months exclusively | 1,319 | 118,717 | 1.08 | 1.00, 1.17 | 1.03 | 0.95, 1.12 | 1.04 | 0.96, 1.13 |
| ≥6 months exclusively | 1,054 | 97,390 | 1.00 | Referent | 1.00 | Referent | 1.00 | Referent |
| Ptrend | <0.001 | <0.001 | <0.001 | |||||
Abbreviations: BMI, body mass index; CI, confidence interval; DASH, Dietary Approaches to Stop Hypertension; IPW, inverse probability weight.
Inverse probability weight-adjusted Cox proportional hazards regression models were used.
Adjusted for participant’s age and follow-up time in months.
Inverse probability weights derived from multinomial logistic regression model for probability of each breastfeeding duration category as a function of maternal BMI at age 18 years (linear and quadratic), year of first birth (linear and quadratic), self-reported history of preeclampsia, gestational hypertension, gestational diabetes, birth of an infant at <37 weeks’ gestation, birth of an infant weighing <2,500 g, miscarriage or stillbirth at >12 weeks’ gestation, smoking status, vigorous physical activity, alcohol consumption, DASH diet score quintile, family history of hypertension, current oral contraceptive use, current nonnarcotic analgesic use, and self-reported race.
BMI during follow-up modeled by using a 3-knot quadratic spline.
We then considered the degree of unobserved confounding that would explain our results. Assuming an unobserved binary confounding factor perfectly correlated with lactation in the longest duration category, we found that unmeasured confounders with effect sizes of 0.85 for ≥12 months’ total and 0.83 for ≥6 months’ exclusive lactation for the first child would be needed to explain the observed difference in incident hypertension among women in these groups versus those who had never breastfed. These effect sizes are similar in magnitude to the associations between 7 days/week of vigorous physical activity versus <1 day/week of vigorous activity (HR = 0.87, 95% CI: 0.81, 0.93) or a DASH diet score in the highest versus lowest quintile (HR = 0.82, 95% CI: 0.77, 0.87) in prior studies (3).
To determine whether measuring health behaviors at the time of the first birth affected our results, we limited our population to 8,318 women with a first birth after 1989. In IPW-adjusted models, we found a hazard ratio = 1.31 (95% CI: 1.00, 1.71) for women who never lactated and 1.40 (95% CI: 1.07, 1.82) for women who lactated for >0–3 months compared with women who lactated for ≥12 months. Adjustment for BMI during follow-up modestly attenuated these associations (never vs. ≥12 months, HR = 1.22, 95% CI: 0.93, 1.60; >0–3 vs. ≥12 months, HR = 1.22, 95% CI: 0.93, 1.59).
We then estimated the population-attributable risk due to suboptimal lactation, defined as <6 months’ exclusive lactation and/or <12 months’ total lactation, and incident hypertension. If this association is causal, we estimate that 12% (95% CI: 4.9, 19) of incident hypertension in our population could be attributed to suboptimal lactation.
In a secondary analysis, we measured the association between mean lactation duration per child and incident hypertension in the full study cohort (Table 3). With adjustment for lifestyle covariates and hypertension risk factors, we found a 1.22-fold risk (95% CI: 1.13, 1.32) (across breastfeeding duration categories, Ptrend < 0.001), comparing women who had never breastfed versus those who lactated ≥12 months per child. Curtailed lactation was also associated with increased risk: compared with ≥12 months per child, women with >0 –3 or >3–<6 months per child had a 1.21-fold (95% CI: 1.12, 1.30) and a 1.19-fold (95% CI: 1.11, 1.28) increased risk of incident hypertension in covariate-adjusted models. We similarly found an increased risk of incident hypertension with never or curtailed exclusive lactation (Table 3). With adjustment for covariates, we found a 1.16-fold risk (95% CI: 1.05, 1.27) (across breastfeeding duration categories, Ptrend < 0.001) for women who had never breastfed compared with a mean exclusive duration of 6 months or more. These results were materially unchanged with adjustment for current BMI and parity.
Table 3.
Association Between Mean Duration of Total and Exclusive Lactation per Child and Incident Hypertension Among 59,852 Parous Women in the Nurses’ Health Study II, United States, 1991–2005a
| No. of Cases | Person-Years | Age-adjusted Hazard Ratiob | 95% CI | Age- and Covariate-adjusted Hazard Ratioc | 95% CI | Age-, Covariate-, and Current BMI-adjusted Hazard Ratiod | 95% CI | Age-, Covariate-, Current BMI-, and Parity-adjusted Hazard Ratio | 95% CI | |
| Mean total duration/child | ||||||||||
| Never breastfed | 1,522 | 89,026 | 1.48 | 1.38, 1.60 | 1.22 | 1.13, 1.32 | 1.20 | 1.10, 1.29 | 1.16 | 1.07, 1.26 |
| >0–3 months | 1,893 | 127,191 | 1.43 | 1.33, 1.54 | 1.21 | 1.12, 1.30 | 1.14 | 1.06, 1.23 | 1.13 | 1.05, 1.22 |
| >3–<6 months | 1,930 | 143,362 | 1.32 | 1.23, 1.42 | 1.19 | 1.11, 1.28 | 1.14 | 1.06, 1.22 | 1.13 | 1.05, 1.21 |
| 6–<9 months | 1,525 | 125,810 | 1.17 | 1.08, 1.26 | 1.09 | 1.02, 1.18 | 1.07 | 0.99, 1.15 | 1.07 | 0.99, 1.15 |
| 9–<12 months | 1,049 | 87,155 | 1.14 | 1.05, 1.24 | 1.07 | 0.99, 1.17 | 1.07 | 0.99, 1.16 | 1.08 | 0.99, 1.17 |
| ≥12 months | 1,282 | 119,499 | 1.00 | Referent | 1.00 | Referent | 1.00 | Referent | 1.00 | Referent |
| Ptrend | <0.001 | <0.001 | <0.001 | <0.001 | ||||||
| Mean exclusive duration/child | ||||||||||
| Never breastfed | 1,522 | 89,026 | 1.45 | 1.32, 1.58 | 1.16 | 1.05, 1.27 | 1.14 | 1.04, 1.26 | 1.12 | 1.02, 1.23 |
| Breastfed, never exclusively | 2,337 | 162,909 | 1.34 | 1.23, 1.46 | 1.14 | 1.04, 1.24 | 1.10 | 1.01, 1.20 | 1.09 | 1.00, 1.19 |
| >0–3 months | 2,288 | 172,266 | 1.24 | 1.13, 1.35 | 1.08 | 0.99, 1.18 | 1.06 | 0.97, 1.15 | 1.07 | 0.98, 1.16 |
| >3–<6 months | 1,914 | 164,355 | 1.10 | 1.01, 1.20 | 1.04 | 0.95, 1.13 | 1.03 | 0.95, 1.13 | 1.04 | 0.95, 1.13 |
| ≥6 months | 707 | 65,167 | 1.00 | Referent | 1.00 | Referent | 1.00 | Referent | 1.00 | Referent |
| Ptrend | <0.001 | <0.001 | 0.001 | 0.01 | ||||||
Abbreviations: BMI, body mass index; CI, confidence interval; DASH, Dietary Approaches to Stop Hypertension.
Multivariable Cox proportional hazards regression models were used.
Adjusted for participant’s age and follow-up time in months.
Covariate-adjusted models include maternal BMI at age 18 years (linear and quadratic), year of first birth (linear and quadratic), self-reported history of preeclampsia, gestational hypertension, gestational diabetes, birth of an infant at <37 weeks’ gestation, birth of an infant weighing <2,500 g, miscarriage or stillbirth at >12 weeks’ gestation, smoking status, vigorous physical activity, alcohol consumption, DASH diet score quintile, family history of hypertension, current oral contraceptive use, current nonnarcotic analgesic use, and self-reported race.
BMI during follow-up modeled by using a 3-knot quadratic spline.
We found that adjustment for ever-history of preeclampsia slightly attenuated associations between lactation duration and incident hypertension. Our results were materially unchanged with adjustment for other pregnancy complications. We found no evidence for an interaction between ever-history of gestational hypertension or preeclampsia, lactation duration, and incident hypertension (for log likelihood ratio test, all P > 0.15).
DISCUSSION
We found a direct association between never or curtailed lactation and incident hypertension in a large, prospective cohort of parous women. We found an increased risk of hypertension among women who breastfed each child for <9 months compared with women who breastfed each child for ≥12 months, as well as among women who never breastfed exclusively, compared with women who breastfed exclusively for ≥6 months per child. This association persisted after adjustment for multiple hypertension risk factors by using 2 modeling approaches. In addition, we quantified the degree of unmeasured confounding that would explain observed associations. Our results strengthen the evidence for a causal association between never or curtailed breastfeeding and maternal hypertension.
Our findings confirm and extend earlier work linking lactation with blood pressure regulation. Light et al. (32) reported higher maternal blood pressure among formula-feeding mothers versus lactating mothers after infant feeding. Others have described increased autonomic and hypothalamic-pituitary-adrenal axis stress response to stressors among formula-feeding versus breastfeeding women (33, 34).
Authors have also previously reported differences in hypertension associated with lifetime lactation (Table 4). Lee et al. (4) assessed incident hypertension among 177,749 parous women in the Korean Women’s Cohort Study and found the lowest risk among women with 1–6 months of lifetime lactation (vs. never having lactated, relative risk = 0.90, 95% CI: 0.87, 0.93). Lactation duration was associated with lower hypertension prevalence among women in the Study of Women’s Health Across the Nation (SWAN) (n = 2,516) (per year of lifetime lactation, odds ratio = 0.90, 95% CI: 0.81, 0.996) (11). Schwarz et al. (5) assessed prevalent hypertension in the Women’s Health Initiative (n = 139,681) and found a dose-dependent inverse association (for ≥24 months’ lactation vs. never, odds ratio = 0.87, 95% CI: 0.82, 0.93) (Ptrend < 0.001). This association persisted with adjustment for maternal BMI.
Table 4.
Published Studies of the Association Between Lactation History and Maternal Hypertension Among Korean and US Women, 2005–2011
| First Author, Year (Reference No.) | Populations and Covariates Included | Outcomea | Ever vs. Never |
Duration Categories | By Duration |
||
| Multivariate-adjusted Estimate | 95% CI | Multivariate-adjusted Effect Estimate | 95% CI | ||||
| Lee, 2005 (4) | Premenopausal Korean women, >20 years, without prevalent hypertension at baseline | Incident documented hypertension (SBP >140, DBP >90, or antihypertensive medications) | 0.92 | 0.90, 0.96 | Lifetime vs. never | ||
| Age, obesity, smoking, alcohol drinking, exercise, number of children, and age at first pregnancy | Never | 1.00 | Referent | ||||
| 1–6 months | 0.90 | 0.87, 0.93 | |||||
| 7–12 months | 0.92 | 0.87, 0.98 | |||||
| 13–18 months | 0.93 | 0.86, 0.99 | |||||
| 19–24 months | 1.00 | 0.91, 1.11 | |||||
| >24 months | 1.06 | 0.99, 1.14 | |||||
| Schwarz, 2009 (5) | Postmenopausal US women, 50–79 years, generally healthy | Prevalent hypertension (either self-reported treatment or documented SBP >140, DBP >90) | Not reported | Lifetime vs. never | |||
| Age; race; parity; age at menopause; education; income; family history of diabetes mellitus, myocardial infarction, or stroke; tobacco history; current physical activity; energy, cholesterol, fat, fiber, and sodium intakes; hormone therapy; aspirin; and multivitamin use | Never | 1.00 | Referent | ||||
| 1–6 months | 0.95 | 0.92, 0.98 | |||||
| 7–12 months | 0.88 | 0.84, 0.91 | |||||
| 13–23 months | 0.89 | 0.84, 0.93 | |||||
| ≥24 months | 0.87 | 0.82, 0.93 | |||||
| Ptrend | <0.001 | ||||||
| Ram, 2008 (11) | Premenopausal US women aged 42–52 years, with an intact uterus, 1 ovary, no use of hormones in past 3 months | Prevalent documented elevated blood pressure (SBP >135, DBP >85, or antihypertensive medications) | 0.83 | 0.68, 0.998 | Per year lifetime | 0.90 | 0.81, 0.996 |
| Age, smoking history, parity, ethnicity, study site, socioeconomic status, high school BMI, current physical activity, and daily caloric intake | |||||||
| Stuebe, 2011 (current study) | Parous US women aged 27–44 years without prevalent hypertension, diabetes, cardiovascular disease, hyperlipidemia, or cancer in 1991 | Incident self-reported hypertension | Not reported | Duration first child vs. ≥12 months | |||
| Maternal BMI at age 18 years, year of first birth, self-reported history of preeclampsia, gestational hypertension, gestational diabetes, birth of an infant at <37 weeks’ gestation, birth of an infant weighing <2,500 g, miscarriage or stillbirth at >12 weeks’ gestation, smoking status, vigorous physical activity, alcohol consumption, DASH diet score quintile, family history of hypertension, current oral contraceptive use, current nonnarcotic analgesic use, and self-reported race | Never | 1.27 | 1.18, 1.36 | ||||
| >0–3 months | 1.29 | 1.20, 1.39 | |||||
| >3–<6 months | 1.16 | 1.08, 1.25 | |||||
| 6–<9 months | 1.11 | 1.03, 1.19 | |||||
| 9–<12 months | 1.03 | 0.95, 1.11 | |||||
| ≥12 months | 1.00 | Referent | |||||
Abbreviations: BMI, body mass index; CI, confidence interval; DASH, Dietary Approaches to Stop Hypertension; DBP, diastolic blood pressure; SBP, systolic blood pressure.
Blood pressure measurements are given as mm Hg.
We similarly found that adjustment for BMI did not fully explain associations between curtailed lactation and hypertension risk. We speculate that differences may be mediated, in part, by the neuropeptide oxytocin, working centrally and/or peripherally. Oxytocin is released during lactation to facilitate milk let-down, and converging evidence supports a regulatory role for oxytocin on autonomic cardiac control. Animal studies show that oxytocin administration causes changes in blood pressure regulation that persist for at least 3 weeks after discontinuation (15). Moreover, central oxytocinergic fibers inhibit sympathetic and promote parasympathetic activity to the heart (35, 36). In the periphery, oxytocin binding to cardiac and vascular endothelial receptors reduces the heart rate and enhances vasodilation (37, 38). Postpartum oxytocin levels are associated with reduced stress-induced vasoconstriction and norepinephrine, a biomarker of sympathetic activation (39). We speculate that lactation leads to changes in central oxytocin release and/or peripheral receptor expression that persist after weaning, thereby diminishing blood pressure in later life. Prolactin may also play a role. Zhang et al. (16) recently reported a direct association between serum prolactin and incident hypertension in the Nurses’ Health Study. Never breastfeeding was associated with higher prolactin in 1 prospective cohort study (40), although not in the Nurses’ Health Study cohort (41).
Our findings must be interpreted in the context of the study design. Both obesity and insulin resistance are associated with lactation difficulties, suggesting that curtailed lactation could be a marker for metabolic risk (42, 43). These associations may explain the slightly higher risk of incident hypertension among women with >0–3 months of lactation for their first child compared with those who never breastfed. Moreover, pregnancy complications, such as preeclampsia or preterm birth, may interfere with lactation, and these conditions are risk factors for later cardiovascular disease. A key strength of our study was our inclusion of BMI at age 18 years and pregnancy complications in our adjusted models. Our results do not support our hypothesis that pregnancy complications confound associations between breastfeeding and maternal health. Nevertheless, we cannot exclude the possibility that optimal lactation duration may be a marker for health, rather than a mechanism to prevent subsequent disease.
Unmeasured confounders are another concern. A woman whose circumstances allow optimal lactation may experience less chronic stress and thus face a lower risk of hypertension (44). However, when we performed a sensitivity analysis, we found that our results were robust. We found that unmeasured confounders would have to be as strongly associated with hypertension as 30 minutes per day of vigorous physical activity versus no physical activity or DASH diet score in the highest versus lowest quintile to explain our findings.
Of note, all participants in our study are registered nurses, and 94% are Caucasian, so confounding by race or socioeconomic status is less likely than in a more diverse cohort. Nevertheless, if the choice of nursing as an occupation is correlated with unobserved determinants of health, then conditioning on occupation could affect observed associations (45). In this case, nursing as an occupation would serve as a collider, potentially biasing our results.
Missing data are another concern. We found that women missing data on breastfeeding were more likely to be nonwhite, to be smokers, and to be missing other health behavior data, suggesting that women who were included in our analysis may be more health conscious, potentially biasing our results. Finally, misclassification is also a potential concern. Promislow et al. (46) compared recalled lactation with prospective menstrual diaries and found overall correlation of 0.55, with a mean difference between recorded and recalled duration of 0 (standard deviation, 2.7) months, indicating no overall recall bias. If such misclassification occurred in our cohort, it would likely bias our results toward the null; thus, our observed association may underestimate the true association.
In conclusion, we found that never or curtailed lactation is associated with increased incident hypertension among parous women, independent of BMI. If this association is causal, 12% of incident hypertension cases among parous women can be attributed to suboptimal breastfeeding. Policies that increase support for breastfeeding mothers (47) may decrease the burden of hypertensive disease among parous women.
Acknowledgments
Author affiliations: Department of Obstetrics and Gynecology, School of Medicine, University of North Carolina, Chapel Hill, North Carolina (Alison M. Stuebe); Department of Psychiatry, School of Medicine, University of North Carolina, Chapel Hill, North Carolina (Karen Grewen); Department of Maternal-Child Health, Gillings Global School of Public Health, University of North Carolina at Chapel Hill, Chapel Hill, North Carolina (Alison M. Stuebe, E. Michael Foster); Department of Health Policy and Administration, Gillings Global School of Public Health, University of North Carolina at Chapel Hill, Chapel Hill, North Carolina (E. Michael Foster); Department of Medicine, Center for Research on Health Care, University of Pittsburgh, Pittsburgh, Pennsylvania (Eleanor B. Schwarz); Department of Epidemiology, Center for Research on Health Care, University of Pittsburgh, Pittsburgh, Pennsylvania (Eleanor B. Schwarz); Department of Obstetrics, Gynecology, and Reproductive Sciences, Center for Research on Health Care, University of Pittsburgh, Pittsburgh, Pennsylvania (Eleanor B. Schwarz); Department of Epidemiology, Harvard School of Public Health, Boston, Massachusetts (Janet W. Rich-Edwards, Karen B. Michels, Gary Curhan); Department of Nutrition, Harvard School of Public Health, Boston, Massachusetts (Karen B. Michels); Division of Women’s Health, Brigham and Women’s Hospital, Harvard Medical School, Boston, Massachusetts (Janet W. Rich-Edwards); Department of Obstetrics, Gynecology, and Reproductive Biology, Obstetrics and Gynecology Epidemiology Center, Harvard Medical School, Boston, Massachusetts (Karin B. Michels); and Renal Division and Channing Laboratory, Department of Medicine, Brigham and Women’s Hospital, Harvard Medical School, Boston, Massachusetts (Gary Curhan, John Forman).
This study was funded by the American Heart Association (grant 0535401T) and by the National Institutes of Health (grants HL079929-01A2, CA50385, and 5K12HD050113-04 to A. M. S.).
The authors thank Eileen Hibert for technical support.
Preliminary findings were presented at the 57th Annual Meeting of the Society for Gynecological Investigation, Orlando, Florida, March 24–27, 2010.
Dr. Foster has received grant support from the Mead Johnson Center for Clinical Excellence. The other authors have no conflicts of interest to disclose.
Glossary
Abbreviations
- BMI
body mass index
- CI
confidence interval
- DASH
Dietary Approaches to Stop Hypertension
- HR
hazard ratio
- IPW
inverse probability weight
References
- 1.Ong KL, Cheung BM, Man YB, et al. Prevalence, awareness, treatment, and control of hypertension among United States adults 1999–2004. Hypertension. 2007;49(1):69–75. doi: 10.1161/01.HYP.0000252676.46043.18. [DOI] [PubMed] [Google Scholar]
- 2.Lowe LP, Greenland P, Ruth KJ, et al. Impact of major cardiovascular disease risk factors, particularly in combination, on 22-year mortality in women and men. Arch Intern Med. 1998;158(18):2007–2014. doi: 10.1001/archinte.158.18.2007. [DOI] [PubMed] [Google Scholar]
- 3.Forman JP, Stampfer MJ, Curhan GC. Diet and lifestyle risk factors associated with incident hypertension in women. JAMA. 2009;302(4):401–411. doi: 10.1001/jama.2009.1060. [DOI] [PMC free article] [PubMed] [Google Scholar]
- 4.Lee SY, Kim MT, Jee SH, et al. Does long-term lactation protect premenopausal women against hypertension risk? A Korean women’s cohort study. Prev Med. 2005;41(2):433–438. doi: 10.1016/j.ypmed.2004.11.025. [DOI] [PubMed] [Google Scholar]
- 5.Schwarz EB, Ray RM, Stuebe AM, et al. Duration of lactation and risk factors for maternal cardiovascular disease. Obstet Gynecol. 2009;113(5):974–982. doi: 10.1097/01.AOG.0000346884.67796.ca. [DOI] [PMC free article] [PubMed] [Google Scholar]
- 6.Stuebe AM, Rich-Edwards JW, Willett WC, et al. Duration of lactation and incidence of type 2 diabetes. JAMA. 2005;294(20):2601–2610. doi: 10.1001/jama.294.20.2601. [DOI] [PubMed] [Google Scholar]
- 7.Villegas R, Gao YT, Yang G, et al. Duration of breast-feeding and the incidence of type 2 diabetes mellitus in the Shanghai Women’s Health Study. Diabetologia. 2008;51(2):258–266. doi: 10.1007/s00125-007-0885-8. [DOI] [PMC free article] [PubMed] [Google Scholar]
- 8.Schwarz EB, Brown JS, Creasman JM, et al. Lactation and maternal risk of type 2 diabetes: a population-based study. Am J Med. 2010;123(9):863.e1–863.e6. doi: 10.1016/j.amjmed.2010.03.016. [DOI] [PMC free article] [PubMed] [Google Scholar]
- 9.Gunderson EP, Lewis CE, Wei GS, et al. Lactation and changes in maternal metabolic risk factors. Obstet Gynecol. 2007;109(3):729–738. doi: 10.1097/01.AOG.0000252831.06695.03. [DOI] [PMC free article] [PubMed] [Google Scholar]
- 10.Gunderson EP, Jacobs DR, Jr, Chiang V, et al. Duration of lactation and incidence of the metabolic syndrome in women of reproductive age according to gestational diabetes mellitus status: a 20-year prospective study in CARDIA (Coronary Artery Risk Development in Young Adults) Diabetes. 2010;59(2):495–504. doi: 10.2337/db09-1197. [DOI] [PMC free article] [PubMed] [Google Scholar]
- 11.Ram KT, Bobby P, Hailpern SM, et al. Duration of lactation is associated with lower prevalence of the metabolic syndrome in midlife—SWAN, the Study of Women’s health Across the Nation. Am J Obstet Gynecol. 2008;198(3):268.e1–268.e6. doi: 10.1016/j.ajog.2007.11.044. [DOI] [PMC free article] [PubMed] [Google Scholar]
- 12.Stuebe AM, Michels KB, Willett WC, et al. Duration of lactation and incidence of myocardial infarction in middle to late adulthood. Am J Obstet Gynecol. 2009;200(2):138.e1–138.e8. doi: 10.1016/j.ajog.2008.10.001. [DOI] [PMC free article] [PubMed] [Google Scholar]
- 13.Schwarz EB, McClure CK, Tepper PG, et al. Lactation and maternal measures of subclinical cardiovascular disease. Obstet Gynecol. 2010;115(1):41–48. doi: 10.1097/AOG.0b013e3181c5512a. [DOI] [PMC free article] [PubMed] [Google Scholar]
- 14.Stuebe AM, Rich-Edwards JW. The reset hypothesis: lactation and maternal metabolism. Am J Perinatol. 2009;26(1):81–88. doi: 10.1055/s-0028-1103034. [DOI] [PMC free article] [PubMed] [Google Scholar]
- 15.Petersson M, Alster P, Lundeberg T, et al. Oxytocin causes a long-term decrease of blood pressure in female and male rats. Physiol Behav. 1996;60(5):1311–1315. doi: 10.1016/s0031-9384(96)00261-2. [DOI] [PubMed] [Google Scholar]
- 16.Zhang L, Curhan GC, Forman JP. Plasma prolactin level and risk of incident hypertension in postmenopausal women. J Hypertens. 2010;28(7):1400–1405. doi: 10.1097/HJH.0b013e328339f254. [DOI] [PMC free article] [PubMed] [Google Scholar]
- 17.Beck LF, Morrow B, Lipscomb LE, et al. Prevalence of selected maternal behaviors and experiences, Pregnancy Risk Assessment Monitoring System (PRAMS), 1999. MMWR Surveill Summ. 2002;51(2):1–27. [PubMed] [Google Scholar]
- 18.Pesa JA, Shelton MM. Health-enhancing behaviors correlated with breastfeeding among a national sample of mothers. Public Health Nurs. 1999;16(2):120–124. doi: 10.1046/j.1525-1446.1999.00120.x. [DOI] [PubMed] [Google Scholar]
- 19.Forman JP, Curhan GC, Taylor EN. Plasma 25-hydroxyvitamin D levels and risk of incident hypertension among young women. Hypertension. 2008;52(5):828–832. doi: 10.1161/HYPERTENSIONAHA.108.117630. [DOI] [PMC free article] [PubMed] [Google Scholar]
- 20.Wolf AM, Hunter DJ, Colditz GA, et al. Reproducibility and validity of a self-administered physical activity questionnaire. Int J Epidemiol. 1994;23(5):991–999. doi: 10.1093/ije/23.5.991. [DOI] [PubMed] [Google Scholar]
- 21.Gartner LM, Morton J, Lawrence RA, et al. Breastfeeding and the use of human milk. American Academy of Pediatrics Section on Breastfeeding. Pediatrics. 2005;115(2):496–506. doi: 10.1542/peds.2004-2491. [DOI] [PubMed] [Google Scholar]
- 22.American College of Obstetricians and Gynecologists. Breastfeeding: maternal and infant aspects. Special report from ACOG. ACOG Clin Rev. 2007;12(suppl 1):1S–16S. [Google Scholar]
- 23.Breastfeeding (position paper) 2001. Shawnee Mission, KS: American Academy of Family Physicians. ( http://www.aafp.org/online/en/home/policy/policies/b/breastfeedingpositionpaper.html) (Accessed June 10, 2009) [Google Scholar]
- 24.Foster EM. Is more treatment better than less? An application of propensity score analysis. Med Care. 2003;41(10):1183–1192. doi: 10.1097/01.MLR.0000089629.62884.22. [DOI] [PubMed] [Google Scholar]
- 25.Imbens GW. The Role of the Propensity Score in Estimating Dose-Response Functions. Cambridge, MA: National Bureau of Economic Research; 1999. [Google Scholar]
- 26.Robins JM. Association, causation, and marginal structural models. Synthese. 1999;121(1):151–179. [Google Scholar]
- 27.Greenland S. Dose-response and trend analysis in epidemiology: alternatives to categorical analysis. Epidemiology. 1995;6(4):356–365. doi: 10.1097/00001648-199507000-00005. [DOI] [PubMed] [Google Scholar]
- 28.Rosenbaum P. Observational Studies. 2nd ed. New York, NY: Springer; 2002. [Google Scholar]
- 29.Rosenbaum PR. Design of Observational Studies. 1st ed. New York, NY: Springer; 2009. [Google Scholar]
- 30.Spiegelman D, Hertzmark E, Wand HC. Point and interval estimates of partial population attributable risks in cohort studies: examples and software. Cancer Causes Control. 2007;18(5):571–579. doi: 10.1007/s10552-006-0090-y. [DOI] [PubMed] [Google Scholar]
- 31.Greenland S. Quantifying biases in causal models: classical confounding vs collider-stratification bias. Epidemiology. 2003;14(3):300–306. [PubMed] [Google Scholar]
- 32.Light KC, Smith TE, Johns JM, et al. Oxytocin responsivity in mothers of infants: a preliminary study of relationships with blood pressure during laboratory stress and normal ambulatory activity. Health Psychol. 2000;19(6):560–567. doi: 10.1037//0278-6133.19.6.560. [DOI] [PubMed] [Google Scholar]
- 33.Amico JA, Johnston JM, Vagnucci AH. Suckling-induced attenuation of plasma cortisol concentrations in postpartum lactating women. Endocr Res. 1994;20(1):79–87. doi: 10.3109/07435809409035858. [DOI] [PubMed] [Google Scholar]
- 34.Heinrichs M, Meinlschmidt G, Neumann I, et al. Effects of suckling on hypothalamic-pituitary-adrenal axis responses to psychosocial stress in postpartum lactating women. J Clin Endocrinol Metab. 2001;86(10):4798–4804. doi: 10.1210/jcem.86.10.7919. [DOI] [PubMed] [Google Scholar]
- 35.Jankowski M, Wang D, Hajjar F, et al. Oxytocin and its receptors are synthesized in the rat vasculature. Proc Natl Acad Sci U S A. 2000;97(11):6207–6211. doi: 10.1073/pnas.110137497. [DOI] [PMC free article] [PubMed] [Google Scholar]
- 36.Gutkowska J, Jankowski M, Mukaddam-Daher S, et al. Oxytocin is a cardiovascular hormone. Braz J Med Biol Res. 2000;33(6):625–633. doi: 10.1590/s0100-879x2000000600003. [DOI] [PubMed] [Google Scholar]
- 37.Szeto A, Nation DA, Mendez AJ, et al. Oxytocin attenuates NADPH-dependent superoxide activity and IL-6 secretion in macrophages and vascular cells. Am J Physiol Endocrinol Metab. 2008;295(6):E1495–E1501. doi: 10.1152/ajpendo.90718.2008. [DOI] [PMC free article] [PubMed] [Google Scholar]
- 38.Thibonnier M, Conarty DM, Preston JA, et al. Human vascular endothelial cells express oxytocin receptors. Endocrinology. 1999;140(3):1301–1309. doi: 10.1210/endo.140.3.6546. [DOI] [PubMed] [Google Scholar]
- 39.Grewen KM, Light KC. Plasma oxytocin is related to lower cardiovascular and sympathetic reactivity to stress. Biol Psychol. 2011;87(3):340–349. doi: 10.1016/j.biopsycho.2011.04.003. [DOI] [PMC free article] [PubMed] [Google Scholar]
- 40.Wang DY, de Stavola BL, Bulbrook RD, et al. The relationship between blood prolactin levels and risk of breast cancer in premenopausal women. Eur J Cancer Clin Oncol. 1987;23(10):1541–1548. doi: 10.1016/0277-5379(87)90098-8. [DOI] [PubMed] [Google Scholar]
- 41.Eliassen AH, Tworoger SS, Hankinson SE. Reproductive factors and family history of breast cancer in relation to plasma prolactin levels in premenopausal and postmenopausal women. Int J Cancer. 2007;120(7):1536–1541. doi: 10.1002/ijc.22482. [DOI] [PubMed] [Google Scholar]
- 42.Rasmussen KM, Hilson JA, Kjolhede CL. Obesity may impair lactogenesis II. J Nutr. 2001;131(11 suppl):3009S–3011S. doi: 10.1093/jn/131.11.3009S. [DOI] [PubMed] [Google Scholar]
- 43.Sebire NJ, Jolly M, Harris JP, et al. Maternal obesity and pregnancy outcome: a study of 287,213 pregnancies in London. Int J Obes Relat Metab Disord. 2001;25(8):1175–1182. doi: 10.1038/sj.ijo.0801670. [DOI] [PubMed] [Google Scholar]
- 44.Steptoe A, Willemsen G. The influence of low job control on ambulatory blood pressure and perceived stress over the working day in men and women from the Whitehall II cohort. J Hypertens. 2004;22(5):915–920. doi: 10.1097/00004872-200405000-00012. [DOI] [PubMed] [Google Scholar]
- 45.Hernán MA, Hernández-Díaz S, Robins JM. A structural approach to selection bias. Epidemiology. 2004;15(5):615–625. doi: 10.1097/01.ede.0000135174.63482.43. [DOI] [PubMed] [Google Scholar]
- 46.Promislow JH, Gladen BC, Sandler DP. Maternal recall of breastfeeding duration by elderly women. Am J Epidemiol. 2005;161(3):289–296. doi: 10.1093/aje/kwi044. [DOI] [PubMed] [Google Scholar]
- 47.US Department of Health and Human Services. The Surgeon General’s Call to Action to Support Breastfeeding. Washington, DC: Office of the Surgeon General, US Department of Health and Human Services; 2011. [Google Scholar]