

Abstract
Family-based designs protect analyses of genetic effects from bias that is due to population stratification. Investigators have assumed that this robustness extends to assessments of gene-environment interaction. Unfortunately, this assumption fails for the common scenario in which the genotyped variant is related to risk through linkage with a causative allele. Bias also plagues other methods of assessment of gene-environment interaction. When testing against multiplicative joint effects, the case-only design offers excellent power, but it is invalid if genotype and exposure are correlated in the population. The authors describe 4 mechanisms that produce genotype-exposure dependence: exposure-related genetic population stratification, effects of family history on behavior, genotype effects on exposure, and selective attrition. They propose a sibling-augmented case-only (SACO) design that protects against the former 2 mechanisms and is therefore valid for studying young-onset disease in which genotype does not influence exposure. A SACO design allows the ascertainment of genotype and exposure for cases and exposure for 1 or more unaffected siblings selected randomly. Conditional logistic regression permits assessment of exposure effects and gene-environment interactions. Via simulations, the authors compare the likelihood-based inference on interactions using the SACO design with that based on other designs. They also show that robust analyses of interactions using tetrads or disease-discordant sibling pairs are equivalent to analyses using the SACO design.
Keywords: environment, epidemiologic methods, family, genes, logistic models, population
Investigators have come to appreciate that the etiology of complex diseases typically involves genetic variants that act in concert with other genetic and environmental factors. Unfortunately, higher-order effects can be statistically hard to detect, even when setting aside philosophical debates about biologic versus statistical interaction and adopting the convenient multiplicative null model.
The case-only approach (1) offers some welcome benefits. It sidesteps the expense and other issues related to identifying and recruiting a suitable control group. Moreover, it provides markedly better power for interaction than does the case-control approach by exploiting a sometimes-plausible assumption that exposure, E, and susceptibility genotype, G, occur independently in the population at large. Under independence, a case-only analysis provides as much statistical power as would a case-control study with the same number of cases but an infinite number of controls.
The case-only method has 2 main problems. First, it assesses only interaction, and the interaction parameter by itself, without knowledge of either the main effects of exposure or of genotype, has limited interpretability. We could find, for example, that the relative risk associated with exposure is higher in persons with a particular genotype G1 than in those without. However, this finding is difficult to interpret without knowing whether, in the absence of G1, exposure reduces risk, increases risk, or has no effect at all. Second, and more importantly, its inferences are biased when independence fails.
Independence can fail when subpopulations that share ancestry also tend to share patterns of exposure, because beliefs and cultural habits travel together with genes, a situation that we call exposure-related genetic population stratification. Italian Americans might have a higher prevalence of a particular variant allele and might also consume more prosciutto. These correlations might not be due to ethnicity as usually conceived; shared diets and shared ancestry can both be secondary to a geographic gradient (e.g., coastal versus mountain residence), even among those with shared ethnicity. In addition, correlations are seen between genetic variants on different chromosomes (2), which should be inherited independently by each offspring. Such correlations are caused by genetic population stratification: Subpopulations must differ in allele prevalence at unlinked loci. Genetic population stratification is exposure-related when haplotype prevalences vary across subpopulations that differ in exposure prevalence.
Another potential source of correlation between genetic and environmental factors in a population is that knowing the history of disease in one’s family can affect behavior. For example, after having seen her mother die of lung cancer, a teenager might decide not to smoke. The existence of a particular genetic variant in that lineage could induce a negative genotype-exposure correlation by being a common cause of avoiding exposure and of having parents with a lung cancer susceptibility variant. A third source is that some genetic variants have a direct influence on personality or on behaviors such as alcohol consumption or smoking.
For diseases with an onset that typically occurs late in life, selective attrition due to mortality can be a fourth important cause of gene-environment correlation, making the independence assumption increasingly untenable for late-onset diseases. Both age and duration of disease can cause selective attrition. For example, a study of prevalent cases would be vulnerable to bias if the joint occurrence of the exposure and a genetic variant caused a predisposition to early death, either in the population as a whole or among prevalent cases. The independence assumption might be particularly problematic, for example, for a study of Parkinson’s disease. Bottom line: Correlation happens.
Assuming that the genes under study exert no causal effect on propensity to exposure and that the disease under study has an onset that is early enough to avoid bias within sibships due to selective attrition, 2 designs that use family data can be analyzed to provide robustness against the first 2 mechanisms when testing genotype-exposure interactions (3). One, a case-sibling design, requires ascertainment of genotypes and exposure for cases and their siblings, and the other, a tetrad design, requires ascertainment of genotypes from cases and parents and exposure for cases and their siblings.
We propose a sibling-augmented case-only (SACO) approach for assessing genotype-exposure interactions. This approach uses genetic and exposure information for cases that is augmented with exposure information from unaffected siblings of cases. The unaffected siblings are not genotyped; instead, we make the assumption (4) that genotype and exposure are independent within sibships and, hence, genotypes are exchangeable among siblings. (Mendelian inheritance need not be assumed.) We show that the SACO approach protects genotype-exposure inferences against bias due to the first 2 correlation mechanisms discussed above, leading to improved robustness compared with case-only analysis. As a by-product, using the SACO study design allows estimation of the marginal effect of a categorical exposure in the same way as any 1:1 matched design. In the present article, we evaluate the performance of the SACO approach for assessment of interactions under scenarios with exposure-related genetic population stratification. We also show that the SACO design is closely related to the 2 robust family-based approaches mentioned above (see the Web Appendix, available at http://aje.oxfordjournals.org/).
SACO DESIGN AND ANALYSIS
We assume a dichotomous exposure, a diallelic marker, and a multiplicative model for risk. The SACO design identifies sibships that contain 1 person diagnosed with a disease of interest and at least 1 who is unaffected. Our presentation assumes that only 1 randomly selected unaffected sibling is enrolled; however, the test remains valid when multiple unaffected siblings are included (Appendix). We assume within-sibship independence of genotype and exposure so that inheritance of a particular allele does not itself causally influence one’s propensity to be exposed, conditional on parental genotypes. (Of course, the exposures of siblings will likely be correlated, as will their genotypes, but our assumption allows such correlations.) We also assume that attrition due to outmigration and death either is negligible or does not depend jointly and nonmultiplicatively on both genotype and exposure. These assumptions, which exclude the third and fourth mechanisms mentioned above, are much weaker than assuming away all 4 mechanisms, as is required for the validity of case-only analysis. Stated simply, we assume that genotype and exposure are independent within sibships (conditional on parents) in the population, although often they will not be independent unconditionally.
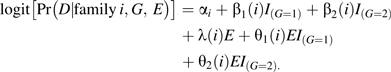
Let G denote the number of copies of the variant allele carried by an individual, and let E be a 0/1 indicator of exposure status. Suppose the risk for siblings in family i is described by the following logistic model:
 |
(1) |
By letting the risk parameters depend on i, we accommodate the common scenario in which the marker under study is not itself causal but is a surrogate linked to a nearby locus that bears a causative variant (if the causative variant is itself typed, the risk parameters, except the intercept, are assumed to be constant across families). The family-specific values of the β’s and the θ’s can be positive, negative, or 0, depending on whether the parents carry the causative variant and, if so, the exact (unknown) diplotypes of each parent at the marker and causative locus jointly. The distribution of the family-specific parameter values depends on the subpopulation from which the families come (e.g., their ancestral background) because haplotype frequencies (and consequently, the strength of linkage disequilibrium) could vary across subpopulations. This variation invalidates most existing methods for studying gene-environment interactions using nuclear families (3). For example, if the exposure is particularly common in a subpopulation with high linkage disequilibrium, then the marker relative risk is higher among the exposed, producing spurious evidence for interaction.
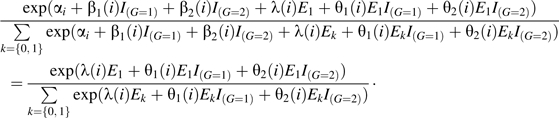
Under exchangeability of genotypes and conditional independence of G and E within sibships, the probability that the case has G and E1, given that one instance of genotype G and also the set {E1, E0} occur in the case and the unaffected sibling sampled from family i, is
 |
(2) |
This probability is the conditional likelihood contribution of a matched pair consisting of a case together with a pseudosibling who carries the case’s genotype and the control’s exposure. Our proposed analysis fits a conditional logistic model that regards the parameters λ, θ1, and θ2 (the exposure main effect parameter and the interaction parameters for 1 and 2 copies of the variant alleles, respectively) as constant across all families. These parameters reflect averages across family-specific parameters relative to the marker that happened to be typed (Appendix) and not relative to the causative single nucleotide polymorphism (SNP). The exposure main effect parameter, λ(i), depends on i only if G is a marker and genotype-exposure interaction is present at the causative SNP (Appendix). When there is no genotype-exposure interaction at the causative SNP, λ(i) does not depend on family i, and the no-interaction null holds at the marker (Appendix). Consequently, the SACO design is robust against exposure-related population stratification and allows the no-interaction null for the causative SNP to be tested using standard conditional logistic regression software applied to marker data. In addition, inference about genotype-exposure interaction using the SACO design is equivalent to the robust analysis (3) of either the tetrad design or the case-sibling design (Web Appendix).
In addition, the SACO design permits testing of the absence of any effect of E (which may reflect interactions) using a model that ignores G, that is, testing E as in any 1:1 matched case-control design. If E has multiple levels, one can treat it as a class variable. If E is continuous, assessment of G × E (using any design) requires specifying the functional relation between risk and E correctly. For dichotomous E, the likelihood contribution in equation 2 is uninformative unless E1 and E0 differ. For exposure-discordant pairs, the probability that the case is the one exposed simplifies to an unconditional logistic form:
| (3) |
Thus, with sibling pairs that are both exposure- and disease-discordant, the SACO-based conditional logistic analysis with pseudosiblings is equivalent to an unconditional logistic (or log-linear) analysis of the 3 × 2 (genotype × exposure) table of possible outcomes for the pair.
METHODS FOR ASSESSING TYPE I ERROR RATES AND POWER
We studied type I error rate and power for tests of genotype-exposure interaction for several study designs: our proposed SACO design with 1 unaffected sibling per case, the case-parent design (5), the tetrad design (3), the case-sibling design analyzed by enforcing within-sibship genotype-exposure independence (4), the population-based case-control design, and the original case-only design (1). We applied conditional logistic regression, using pseudosiblings as necessary, for the first 4 designs and unconditional logistic regression for the last 2 (details in Web Appendix). Restricting attention to dichotomous exposures, we considered scenarios in which the marker under study was related to risk only through linkage disequilibrium with an unmeasured causative SNP, assuming that linkage was strong enough that the recombination rate between the 2 loci in a single meiosis was effectively 0. Thus, we studied 2-locus haplotypes comprising SNPs at a causative locus and a marker locus.
To simulate exposure-related genetic population stratification, we constructed populations consisting of 2 equal-sized subpopulations, each mating only within itself. Each subpopulation had the same 4 two-SNP haplotypes in Hardy-Weinberg equilibrium but with frequencies that differed between subpopulations. (Hardy-Weinberg equilibrium, though convenient here, is not needed for validity.) For each subpopulation, we specified the following parameters: baseline disease risk, exposure prevalence, the marginal SNP frequencies at the causative locus and at the marker locus, and the correlation between them—quantities that determine the frequencies of the 4 haplotypes. To simulate homogeneous populations, we assigned the 2 subpopulations the same parameters. We based all our calculations on 1,000 families (plus 1,000 unrelated population controls for case-control studies). For family-based methods, the number of informative families was random and smaller than 1,000.
The vector (R1, R2, I1, I2, Re) represents the relative risk parameters associated with the causative variant in each subpopulation. R1, R2 (, ) are the relative risks for an unexposed person carrying 1 or 2 copies of the causal variant allele, respectively, relative to an unexposed person carrying no copies; I1, I2 (, ) are the interaction parameters, that is, the respective ratios of the 2 genotype relative risks in the exposed over the unexposed; and Re () is the relative risk associated with the exposure in noncarriers.
We calculated expected cell counts for the multinomial joint distribution of 2-SNP haplotypes and exposure in cases and unaffected siblings given the parental diplotypes. With 4 haplotypes, there are 10 distinct diplotypes and 100 pairs of ordered parental diplotypes, each with 4 possible (not necessarily distinct) offspring diplotypes or 16 possible case-sibling diplotype pairs, in which each sibling pair could have experienced 4 different exposure assignments. We imposed a rare disease assumption and assumed that siblings’ exposures were independent. Given (R1, R2, I1, I2, Re), the subpopulation parameters, and the number of cases, we calculated expected cell counts for the 100 × 16 × 4 cells and summed across appropriate sets to calculate expected counts for each design studied.
We computed chi-squared noncentrality parameters (NCPs) by calculating log-likelihood-ratio test statistics from pseudodata that comprised expected cell counts from the multinomial distribution described above (5–7). We transformed values of the NCPs into power values for 2-sided tests with nominal type I error rate α = 0.05 using the cumulative distribution function for a noncentral χ2. Multiplying our NCP values by K/1,000 transforms them to NCPs for K cases instead of 1,000.
To investigate type I error rates for a marker under exposure-related population stratification, we considered a range of no-interaction null scenarios. The risk parameters in relation to the causative variant in each subpopulation were set at (R1, R2, I1, I2, Re) = (2, 3, 1, 1, 1.5). In 1 set of scenarios, subpopulations had the same baseline risks but different exposure prevalences (0.08 and 0.32). In each subpopulation, the frequencies of the causative SNP and the marker were both 0.3. We examined no-interaction scenarios across varying degrees of exposure-related population stratification as the correlation between the causative locus, and the marker ranged from −0.1 to 0.7 in one subpopulation and from 0.7 to −0.1 in the other. When the subpopulations have the same correlation, the population has no exposure-related genetic population stratification; as the 2 subpopulation-specific correlations diverge, the exposure-related stratification in the population grows. In another set of scenarios with the same allele frequencies as before, we fixed the correlations between the causative variant and marker at 0.5 and 0.1 in the 2 subpopulations and generated varying degrees of exposure-related population stratification by letting the exposure frequency range from 0.04 to 0.36 in one subpopulation and from 0.36 to 0.04 in the other.
We also assessed the power of tests of genotype-exposure interaction in a homogenous population assuming that the causative SNP was typed. Risk parameters were set at (R1, R2, I1, I2, Re) = (2, 3, 1.5, 2.25, 1.5) or (1, 1, 1.5, 2.25, 1.5). We used log-additive genetic coding for interaction with a saturated coding for genetic main effects (i.e., fitting 2 relative risk parameters) to ensure validity of the interaction test.
RESULTS FOR TYPE I ERROR RATES AND POWER
For analyses of a marker, the SACO approach maintained the nominal type I error rate under a no-interaction null under exposure-related genetic population stratification; all other methods showed inflated type I errors (Figure 1). The traditional case-only design showed the worst inflation, followed by the triad, case-control, tetrad, and case-sibling designs, although the triad and case-control designs showed similar rates.
Figure 1.

Type I error rates for tests of genotype-exposure interaction for 6 study designs in a population with exposure-related stratification. A) This population has 2 equal-sized subpopulations with the same baseline risks and risk parameters relative to the causative variant: (R1, R2, I1, I2, Re) = (2, 3, 1, 1, 1.5). Tests are 1-degree-of-freedom tests at nominal α = 0.05 for log-additive genotype-exposure interaction at an untyped causative variant using a marker that is related to risk only through linkage disequilibrium with that variant. The type I error rate is equivalent to the rate of coverage failure under the null for nominal 95% confidence intervals. The curves show the dependence of the type I error rate on the disparate exposure prevalences when the correlations between the causative single nucleotide polymorphism and marker are fixed at 0.5 and 0.1 in the respective subpopulations. E (pop 1) indicates the exposure prevalence in subpopulation 1; E (pop 2) indicates the exposure prevalence in subpopulation 2. Exposure-related stratification is absent when the subpopulation-specific exposure prevalences are equal (here at 0.2). B) As for Figure 1A, except that the curves now show the dependence of the type I error rate on differences in linkage disequilibrium when exposure prevalences are 0.08 and 0.32 in the 2 subpopulations. r (pop 1) indicates the correlation between the causative variant and the marker in subpopulation 1; r (pop 2) indicates the correlation between the causative variant and the marker in subpopulation 2. When the subpopulation-specific correlations (r) between the typed marker and the untyped causative variants are equal (here at 0.29), exposure-related stratification is eliminated, and all tests are unbiased. SACO, sibling-augmented case-only.
We compared power for 6 designs for testing genotype-exposure interaction in a homogeneous population (in which all are valid). We assumed that the causative SNP was typed and set (R1, R2, I1, I2, Re) = (2, 3, 1.5, 2.25, 1.5). As expected, case-only was the most powerful approach. With the allele frequency set at 0.3, the SACO design and case-control design had similar levels of statistical power across the range of exposure prevalences (Figure 2A). Alternatively, with the exposure prevalence set at 0.3, the SACO design had better power than did the case-control and case-parent designs when the causative allele frequency was less than 0.25, which is arguably the more typical scenario, but its power fell below that of the other two at higher allele frequencies (Figure 2B). For (R1, R2, I1, I2, Re) = (1, 1, 1.5, 2.25, 1.5), a scenario with no genotype main effects, the power relations among the designs were maintained when testing genotype-exposure interaction (data not shown).
Figure 2.
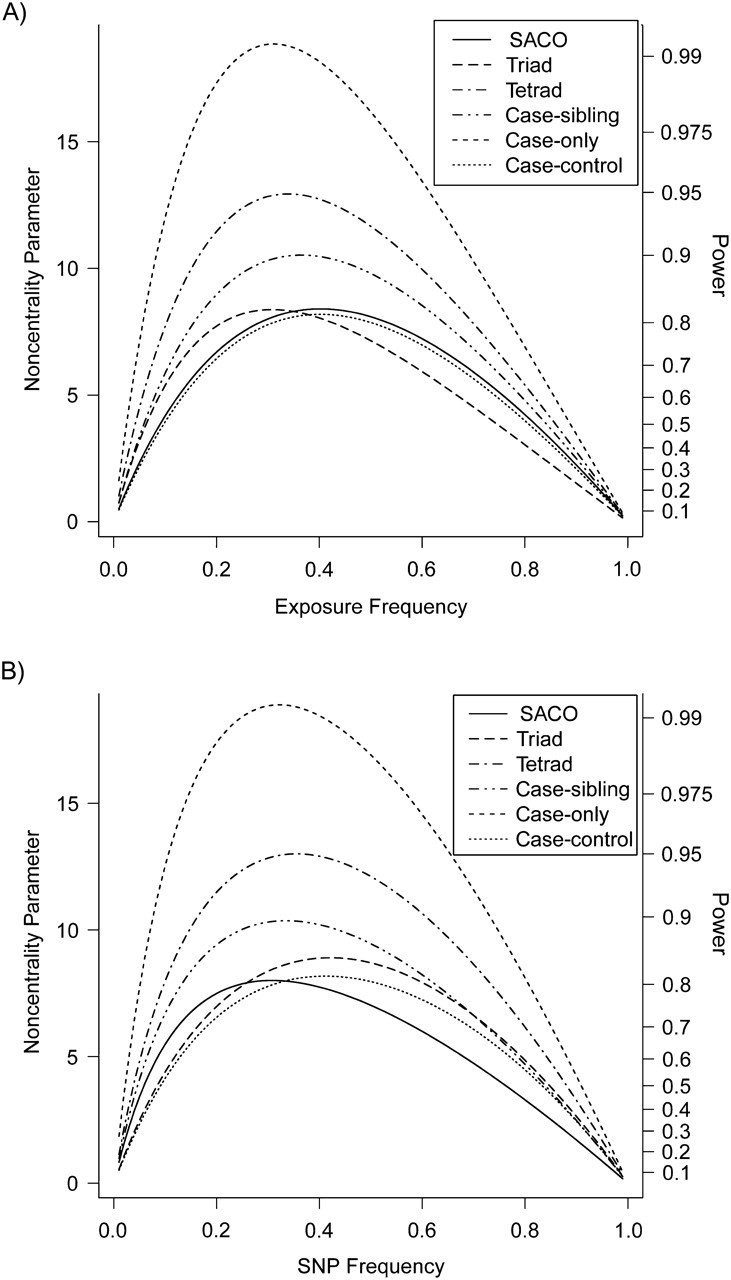
Statistical power for testing genotype-exposure interaction for 6 study designs, assuming a homogenous population in which all tests are valid. A) Curves show the power for testing genotype-exposure interaction for the 6 designs, assuming a homogenous population in which all tests are valid, as a function of exposure prevalence when the causative variant frequency is 0.3. Tests are 1-degree-of-freedom tests at α = 0.05 for log-additive genotype-exposure interaction at a typed causative variant. On the left y-axis is the noncentrality parameter based on 1,000 cases; on the right y-axis is the corresponding power. Tick marks indicate selected power levels. B) As in Figure 2A, except that the curves are now shown in relation to the frequency of the causative variant when the exposure prevalence is 0.3. SACO, sibling-augmented case-only; SNP, single nucleotide polymorphism.
DISCUSSION
We came to the SACO method after a disturbing odyssey that forced us to recognize that, when markers are studied, none of the available nuclear family-based methods, including our own (8, 9), was robust against bias from exposure-related population stratification (3). The basic issue was this: When exposure participates in population stratification (as it plausibly often does), exposure may predict the (subpopulation and hence the) degree of linkage disequilibrium between the marker under study and the causative variant, thereby biasing assessments of genotype-exposure interaction.
How often will exposure-related population stratification be strong enough to distort conclusions about interactions? Certain exposures likely do vary across geographic regions or cultural backgrounds—for example, dietary preferences. Corresponding scenarios in which linkage disequilibrium varies across subpopulations are easily constructed. For example, a single diallelic marker, A/a, and a nearby diallelic causative SNP, B/b, yield 4 possible 2-locus haplotypes: (A,B), (A,b), (a,B), and (a,b). If their respective frequencies are 0.4, 0.2, 0.2, and 0.2 in one subpopulation and 0.2, 0.2, 0.2, and 0.4 in the other, the respective correlations between A and B are 1/ and −1/. Such “flip-flops” actually do occur (10). Although plausible scenarios that exhibit exposure-related population stratification are easy to envision, we do not know how common or how strong its effects could be in practice.
In devising analytic methods to protect against this bias, we discovered that our new robust methods depended only on the case’s genotype, the case’s exposure, and the control sibling’s exposure—that is, on that subset of data collected by both the tetrad and the case-sibling designs. In particular, our robust analyses used neither the control sibling genotypes from the case-sibling data nor the parental genotypes from the tetrad data to estimate exposure or interaction effects (3) (Web Appendix). Thus, we have the surprising result that imposing analytic modifications to ensure robustness for testing genotype-exposure interactions revealed a simpler design, SACO, which is both robust and fairly efficient for studying interactions. Improvement in robustness necessarily implies a cost in power. When, as is typical, a marker rather than the causative locus is genotyped, the test for multiplicative interaction remains valid even though, of course, the parameter estimation is biased. However, the SACO approach cannot evaluate an additive null model for interaction, which would require estimates of genotype main effects.
We compared power among designs with the same number of cases. Each design, however, collects genotype or exposure data from a different set of subjects (Web Table 1), so other costs must be weighed when choosing a design. If genotyping is the major expense, then the case-only and SACO designs, which genotype only cases, are comparably inexpensive. Case-control and case-sibling studies both require twice the genotyping of case-only or SACO studies. In addition to genotyping costs, costs associated with recruitment and exposure assessment also require consideration.
When applied to genetic studies of sibships larger than 2, a conditional logistic regression model that retains the main effects of genotype is incorrectly specified at a marker because its structure does not fully capture statistical dependencies that arise through mixing different family-specific risk parameters (Appendix). Because the SACO design does not genotype the unaffected siblings and only assumes exchangeability of genotypes among offspring, the genotype main effects cancel when using the SACO approach, as in equation 2. Testing of the genotype-exposure interaction based on the SACO design remains valid with multiple unaffected siblings.
Practical considerations arise in applying the SACO method. Sibling pairs are sometimes available for study with little added effort—for example, when foundations have recruited families affected by a condition such as autism. Our own Two Sister Study (3) began with women who had joined our Sister Study cohort (11) because their sisters had been diagnosed with breast cancer; these participants had already contributed extensive exposure information. We identified those whose sisters had been diagnosed with cancer before the age of 50 years and then invited those sisters to contribute questionnaire data and a saliva sample for DNA extraction. In this way we recruited some 1,400 pairs of sisters, one of whom in each pair had young-onset breast cancer. A practical consideration is that certain confounders must be considered. Such factors should be straightforward to incorporate into the SACO logistic model. An issue that may affect study power because of overmatching is a possible correlation in the exposures experienced by siblings.
For simplicity, our NCP-based calculation assumed that siblings’ exposures were independent. When they are correlated, power will suffer. For the SACO design, the reduction in power is attributable to the reduced number of exposure-discordant sibships. Let ρ > 0 denote the within-sibship exposure correlation. If one sibling is exposed, the chance that the other sibling is exposed is
| (4) |
Here, f represents the exposure prevalence, and E1 and E2 are the exposures of the siblings. One can show that, all else being equal, the ratio of the expected number of informative pairs when sibling exposures are correlated to that when they are independent is (1 − ρ), and consequently the NCP based on independent exposures can be revised by multiplying it by (1 − ρ).
The robustness offered by the SACO method protects against sources of correlation between genotype and exposure that are related to shared ancestry or to behaviors that reflect family history of disease but not against all sources of genotype-exposure correlation. For example, if one studies a late-onset disease in which the population has undergone attrition related to both exposure and genotype, then within-sibship correlation between exposure and genotype can exist. To exclude consequent biases, we recommend that the SACO method be used only for conditions with sufficiently early onset to avoid selective attrition.
We have focused here on hypothesis testing rather than estimation for a simple reason. Studies of gene-environment interaction (e.g., in the context of a genome-wide association study) typically use SNP markers, which can be highly informative but are not true causal variants. Thus, regardless of whether the design is family-based or population-based, the models applied to assess genetic and environmental effects will be using a causative genotype that is measured with error. Caution must be exercised in interpreting estimates before truly functional allele(s) have been identified. Nonetheless, we have demonstrated how to construct valid tests of null hypotheses about multiplicative genotype-exposure interactions for causal variants, even when the causal variants themselves are unmeasured and only a correlated marker locus is genotyped.
Supplementary Material
Acknowledgments
Author affiliation: Biostatistics Branch, National Institute of Environmental Health Sciences, Research Triangle Park, North Carolina (Clarice R. Weinberg, Min Shi, David M. Umbach).
This research was supported by the Intramural Research Program of the National Institutes of Health, National Institute of Environmental Health Sciences, under project numbers Z01 ES040007 and Z01 ES045002.
Conflict of interest: none declared.
Glossary
Abbreviations
- NCP
noncentrality parameter
- SACO
sibling-augmented case-only
- SNP
single nucleotide polymorphism
APPENDIX
Consider a typical scenario in which the causative SNP resides at one locus but the study genotypes another locus, a marker SNP that is related to risk only through its linkage disequilibrium with the causative SNP. The marker genotype provides, at best, a proxy for the unmeasured causative locus. We start by establishing the relation between risk models based on the causative SNP and models based on the marker SNP that was measured.
Let G be the number of copies of the variant allele at a marker locus that is in linkage disequilibrium with a single causative locus. Suppose family i contains 1 case and 1 unaffected sibling and that they are exposure-discordant. The conditional probability that the case is exposed (from equation 3 in the main text) is
| (A1) |
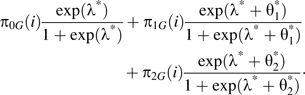
The marker-based risk coefficients are specific to the family, indexed by i, because offspring share parents. In relation to the causative allele, the same conditional probability can be expressed as
 |
(A2) |
Here, the parameters λ*, , and are the exposure main effect and the genotype-exposure interaction parameters, respectively, for the genotype at the causative locus. The ith 3 × 3 matrix, , holds the probabilities that an offspring in family i carries j copies of the causative allele, given that they carry G copies of the marker allele. If the marker and the causative locus coincide (so that whenever j = G, πjG(i) = 1 for every i and, otherwise, πjG(i) = 0), then , , and for every i. If the causative locus is not involved in a genotype-exposure interaction (i.e., ), then the marker interaction parameters are 0 for every family (i.e., for every i) and the exposure main effect is constant for all families (i.e., for every i). Thus, a multiplicative null genotype-exposure model at the causative SNP can validly be tested by using data from the marker SNP.
Additional observations follow from considering equations A1 and A2. First, because averaging across families yields probabilities for the genotype-exposure (3 × 2) table for cases, one can model those averaged probabilities logistically with 3 parameters. These parameters for averaged probabilities will, in general, differ from those for the causative SNP. In particular, the interaction parameters estimated by using the SACO method are biased for the corresponding parameters at the causative locus when a marker is typed. Second, the family-specific parameters and the parameters relative to the causative SNP will not in general be the same and need not even have the same sign. Finally, because the no-interaction null at the causative SNP implies a no-interaction null at the marker SNP, using logistic regression for testing based on data where some families contribute more than one unaffected sibling remains valid.
References
- 1.Piegorsch WW, Weinberg CR, Taylor JA. Non-hierarchical logistic models and case-only designs for assessing susceptibility in population-based case-control studies. Stat Med. 1994;13(2):153–162. doi: 10.1002/sim.4780130206. [DOI] [PubMed] [Google Scholar]
- 2.Bhattacharjee S, Wang Z, Ciampa J, et al. Using principal components of genetic variation for robust and powerful detection of gene-gene interactions in case-control and case-only studies. Am J Hum Genet. 2010;86(3):331–342. doi: 10.1016/j.ajhg.2010.01.026. [DOI] [PMC free article] [PubMed] [Google Scholar]
- 3.Shi M, Umbach DM, Weinberg CR. Family-based gene-by-environment interaction studies: revelations and remedies. Epidemiology. 2011;22(3):400–407. doi: 10.1097/EDE.0b013e318212fec6. [DOI] [PMC free article] [PubMed] [Google Scholar]
- 4.Chatterjee N, Kalaylioglu Z, Carroll RJ. Exploiting gene-environment independence in family-based case-control studies: increased power for detecting associations, interactions and joint effects. Genet Epidemiol. 2005;28(2):138–156. doi: 10.1002/gepi.20049. [DOI] [PubMed] [Google Scholar]
- 5.Self SG, Longton G, Kopecky KJ, et al. On estimating HLA/disease association with application to a study of aplastic anemia. Biometrics. 1991;47(1):53–61. [PubMed] [Google Scholar]
- 6.Agresti A. Categorical Data Analysis. New York, NY: John Wiley & Sons, Inc; 1990. [Google Scholar]
- 7.Longmate JA. Complexity and power in case-control association studies. Am J Hum Genet. 2001;68(5):1229–1237. doi: 10.1086/320106. [DOI] [PMC free article] [PubMed] [Google Scholar]
- 8.Shi M, Umbach DM, Weinberg CR. Testing haplotype-environment interactions using case-parent triads. Hum Hered. 2010;70(1):23–33. doi: 10.1159/000298326. [DOI] [PMC free article] [PubMed] [Google Scholar]
- 9.Umbach DM, Weinberg CR. The use of case-parent triads to study joint effects of genotype and exposure. Am J Hum Genet. 2000;66(1):251–261. doi: 10.1086/302707. [DOI] [PMC free article] [PubMed] [Google Scholar]
- 10.Lin PI, Vance JM, Pericak-Vance MA, et al. No gene is an island: the flip-flop phenomenon. Am J Hum Genet. 2007;80(3):531–538. doi: 10.1086/512133. [DOI] [PMC free article] [PubMed] [Google Scholar]
- 11.Weinberg CR, Shore DL, Umbach DM, et al. Using risk-based sampling to enrich cohorts for endpoints, genes, and exposures. Am J Epidemiol. 2007;166(4):447–455. doi: 10.1093/aje/kwm097. [DOI] [PMC free article] [PubMed] [Google Scholar]
Associated Data
This section collects any data citations, data availability statements, or supplementary materials included in this article.